Agar Market Size and Share Forecast Outlook 2025 to 2035

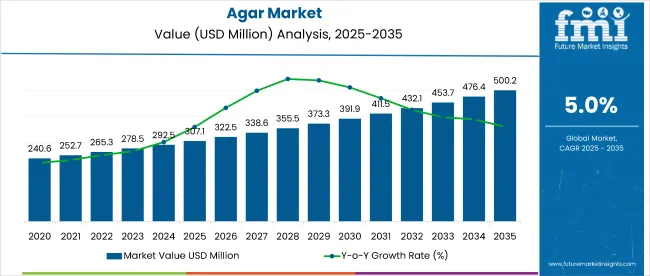
The global agar market is valued at USD 307.1 million in 2025 and is expected to reach USD 500.2 million by 2035, registering a CAGR of 5%. Market expansion is driven by rising demand for plant-based and vegan alternatives, increased agar applications in functional foods, and the growing importance of clean-label products across food, pharmaceutical, and cosmetic sectors. Additionally, expanding seaweed cultivation in Southeast Asia and rising use of agar as a gelatin substitute have supported overall market expansion.
Quick Stats Agar Market

  • Market Value (2025): USD 307.1 million
  • Forecast Value (2035): USD 500.2 million
  • Forecast CAGR: 5%
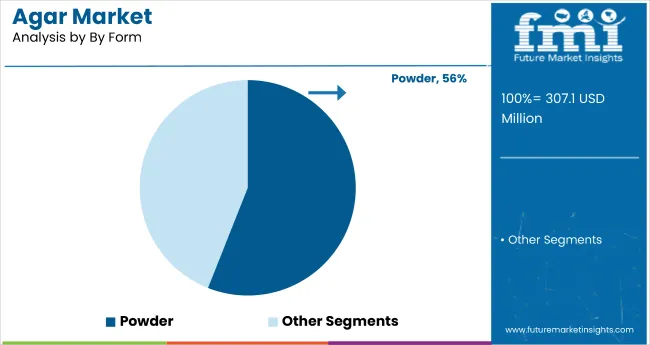
  • Form Leader in 2025: Agar Powder (56% Market Share)
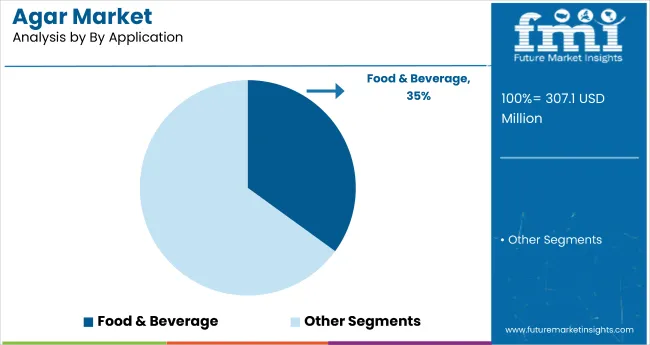
  • Top Application Segment: Food & Beverage (35% Market Share)
  • Key Growth Region: Western Europe (UK is the fastest-growing market with 5.2% CAGR)

Agar Market Market Value Analysis

Metric Value
Estimated Size (2025E) USD 307.1 million
Projected Value (2035F) USD 500.2 million
CAGR (2025 to 2035) 5%

The market accounts for 4%, attributed to its specialized gelling capabilities. Within the functional food ingredients sector, it comprises about 2.5%, spurred by its increasing use in plant-based and clean-label product formulations. In the microbiological culture media industry, agar commands nearly 8% of the market, reflecting its essential role in laboratory and diagnostic purposes. In plant-based ingredients and food additives markets, agar constitutes around 1.5% to 2%, highlighting its function as a natural additive and gelatin alternative in specialized product segments.

Government regulations impacting the market focus on favorable regulations promoting sustainable and plant-derived ingredients. Recent innovations include tissue engineering applications and novel agar formulations for culture media. Government-backed initiatives in countries like India and Indonesia to expand seaweed farming are also expected to increase raw material availability.

Continuous advancements in biotechnology and microbiology will further unlock value across the agar supply chain. Additionally, strategic collaborations between agar processors and end-use industries are likely to accelerate customized product development and market penetration.

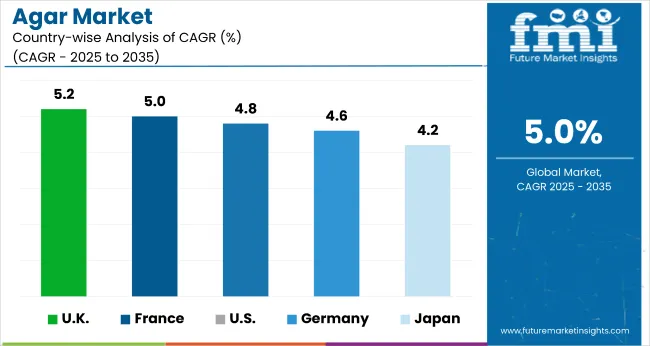
The UK is projected to be the fastest-growing market, expanding at a CAGR of 5.2% from 2025 to 2035. Powder will lead the form segment with a 56% share, while food & beverage will dominate the application segment with a 35% market share in 2025. France and the USA markets are also expected to grow at CAGRs of 5.0% and 4.8% respectively.

Agar Market Analysis by Top Investment Segments

The agar market is segmented by application, form, and region. By application, the market is categorized into food & beverages (bakery, confectionery, dairy, canned meat/poultry products, beverages, sauces/creams/dressings, dietetic products, others), bacteriological (culture media and microbiology), technical applications (cosmetology and medical), and others (agriculture and animal feed additives). Based on form, the market is bifurcated into splits and powders. Regionally, the market is classified into North America, Latin America, Europe, Asia Pacific, and Middle East & Africa.
Food & Beverage to Lead the Application Segment with 35% Market Share

Agar Market Analysis By By Application

Food & beverages are projected to lead the application segment, accounting for 35% of the global market share in 2025. Their expanding role as a gelling and stabilizing agent, particularly in plant-based and clean-label food formulations, establishes them as the dominant choice for manufacturers. The versatility of agar supports its widespread use in vegan confectionery, jellies, puddings, dairy alternatives, and sauces, making it the preferred additive for non-animal-based product lines.
  • Agar is widely used in processed and packaged foods due to its excellent gelling, stabilizing, and thickening properties.
  • As a plant-derived ingredient, it is a preferred choice for vegan and vegetarian food formulations, replacing animal-based gelatin.
  • The shift toward clean-label products is boosting demand for agar, as it is a natural and minimally processed additive.
  • Agar offers a cost-efficient alternative to gelatin, delivering similar functional benefits without relying on animal sources.

Powder to Lead the Form Segment with 56% Market Share

Agar Market Analysis By By Form

Powder is projected to dominate the form segment. is projected to account for 56% of the global market share in 2025. Its superior solubility, ease of handling, and consistent performance in gelling and stabilizing make it the preferred form across food, pharmaceutical, and cosmetic applications. Manufacturers value their ability to integrate easily into liquid formulations without altering product texture or color.

  • Agar allows manufacturers to fine-tune gel firmness, making it ideal for products requiring specific textures.
  • Its ability to dissolve uniformly and be accurately measured ensures consistency in food and pharmaceutical formulations.
  • Agar’s scalability and reliable performance make it well-suited for large-scale industrial production processes.
  • It is a preferred component in pre-mixed ingredient solutions, offering convenience and functional reliability for manufacturers.

Top Agar Market Dynamics

Recent Trends in the Agar Market

  • Rising adoption of agar in plant-based and vegan food formulations across global markets.
  • Increasing use of agar in microbiology and clinical diagnostics due to its high purity and consistency.
  • Expansion of seaweed farming in Southeast Asia to ensure a consistent raw material supply.
  • Growing innovation in technical applications such as tissue engineering and drug delivery systems.

Key Challenges in the Agar Market

  • Raw material volatility due to seasonal and geographic dependence on seaweed harvests.
  • Competition from alternative gelling agents like gelatin, carrageenan, and pectin.
  • High production and purification costs are impacting price competitiveness in low-margin segments.
  • Supply chain disruptions in coastal regions are affecting extraction and export logistics.

Top Countries Producing, Using and Supplying Agar

Agar Market Cagr Analysis By Country

The UK leads the agar market in growth projections, driven by a rising demand for plant-based ingredients, expanding vegan and clean-label trends, and increased industrial adoption across food, nutraceutical, and pharmaceutical sectors. Strong local processing capabilities and innovation in hydrocolloid formulations further support its market expansion. The USA and France follow closely, with growth rates of 5% and 4.8%, respectively, supported by growing applications in dairy alternatives, desserts, and microbiological culture media.

Germany is projected to grow at a CAGR of 4.6%, backed by demand in confectionery and processed foods. Japan, a mature market, is expected to witness a CAGR of 4.2%, owing to its long-standing use of agar in traditional cuisine and scientific research. Other countries such as China, Spain, and South Korea are also emerging as key suppliers, driven by expanding seaweed harvesting, improved extraction technologies, and growing export-oriented production capabilities.

The report covers an in-depth analysis of 40+ countries; with the five top-performing OECD nations highlighted below.
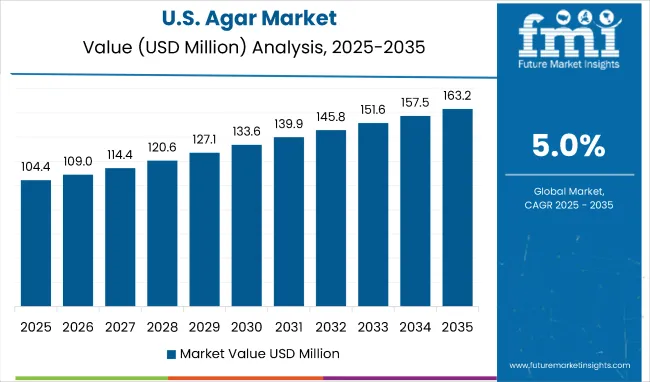
In-Depth Analysis of Agar in the USA

Agar Market Country Value Analysis

The USA agar revenue is growing at a CAGR of 4.8% from 2025 to 2035. Expansion is supported by the growing use of agar in food applications such as dairy alternatives, bakery, and confectionery. The country’s established pharmaceutical and microbiological industries also significantly contribute to demand, with agar used in tissue culture and laboratory diagnostics.

  • Growing preference for vegetarian food alternatives.
  • Strong demand from food safety and diagnostic labs.
  • Increasing usage of agar in clean-label bakery applications.

Growth Outlook of Agar in the UK

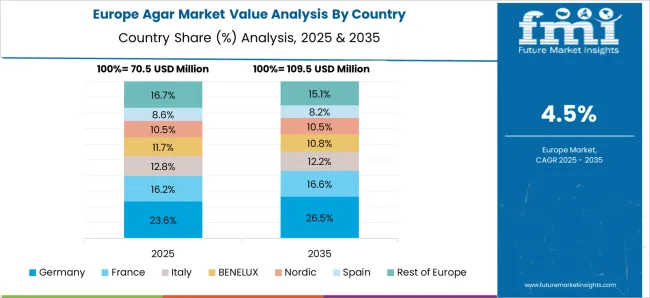
The sales of agar in the UK are expanding at a CAGR of 5.2% during the forecast period. Growth is driven by rising consistent demand for agar in the functional foods and dietary products categories. Veganism and sustainable food production practices are major influencers behind the rising agar adoption. British cosmetic and pharmaceutical manufacturers also prefer agar in technical applications for its natural and biodegradable properties.
  • Increased adoption of agar in organic and vegan formulations.
  • Supportive labeling policies for plant-based ingredients.
  • Strong consumer shift toward natural food thickeners.

Demand Trajectory for Agar in Germany

The demand for agar market in Germany is projected to grow at a CAGR of 4.6% from 2025 to 2035. Expansion is supported by increasing use of agar in German confectionery, dairy, and microbiological testing applications. As one of the leading markets in Europe, Germany benefits from a mature food processing industry and rigorous food safety standards. The country’s pharmaceutical and cosmetic industries also leverage agar in specialized formulations.

  • Wide application in confectionery and food diagnostics.
  • Strong industrial base in pharmaceuticals and cosmetics.
  • Stable imports from Southeast Asian agar processors.

Analysis of Agar in France

The French agar market is projected to grow at a CAGR of 5% from 2025 to 2035. Growth is driven by thriving bakery and patisserie sectors, where agar is extensively used as a vegan-friendly alternative. France has also embraced agar in dairy products, sauces, and organic snacks. Regulatory alignment with clean-label and natural additive trends has boosted agar’s appeal.

  • High usage of agar in artisanal and commercial bakery items.
  • Increasing adoption of natural stabilizers in gourmet food.
  • Expanding microbiological research applications in biotech firms.

Agar Trends in Japan

The Japan agar market is expected to grow at a CAGR of 4.2% from 2025 to 2035. Growth in the Japan agar market is supported by strong dietary familiarity, traditional use in food and pharmaceuticals, and continued applications in biotechnology and tissue engineering. The country has a long-standing tradition of agar use, locally known as "kanten," in food, cosmetics, and pharmaceuticals. Japan's advanced biotechnology sector continues to utilize agar in tissue engineering and as a microbial growth medium.
  • Historic and cultural familiarity with agar (kanten).
  • Domestic production of high-purity agar for premium use.
  • Increasing demand in the biotechnology and health food sectors.

Leading Agar Market Suppliers

Agar Market Analysis By Company

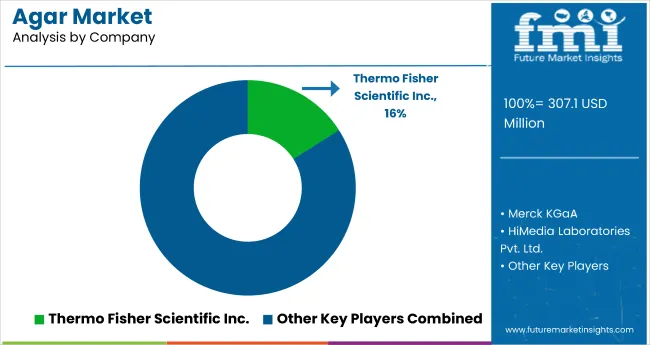
The agar market is moderately fragmented, with numerous regional and global players competing across food, pharmaceutical, cosmetic, and microbiological sectors. Key suppliers like Merck KGaA, Thermo Fisher Scientific Inc., Neogen Corporation, and HiMedia Laboratories are leveraging R&D, pricing strategies, and international distribution partnerships to strengthen their positions. These firms emphasize innovation in bacteriological-grade agar, medical-grade formulations, and sustainable sourcing practices.

Top companies are actively investing in expanding production capacity, forming strategic alliances, and launching application-specific agar products to cater to growing demand from biotech and clean-label food industries. For instance, Thermo Fisher is focusing on microbiology media enhancements, while Neogen and HiMedia are expanding their offerings across Asia and North America through localized production and exports. Sustainability, regulatory compliance, and application precision remain central to supplier differentiation in this sector.

Agar Market Report Scope

Report Attributes Details
Current Total Market Size (2025) USD 307.1 million
Projected Market Size (2035) USD 500.2 million
CAGR (2025 to 2035) 5%
Base Year for Estimation 2024
Historical Period 2020 to 2024
Projections Period 2025 to 2035
Market Analysis Parameters Revenue in USD millions / Volume in metric tons
By Application Food & Beverages, Bacteriological (Culture Media, Microbiology), Technical Applications (Cosmetology, Medical), and Others (Agriculture, Animal Feed)
By Form Splits and Powders
Regions Covered North America, Latin America, Europe, Asia Pacific, and MEA (Middle East & Africa
Countries Covered United States, Canada, United Kingdom, Germany, France, China, Japan, South Korea, Brazil, Australia and 40+ countries
Key Players Amcor, Winpak, Berry Global, Mondi, Uflex, Coveris, Cosmo Films
Additional Attributes Dollar sales by product type, share by functionality, regional demand growth, regulatory influence, clean-label trends, competitive benchmarking

Key Segments

By Application:

  • Food & Beverages
    • Bakery
    • Confectionery
    • Dairy
    • Canned Meat/Poultry Products
    • Beverages
    • Sauces, Creams, & Dressings
    • Others
  • Bacteriological
    • Culture Media
    • Microbiology
  • Technical Applications
    • Cosmetology
    • Medical Applications
  • Others

By Form:

  • Splits
  • Powders

By Region:

  • North America
  • Latin America
  • Western Europe
  • Eastern Europe
  • East Asia
  • South Asia & Pacific
  • Middle East and Africa

Table of Content

  1. Executive Summary
    • Global Market Outlook
    • Demand-side Trends
    • Supply-side Trends
    • Technology Roadmap Analysis
    • Analysis and Recommendations
  2. Market Overview
    • Market Coverage / Taxonomy
    • Market Definition / Scope / Limitations
  3. Market Background
    • Market Dynamics
      • Drivers
      • Restraints
      • Opportunity
      • Trends
    • Scenario Forecast
      • Demand in Optimistic Scenario
      • Demand in Likely Scenario
      • Demand in Conservative Scenario
    • Opportunity Map Analysis
    • Product Life Cycle Analysis
    • Supply Chain Analysis
      • Supply Side Participants and their Roles
        • Producers
        • Mid-Level Participants (Traders/ Agents/ Brokers)
        • Wholesalers and Distributors
      • Value Added and Value Created at Node in the Supply Chain
      • List of Raw Material Suppliers
      • List of Existing and Potential Buyer’s
    • Investment Feasibility Matrix
    • Value Chain Analysis
      • Profit Margin Analysis
      • Wholesalers and Distributors
      • Retailers
    • PESTLE and Porter’s Analysis
    • Regulatory Landscape
      • By Key Regions
      • By Key Countries
    • Regional Parent Market Outlook
    • Production and Consumption Statistics
    • Import and Export Statistics
  4. Global Market Analysis 2020 to 2024 and Forecast, 2025 to 2035
    • Historical Market Size Value (USD Million) & Volume (Metric Tons) Analysis, 2020 to 2024
    • Current and Future Market Size Value (USD Million) & Volume (Metric Tons) Projections, 2025 to 2035
      • Y-o-Y Growth Trend Analysis
      • Absolute $ Opportunity Analysis
  5. Global Market Pricing Analysis 2020 to 2024 and Forecast 2025 to 2035
  6. Global Market Analysis 2020 to 2024 and Forecast 2025 to 2035, By Application
    • Introduction / Key Findings
    • Historical Market Size Value (USD Million) & Volume (Metric Tons) Analysis By Application, 2020 to 2024
    • Current and Future Market Size Value (USD Million) & Volume (Metric Tons) Analysis and Forecast By Application, 2025 to 2035
      • Food & Beverages
        • Bakery
        • Confectionery
        • Dairy
        • Canned meat/poultry products
        • Beverages
        • Sauces, creams & dressings
        • Dietetic products
        • Others
      • Bacteriological
        • Culture media
        • Microbiology
      • Technical Applications
        • Cosmetology
        • Medical applications
      • Others
        • Agriculture
        • Animal Feed Additives
    • Y-o-Y Growth Trend Analysis By Application, 2020 to 2024
    • Absolute $ Opportunity Analysis By Application, 2025 to 2035
  7. Global Market Analysis 2020 to 2024 and Forecast 2025 to 2035, By Form
    • Introduction / Key Findings
    • Historical Market Size Value (USD Million) & Volume (Metric Tons) Analysis By Form, 2020 to 2024
    • Current and Future Market Size Value (USD Million) & Volume (Metric Tons) Analysis and Forecast By Form, 2025 to 2035
      • Splits
      • Powders
    • Y-o-Y Growth Trend Analysis By Form, 2020 to 2024
    • Absolute $ Opportunity Analysis By Form, 2025 to 2035
  8. Global Market Analysis 2020 to 2024 and Forecast 2025 to 2035, By Region
    • Introduction
    • Historical Market Size Value (USD Million) & Volume (Metric Tons) Analysis By Region, 2020 to 2024
    • Current Market Size Value (USD Million) & Volume (Metric Tons) Analysis and Forecast By Region, 2025 to 2035
      • North America
      • Latin America
      • Western Europe
      • Eastern Europe
      • East Asia
      • South Asia & Pacific
      • Middle East and Africa
    • Market Attractiveness Analysis By Region
  9. North America Market Analysis 2020 to 2024 and Forecast 2025 to 2035, By Country
    • Historical Market Size Value (USD Million) & Volume (Metric Tons) Trend Analysis By Market Taxonomy, 2020 to 2024
    • Market Size Value (USD Million) & Volume (Metric Tons) Forecast By Market Taxonomy, 2025 to 2035
      • By Country
        • USA
        • Canada
        • Mexico
      • By Application
      • By Form
    • Market Attractiveness Analysis
      • By Country
      • By Application
      • By Form
    • Key Takeaways
  10. Latin America Market Analysis 2020 to 2024 and Forecast 2025 to 2035, By Country
    • Historical Market Size Value (USD Million) & Volume (Metric Tons) Trend Analysis By Market Taxonomy, 2020 to 2024
    • Market Size Value (USD Million) & Volume (Metric Tons) Forecast By Market Taxonomy, 2025 to 2035
      • By Country
        • Brazil
        • Argentina
        • Rest of LATAM
      • By Application
      • By Form
    • Market Attractiveness Analysis
      • By Country
      • By Application
      • By Form
    • Key Takeaways
  11. Western Europe Market Analysis 2020 to 2024 and Forecast 2025 to 2035, By Country
    • Historical Market Size Value (USD Million) & Volume (Metric Tons) Trend Analysis By Market Taxonomy, 2020 to 2024
    • Market Size Value (USD Million) & Volume (Metric Tons) Forecast By Market Taxonomy, 2025 to 2035
      • By Country
        • Germany
        • Italy
        • France
        • UK
        • Spain
        • BENELUX
        • Nordic
        • Rest of W.Europe
      • By Application
      • By Form
    • Market Attractiveness Analysis
      • By Country
      • By Application
      • By Form
    • Key Takeaways
  12. Eastern Europe Market Analysis 2020 to 2024 and Forecast 2025 to 2035, By Country
    • Historical Market Size Value (USD Million) & Volume (Metric Tons) Trend Analysis By Market Taxonomy, 2020 to 2024
    • Market Size Value (USD Million) & Volume (Metric Tons) Forecast By Market Taxonomy, 2025 to 2035
      • By Country
        • Russia
        • Hungary
        • Poland
        • Balkan & Baltics
        • Rest of E. Europe
      • By Application
      • By Form
    • Market Attractiveness Analysis
      • By Country
      • By Application
      • By Form
    • Key Takeaways
  13. East Asia Market Analysis 2020 to 2024 and Forecast 2025 to 2035, By Country
    • Historical Market Size Value (USD Million) & Volume (Metric Tons) Trend Analysis By Market Taxonomy, 2020 to 2024
    • Market Size Value (USD Million) & Volume (Metric Tons) Forecast By Market Taxonomy, 2025 to 2035
      • By Country
        • China
        • Japan
        • South Korea
      • By Application
      • By Form
    • Market Attractiveness Analysis
      • By Country
      • By Application
      • By Form
    • Key Takeaways
  14. South Asia & Pacific Market Analysis 2020 to 2024 and Forecast 2025 to 2035, By Country
    • Historical Market Size Value (USD Million) & Volume (Metric Tons) Trend Analysis By Market Taxonomy, 2020 to 2024
    • Market Size Value (USD Million) & Volume (Metric Tons) Forecast By Market Taxonomy, 2025 to 2035
      • By Country
        • India
        • Australia & New Zealand
        • ASEAN
        • Rest of SAP
      • By Application
      • By Form
    • Market Attractiveness Analysis
      • By Country
      • By Application
      • By Form
    • Key Takeaways
  15. Middle East and Africa Market Analysis 2020 to 2024 and Forecast 2025 to 2035, By Country
    • Historical Market Size Value (USD Million) & Volume (Metric Tons) Trend Analysis By Market Taxonomy, 2020 to 2024
    • Market Size Value (USD Million) & Volume (Metric Tons) Forecast By Market Taxonomy, 2025 to 2035
      • By Country
        • GCC Countries
        • Northern Africa
        • South Africa
        • Turkiye
        • Rest of MEA
      • By Application
      • By Form
    • Market Attractiveness Analysis
      • By Country
      • By Application
      • By Form
    • Key Takeaways
  16. Key Countries Market Analysis
    • USA
      • Pricing Analysis
      • Market Share Analysis, 2024
        • By Application
        • By Form
    • Canada
      • Pricing Analysis
      • Market Share Analysis, 2024
        • By Application
        • By Form
    • Brazil
      • Pricing Analysis
      • Market Share Analysis, 2024
        • By Application
        • By Form
    • Mexico
      • Pricing Analysis
      • Market Share Analysis, 2024
        • By Application
        • By Form
    • Argentina
      • Pricing Analysis
      • Market Share Analysis, 2024
        • By Application
        • By Form
  17. Market Structure Analysis
    • Competition Dashboard
    • Competition Benchmarking
    • Market Share Analysis of Top Players
      • By Regional
      • By Application
      • By Form
  18. Competition Analysis
    • Competition Deep Dive
      • Merck KGaA
        • Overview
        • Product Portfolio
        • Profitability by Market Segments (Product/Age /Sales Channel/Region)
        • Sales Footprint
        • Strategy Overview
          • Marketing Strategy
          • Product Strategy
          • Channel Strategy
      • Thermo Fisher Scientific Inc.
        • Overview
        • Product Portfolio
        • Profitability by Market Segments (Product/Age /Sales Channel/Region)
        • Sales Footprint
        • Strategy Overview
          • Marketing Strategy
          • Product Strategy
          • Channel Strategy
      • HiMedia Laboratories Pvt. Ltd.
        • Overview
        • Product Portfolio
        • Profitability by Market Segments (Product/Age /Sales Channel/Region)
        • Sales Footprint
        • Strategy Overview
          • Marketing Strategy
          • Product Strategy
          • Channel Strategy
      • Neogen Corporation
        • Overview
        • Product Portfolio
        • Profitability by Market Segments (Product/Age /Sales Channel/Region)
        • Sales Footprint
        • Strategy Overview
          • Marketing Strategy
          • Product Strategy
          • Channel Strategy
      • Bio-Rad Laboratories, Inc.
        • Overview
        • Product Portfolio
        • Profitability by Market Segments (Product/Age /Sales Channel/Region)
        • Sales Footprint
        • Strategy Overview
          • Marketing Strategy
          • Product Strategy
          • Channel Strategy
      • Becton, Dickinson and Company
        • Overview
        • Product Portfolio
        • Profitability by Market Segments (Product/Age /Sales Channel/Region)
        • Sales Footprint
        • Strategy Overview
          • Marketing Strategy
          • Product Strategy
          • Channel Strategy
      • Crystalgen Inc.
        • Overview
        • Product Portfolio
        • Profitability by Market Segments (Product/Age /Sales Channel/Region)
        • Sales Footprint
        • Strategy Overview
          • Marketing Strategy
          • Product Strategy
          • Channel Strategy
      • Titan Biotech Limited
        • Overview
        • Product Portfolio
        • Profitability by Market Segments (Product/Age /Sales Channel/Region)
        • Sales Footprint
        • Strategy Overview
          • Marketing Strategy
          • Product Strategy
          • Channel Strategy
      • Micromaster Laboratories
        • Overview
        • Product Portfolio
        • Profitability by Market Segments (Product/Age /Sales Channel/Region)
        • Sales Footprint
        • Strategy Overview
          • Marketing Strategy
          • Product Strategy
          • Channel Strategy
      • TCI Chemicals
        • Overview
        • Product Portfolio
        • Profitability by Market Segments (Product/Age /Sales Channel/Region)
        • Sales Footprint
        • Strategy Overview
          • Marketing Strategy
          • Product Strategy
          • Channel Strategy
  19. Assumptions & Acronyms Used
  20. Research Methodology

List of Tables

  • Table 1: Global Market Value (USD Million) Forecast by Region, 2020-2035
  • Table 2: Global Market Volume (Metric Tons) Forecast by Region, 2020-2035
  • Table 3: Global Market Value (USD Million) Forecast by Application, 2020-2035
  • Table 4: Global Market Volume (Metric Tons) Forecast by Application, 2020-2035
  • Table 5: Global Market Value (USD Million) Forecast by Form, 2020-2035
  • Table 6: Global Market Volume (Metric Tons) Forecast by Form, 2020-2035
  • Table 7: North America Market Value (USD Million) Forecast by Country, 2020-2035
  • Table 8: North America Market Volume (Metric Tons) Forecast by Country, 2020-2035
  • Table 9: North America Market Value (USD Million) Forecast by Application, 2020-2035
  • Table 10: North America Market Volume (Metric Tons) Forecast by Application, 2020-2035
  • Table 11: North America Market Value (USD Million) Forecast by Form, 2020-2035
  • Table 12: North America Market Volume (Metric Tons) Forecast by Form, 2020-2035
  • Table 13: Latin America Market Value (USD Million) Forecast by Country, 2020-2035
  • Table 14: Latin America Market Volume (Metric Tons) Forecast by Country, 2020-2035
  • Table 15: Latin America Market Value (USD Million) Forecast by Application, 2020-2035
  • Table 16: Latin America Market Volume (Metric Tons) Forecast by Application, 2020-2035
  • Table 17: Latin America Market Value (USD Million) Forecast by Form, 2020-2035
  • Table 18: Latin America Market Volume (Metric Tons) Forecast by Form, 2020-2035
  • Table 19: Western Europe Market Value (USD Million) Forecast by Country, 2020-2035
  • Table 20: Western Europe Market Volume (Metric Tons) Forecast by Country, 2020-2035
  • Table 21: Western Europe Market Value (USD Million) Forecast by Application, 2020-2035
  • Table 22: Western Europe Market Volume (Metric Tons) Forecast by Application, 2020-2035
  • Table 23: Western Europe Market Value (USD Million) Forecast by Form, 2020-2035
  • Table 24: Western Europe Market Volume (Metric Tons) Forecast by Form, 2020-2035
  • Table 25: Eastern Europe Market Value (USD Million) Forecast by Country, 2020-2035
  • Table 26: Eastern Europe Market Volume (Metric Tons) Forecast by Country, 2020-2035
  • Table 27: Eastern Europe Market Value (USD Million) Forecast by Application, 2020-2035
  • Table 28: Eastern Europe Market Volume (Metric Tons) Forecast by Application, 2020-2035
  • Table 29: Eastern Europe Market Value (USD Million) Forecast by Form, 2020-2035
  • Table 30: Eastern Europe Market Volume (Metric Tons) Forecast by Form, 2020-2035
  • Table 31: East Asia Market Value (USD Million) Forecast by Country, 2020-2035
  • Table 32: East Asia Market Volume (Metric Tons) Forecast by Country, 2020-2035
  • Table 33: East Asia Market Value (USD Million) Forecast by Application, 2020-2035
  • Table 34: East Asia Market Volume (Metric Tons) Forecast by Application, 2020-2035
  • Table 35: East Asia Market Value (USD Million) Forecast by Form, 2020-2035
  • Table 36: East Asia Market Volume (Metric Tons) Forecast by Form, 2020-2035
  • Table 37: South Asia & Pacific Market Value (USD Million) Forecast by Country, 2020-2035
  • Table 38: South Asia & Pacific Market Volume (Metric Tons) Forecast by Country, 2020-2035
  • Table 39: South Asia & Pacific Market Value (USD Million) Forecast by Application, 2020-2035
  • Table 40: South Asia & Pacific Market Volume (Metric Tons) Forecast by Application, 2020-2035
  • Table 41: South Asia & Pacific Market Value (USD Million) Forecast by Form, 2020-2035
  • Table 42: South Asia & Pacific Market Volume (Metric Tons) Forecast by Form, 2020-2035
  • Table 43: Middle East and Africa Market Value (USD Million) Forecast by Country, 2020-2035
  • Table 44: Middle East and Africa Market Volume (Metric Tons) Forecast by Country, 2020-2035
  • Table 45: Middle East and Africa Market Value (USD Million) Forecast by Application, 2020-2035
  • Table 46: Middle East and Africa Market Volume (Metric Tons) Forecast by Application, 2020-2035
  • Table 47: Middle East and Africa Market Value (USD Million) Forecast by Form, 2020-2035
  • Table 48: Middle East and Africa Market Volume (Metric Tons) Forecast by Form, 2020-2035

List of Figures

  • Figure 1: Global Market Volume (Metric Tons) Forecast 2020-2035
  • Figure 2: Global Market Pricing Analysis
  • Figure 3: Global Market Value (USD Million) Forecast 2020-2035
  • Figure 4: Global Market Value Share and BPS Analysis by Application, 2025 and 2035
  • Figure 5: Global Market Y-o-Y Growth Comparison by Application, 2025-2035
  • Figure 6: Global Market Attractiveness Analysis by Application
  • Figure 7: Global Market Value Share and BPS Analysis by Form, 2025 and 2035
  • Figure 8: Global Market Y-o-Y Growth Comparison by Form, 2025-2035
  • Figure 9: Global Market Attractiveness Analysis by Form
  • Figure 10: Global Market Value (USD Million) Share and BPS Analysis by Region, 2025 and 2035
  • Figure 11: Global Market Y-o-Y Growth Comparison by Region, 2025-2035
  • Figure 12: Global Market Attractiveness Analysis by Region
  • Figure 13: North America Market Incremental $ Opportunity, 2025-2035
  • Figure 14: Latin America Market Incremental $ Opportunity, 2025-2035
  • Figure 15: Western Europe Market Incremental $ Opportunity, 2025-2035
  • Figure 16: Eastern Europe Market Incremental $ Opportunity, 2025-2035
  • Figure 17: East Asia Market Incremental $ Opportunity, 2025-2035
  • Figure 18: South Asia & Pacific Market Incremental $ Opportunity, 2025-2035
  • Figure 19: Middle East and Africa Market Incremental $ Opportunity, 2025-2035
  • Figure 20: North America Market Value Share and BPS Analysis by Country, 2025 and 2035
  • Figure 21: North America Market Value Share and BPS Analysis by Application, 2025 and 2035
  • Figure 22: North America Market Y-o-Y Growth Comparison by Application, 2025-2035
  • Figure 23: North America Market Attractiveness Analysis by Application
  • Figure 24: North America Market Value Share and BPS Analysis by Form, 2025 and 2035
  • Figure 25: North America Market Y-o-Y Growth Comparison by Form, 2025-2035
  • Figure 26: North America Market Attractiveness Analysis by Form
  • Figure 27: Latin America Market Value Share and BPS Analysis by Country, 2025 and 2035
  • Figure 28: Latin America Market Value Share and BPS Analysis by Application, 2025 and 2035
  • Figure 29: Latin America Market Y-o-Y Growth Comparison by Application, 2025-2035
  • Figure 30: Latin America Market Attractiveness Analysis by Application
  • Figure 31: Latin America Market Value Share and BPS Analysis by Form, 2025 and 2035
  • Figure 32: Latin America Market Y-o-Y Growth Comparison by Form, 2025-2035
  • Figure 33: Latin America Market Attractiveness Analysis by Form
  • Figure 34: Western Europe Market Value Share and BPS Analysis by Country, 2025 and 2035
  • Figure 35: Western Europe Market Value Share and BPS Analysis by Application, 2025 and 2035
  • Figure 36: Western Europe Market Y-o-Y Growth Comparison by Application, 2025-2035
  • Figure 37: Western Europe Market Attractiveness Analysis by Application
  • Figure 38: Western Europe Market Value Share and BPS Analysis by Form, 2025 and 2035
  • Figure 39: Western Europe Market Y-o-Y Growth Comparison by Form, 2025-2035
  • Figure 40: Western Europe Market Attractiveness Analysis by Form
  • Figure 41: Eastern Europe Market Value Share and BPS Analysis by Country, 2025 and 2035
  • Figure 42: Eastern Europe Market Value Share and BPS Analysis by Application, 2025 and 2035
  • Figure 43: Eastern Europe Market Y-o-Y Growth Comparison by Application, 2025-2035
  • Figure 44: Eastern Europe Market Attractiveness Analysis by Application
  • Figure 45: Eastern Europe Market Value Share and BPS Analysis by Form, 2025 and 2035
  • Figure 46: Eastern Europe Market Y-o-Y Growth Comparison by Form, 2025-2035
  • Figure 47: Eastern Europe Market Attractiveness Analysis by Form
  • Figure 48: East Asia Market Value Share and BPS Analysis by Country, 2025 and 2035
  • Figure 49: East Asia Market Value Share and BPS Analysis by Application, 2025 and 2035
  • Figure 50: East Asia Market Y-o-Y Growth Comparison by Application, 2025-2035
  • Figure 51: East Asia Market Attractiveness Analysis by Application
  • Figure 52: East Asia Market Value Share and BPS Analysis by Form, 2025 and 2035
  • Figure 53: East Asia Market Y-o-Y Growth Comparison by Form, 2025-2035
  • Figure 54: East Asia Market Attractiveness Analysis by Form
  • Figure 55: South Asia & Pacific Market Value Share and BPS Analysis by Country, 2025 and 2035
  • Figure 56: South Asia & Pacific Market Value Share and BPS Analysis by Application, 2025 and 2035
  • Figure 57: South Asia & Pacific Market Y-o-Y Growth Comparison by Application, 2025-2035
  • Figure 58: South Asia & Pacific Market Attractiveness Analysis by Application
  • Figure 59: South Asia & Pacific Market Value Share and BPS Analysis by Form, 2025 and 2035
  • Figure 60: South Asia & Pacific Market Y-o-Y Growth Comparison by Form, 2025-2035
  • Figure 61: South Asia & Pacific Market Attractiveness Analysis by Form
  • Figure 62: Middle East and Africa Market Value Share and BPS Analysis by Country, 2025 and 2035
  • Figure 63: Middle East and Africa Market Value Share and BPS Analysis by Application, 2025 and 2035
  • Figure 64: Middle East and Africa Market Y-o-Y Growth Comparison by Application, 2025-2035
  • Figure 65: Middle East and Africa Market Attractiveness Analysis by Application
  • Figure 66: Middle East and Africa Market Value Share and BPS Analysis by Form, 2025 and 2035
  • Figure 67: Middle East and Africa Market Y-o-Y Growth Comparison by Form, 2025-2035
  • Figure 68: Middle East and Africa Market Attractiveness Analysis by Form
  • Figure 69: Global Market - Tier Structure Analysis
  • Figure 70: Global Market - Company Share Analysis

Frequently Asked Questions

What is the projected size of the agar market in 2025?

The market size is valued at USD 307.1 million in 2025.

What is the outlook on agar demand by 2035?

The market is forecasted to reach USD 500.2 million by 2035, reflecting a CAGR of 5.0%.

Which segment leads the agar market by form in 2025?

Powder will lead the form segment, accounting for 56% of the global market share in 2025.

What is the top application segment for the agar market by 2025?

Food & beverages will dominate the application segment with a 35% share in 2025.

Which country is projected to have the fastest-growing agar market?

The UK is projected to grow at the fastest rate, with a CAGR of 5.2% from 2025 to 2035.

Explore Similar Insights

Future Market Insights

Agar Market