The Anti-Malware Market is estimated to be valued at USD 13.2 billion in 2025 and is projected to reach USD 38.3 billion by 2035, registering a compound annual growth rate (CAGR) of 11.2% over the forecast period.
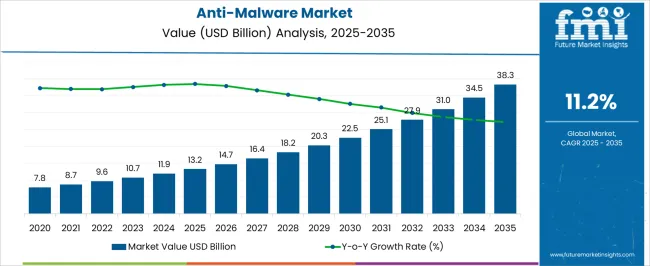
| Metric | Value |
|---|---|
| Anti-Malware Market Estimated Value in (2025 E) | USD 13.2 billion |
| Anti-Malware Market Forecast Value in (2035 F) | USD 38.3 billion |
| Forecast CAGR (2025 to 2035) | 11.2% |
The Anti-Malware market is experiencing significant growth, driven by the increasing prevalence of cyber threats and the rising need for robust cybersecurity solutions across enterprises and organizations. The proliferation of sophisticated malware attacks, ransomware, and phishing campaigns has heightened awareness of the importance of proactive threat detection and mitigation. Organizations are increasingly adopting anti-malware solutions that provide real-time threat monitoring, automated remediation, and integration with broader security infrastructure.
Advancements in AI and machine learning have enhanced malware detection capabilities, enabling identification of previously unknown threats and zero-day attacks. Cloud-based deployments and cross-platform support are further expanding the reach of anti-malware solutions, particularly among organizations with distributed IT infrastructure.
Regulatory requirements, including data privacy and industry-specific cybersecurity standards, are accelerating adoption, as compliance and risk management become critical priorities With growing digital transformation initiatives, the market is poised for sustained expansion, supported by continuous technological innovation, increasing cybersecurity budgets, and the ongoing need to protect sensitive data against evolving cyber threats.
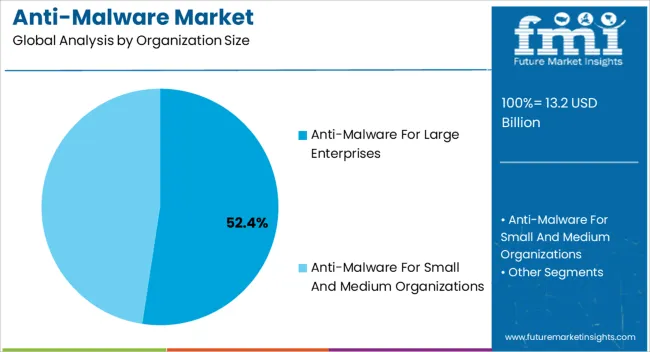
The anti-malware for large enterprises segment is projected to hold 52.4% of the market revenue in 2025, establishing it as the leading organization size category. Growth in this segment is being driven by the increasing complexity of enterprise IT environments and the need to safeguard critical infrastructure against sophisticated cyber threats. Large enterprises face higher risks due to the scale of operations, extensive data assets, and interconnected networks, making comprehensive anti-malware solutions essential.
Advanced endpoint protection, network monitoring, and threat intelligence integration are key factors enhancing adoption. Large enterprises also prioritize solutions that offer centralized management, scalability, and regulatory compliance support. The ability to deploy AI-driven detection and automated response mechanisms reduces operational risks and ensures business continuity.
Rising investments in cybersecurity programs, coupled with increasing regulatory mandates and heightened awareness of potential financial and reputational losses, are further reinforcing the market leadership of this segment The continued focus on enterprise-level security strategy positions the anti-malware for large enterprises segment as a key driver of overall market growth.
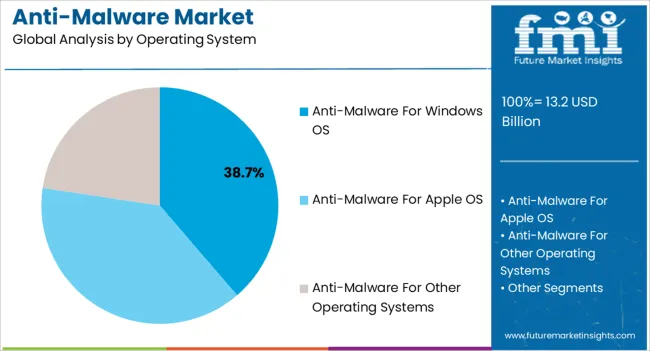
The anti-malware for Windows OS segment is expected to account for 38.7% of the market revenue in 2025, making it the leading operating system category. Growth in this segment is being driven by the widespread use of Windows-based devices across enterprises, small and medium businesses, and personal computing environments. Windows systems are often targeted by malware due to their large user base and known vulnerabilities, increasing demand for effective protection.
Anti-malware solutions for Windows provide real-time scanning, automated updates, and integration with security information and event management systems, ensuring robust defense mechanisms. Continuous improvement in detection algorithms, AI-powered threat intelligence, and rapid response to emerging threats enhances reliability and adoption.
The ability to deploy solutions across multiple devices and maintain centralized management is particularly attractive to IT administrators Rising cybercrime rates, regulatory compliance requirements, and increasing dependence on Windows infrastructure in business operations continue to drive the adoption of Windows-focused anti-malware solutions, reinforcing this segment’s leadership position in the market.
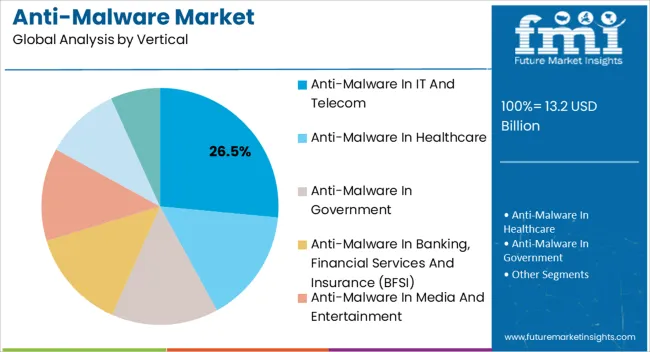
The anti-malware in IT and telecom segment is projected to hold 26.5% of the market revenue in 2025, establishing it as the leading vertical. Growth is being driven by the critical need to protect highly connected networks, sensitive data, and communication infrastructures from advanced cyber threats. IT and telecom companies handle vast amounts of confidential customer and enterprise data, making robust anti-malware solutions essential for operational security and regulatory compliance.
Solutions deployed in this vertical include endpoint protection, network threat monitoring, real-time threat intelligence, and automated remediation capabilities. Increasing adoption of cloud services, virtualization, and Internet of Things devices has elevated the risk profile, necessitating advanced anti-malware deployment.
Investment in AI-driven threat detection, centralized management, and automated incident response has further strengthened adoption Rising cyber attacks targeting telecom infrastructure, the need for uninterrupted service delivery, and stringent data protection regulations are reinforcing the market leadership of the IT and telecom vertical, making it a significant contributor to overall anti-malware market growth.
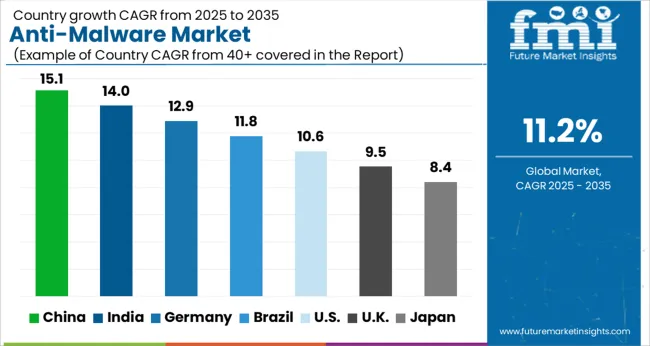
The global demand for anti-malware is projected to increase at a CAGR of 11.8% during the forecast period between 2025 and 2035, reaching a total of USD 32,429.6 million in 2035, according to a report from Future Market Insights (FMI). From 2020 to 2025, sales witnessed significant growth, registering a CAGR of 9.7%.
Anti-malware software protects devices from malicious spyware that accesses data without the users' awareness. Malware assaults are among the most serious threats to cyber security. These attackers identify and exploit vulnerabilities, then utilize those flaws to gain deeper access to a network.
North America is regarded as a highly profitable market for the anti-malware industry, owing to its widespread application in many industries and the country's rapid technological growth.
The rising internet user population drives the need for anti-malware software. Malicious software is most typically spread via email and the World Wide Web, and 24x7 internet availability has greatly raised the hazards of malware infection. As a result, many firms are investing in anti-malware solutions and services to protect data and other valuable information.
Increasing Number of Cyber-attacks to Boost Market Growth
The growing number of cyber-attacks is likely to boost the global anti-malware industry significantly. The need for extra layers of protection, such as data encryption, is projected to grow as technology evolves and the number of internet users grows. During the projected period, this is likely to boost the market.
Because of the widespread use of smartphones and computers in business, there has been an increase in investment in anti-malware solutions and services that protect data and other secret information. Spending on anti-malware is expected to increase steadily during the projection period.
Low-cost options are available and are likely to Stifle Market Growth
Despite the fact that the anti-malware industry includes various end-uses, there are numerous barriers to market expansion. Furthermore, the availability of low-cost alternatives may impede the growth of the anti-malware industry during the forecast period. The most difficult obstacle for the anti-malware industry is constantly changing technologies and platforms, which may impede market growth.
The high implementation cost of various anti-malware products is expected to stymie market expansion throughout the projection period. Another factor that is expected to have a negative impact on the expansion of the anti-malware industry during the forecast period is a lack of understanding of the operational efficacy and other benefits of technologically sophisticated systems.
Growing Digitalization to Favour Market Growth
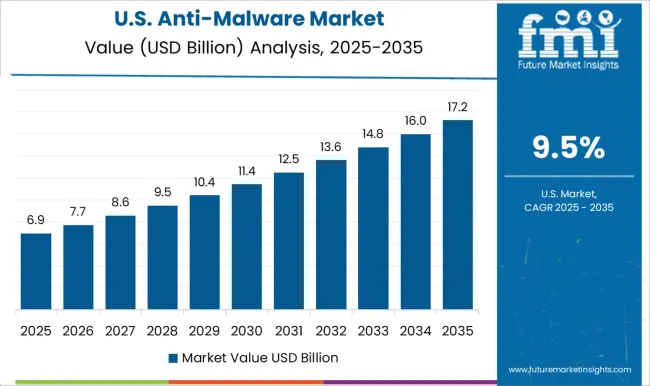
North America was the largest market for anti-malware, and this trend is likely to continue throughout the projection period due to the region's increasing digitization. The anti-malware industry is predicted to develop in response to the rising demand for anti-malware software. The area is expected to hold 31.6% of the entire anti-malware industry.
During the projection period, North America is predicted to be the next dominating area with strong anti-malware industry adoption rates. With rapid technological progress and a rising number of enterprises in North America, the region's need for anti-malware software is expected to grow. Furthermore, rising sales of mobile phones, tablets, and laptops in the area contribute to the market's expansion.
Europe's Expanding Commercial Sector Anti-Malware System Fuelling Rapid Adoption
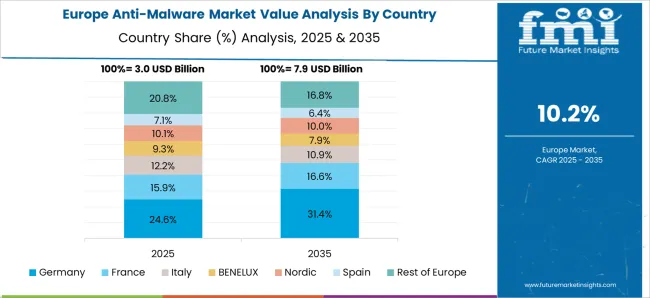
According to Future Market Insights, Europe is predicted to give enormous potential prospects for the anti-malware industry due to the region's expanding commercial sector. Over the projected period, the market is predicted to rise steadily.
The anti-malware industry is expanding due to an increase in cybercrime in the region. Europe accounts for 22.2% of the global market. The number of organizations and enterprises in the country is expanding as technology investments increase. The existence of important anti-malware industry manufacturers and suppliers boosts the European anti-malware market as well.
Demand for Other Operating Systems Segment to Remain High
Malware attacks have targeted Google Play customers nearly since the store's debut. Droid09, the first banking Trojan, to the most recent ad-click fraud/Bitcoin-mining hidden applications, afflict the store week after week.
For example, CheckPoint, an Israeli software security firm, said that in July 2020, rogue applications from a campaign named Agent Smith were downloaded to 25 million Android devices, and Google deleted 16 contaminated apps from the Play Store.
Android is the most popular mobile operating system; the virus is specifically designed to distribute and share the infection to as many devices as possible throughout the world. According to StatCounter, the global market share of Android OS was 76.08% in May 2020.
Backdoor malware is also popular on Android; this is another method of duping customers. TimpDoor, an Android-based malware family that first surfaced in March 2020 and witnessed accelerated growth in September, became the leading mobile backdoor family by more than two times, according to Mcafee research. Because of the prevalence of such malware concerns, the market for anti-malware software is likely to rise.
During late 2020 and early 2020, Android Grabos was one of the major malware operations. It was known as the pay-per-download scam because it pushed unwanted software on naïve customers. According to sources, 144 applications were found and removed. Furthermore, before the campaign's applications were removed, an estimated 17.5 million global smartphone devices downloaded them.
Key startup players in the Anti-Malware market are
This tool has a firewall, the finest antivirus module, social media protection, the best password manager, and many other features. Furthermore, this application has an extremely robust parental control tool.
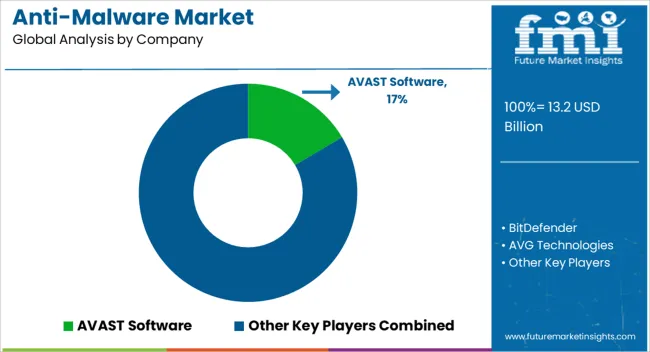
Due to a large number of competitors, the market is extremely competitive. While global giants like AVAST Software, BitDefender, and AVG Technologies command a sizable market share, various regional firms are also active in important growing regions, notably Asia Pacific.
Key players in the Anti-Malware market include AVAST Software, BitDefender, AVG Technologies, Symantec, McAfee, Malwarebytes, Sophos, Lookout, Kaspersky Lab, and Intel Security Gro, up amongst others.
Recent Developments in the Anti-Malware Market
| Report Attributes | Details |
|---|---|
| Growth Rate | CAGR of 11.8% from 2025 to 2035 |
| Market Value in 2025 | USD 13.2 billion |
| Market Value in 2035 | USD 38.3 billion |
| Base Year for Estimation | 2025 |
| Historical Data | 2020 to 2025 |
| Forecast Period | 2025 to 2035 |
| Quantitative Units | Revenue in USD million and CAGR from 2025 to 2035 |
| Report Coverage | Revenue Forecast, Volume Forecast, Company Ranking, Competitive Landscape, Growth Factors, Trends, and Pricing Analysis |
| Segments Covered |
Organization Size, Operating System, Vertical, Region |
| Regions Covered | North America; Latin America; Europe; Asia Pacific; Middle East and Africa |
| Key Countries Profiled | United States, Canada, Brazil, Mexico, Germany, United Kingdom, France, Spain, Italy, China, Japan, South Korea, GCC Countries, South Africa, Israel |
| Key Companies Profiled | AVAST Software; BitDefender; AVG Technologies; Symantec; McAfee; Malwarebytes; Sophos; Lookout; Kaspersky Lab; Intel Security Group |
| Customization | Available Upon Request |
The global anti-malware market is estimated to be valued at USD 13.2 billion in 2025.
The market size for the anti-malware market is projected to reach USD 38.3 billion by 2035.
The anti-malware market is expected to grow at a 11.2% CAGR between 2025 and 2035.
The key product types in anti-malware market are anti-malware for large enterprises and anti-malware for small and medium organizations.
In terms of operating system, anti-malware for windows os segment to command 38.7% share in the anti-malware market in 2025.


Our Research Products

The "Full Research Suite" delivers actionable market intel, deep dives on markets or technologies, so clients act faster, cut risk, and unlock growth.

The Leaderboard benchmarks and ranks top vendors, classifying them as Established Leaders, Leading Challengers, or Disruptors & Challengers.

Locates where complements amplify value and substitutes erode it, forecasting net impact by horizon

We deliver granular, decision-grade intel: market sizing, 5-year forecasts, pricing, adoption, usage, revenue, and operational KPIs—plus competitor tracking, regulation, and value chains—across 60 countries broadly.

Spot the shifts before they hit your P&L. We track inflection points, adoption curves, pricing moves, and ecosystem plays to show where demand is heading, why it is changing, and what to do next across high-growth markets and disruptive tech

Real-time reads of user behavior. We track shifting priorities, perceptions of today’s and next-gen services, and provider experience, then pace how fast tech moves from trial to adoption, blending buyer, consumer, and channel inputs with social signals (#WhySwitch, #UX).

Partner with our analyst team to build a custom report designed around your business priorities. From analysing market trends to assessing competitors or crafting bespoke datasets, we tailor insights to your needs.
Supplier Intelligence
Discovery & Profiling
Capacity & Footprint
Performance & Risk
Compliance & Governance
Commercial Readiness
Who Supplies Whom
Scorecards & Shortlists
Playbooks & Docs
Category Intelligence
Definition & Scope
Demand & Use Cases
Cost Drivers
Market Structure
Supply Chain Map
Trade & Policy
Operating Norms
Deliverables
Buyer Intelligence
Account Basics
Spend & Scope
Procurement Model
Vendor Requirements
Terms & Policies
Entry Strategy
Pain Points & Triggers
Outputs
Pricing Analysis
Benchmarks
Trends
Should-Cost
Indexation
Landed Cost
Commercial Terms
Deliverables
Brand Analysis
Positioning & Value Prop
Share & Presence
Customer Evidence
Go-to-Market
Digital & Reputation
Compliance & Trust
KPIs & Gaps
Outputs
Full Research Suite comprises of:
Market outlook & trends analysis
Interviews & case studies
Strategic recommendations
Vendor profiles & capabilities analysis
5-year forecasts
8 regions and 60+ country-level data splits
Market segment data splits
12 months of continuous data updates
DELIVERED AS:
PDF EXCEL ONLINE

Thank you!
You will receive an email from our Business Development Manager. Please be sure to check your SPAM/JUNK folder too.
Chat With
MaRIA