Antipruritic Market Size and Share Forecast Outlook 2025 to 2035

The Antipruritic Market is estimated to be valued at USD 11.4 billion in 2025 and is projected to reach USD 16.9 billion by 2035, registering a compound annual growth rate (CAGR) of 4.0% over the forecast period.
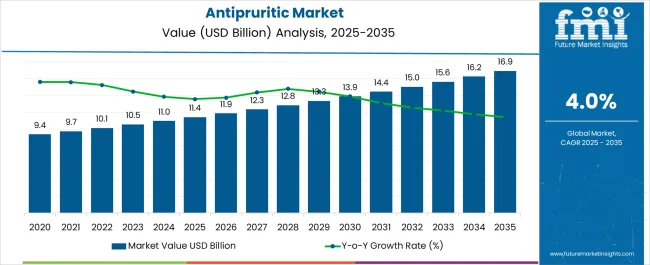
Quick Stats for Antipruritic Market

  • Antipruritic Market Industry Value (2025): USD 11.4 billion
  • Antipruritic Market Forecast Value (2035): USD 16.9 billion
  • Antipruritic Market Forecast CAGR: 4.0%
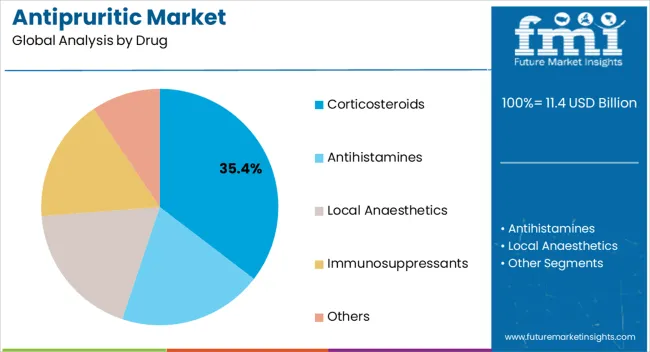
  • Leading Segment in Antipruritic Market in 2025: Corticosteroids (35.4%)
  • Key Growth Region in Antipruritic Market: North America, Asia-Pacific, Europe
  • Top Key Players in Antipruritic Market: AbbVie Inc., Allergan, Merck & Co., Inc., Amgen Inc., Pfizer Inc., Cara Therapeutics, Enteris BioPharma, NeRRe Therapeutics, Menlo Therapeutics, XBiotech Inc., Ipsen Pharma, Eledon Pharmaceuticals, Inc., Amorepacific, RDD Pharma, Ltd, Novartis AG, AstraZeneca, Sanofi, Sun Pharmaceutical Industries Ltd., Teva Pharmaceutical Industries Ltd., Takeda Pharmaceutical Company Limited, Cipla Ltd.

Antipruritic Market Market Value Analysis

Metric Value
Antipruritic Market Estimated Value in (2025 E) USD 11.4 billion
Antipruritic Market Forecast Value in (2035 F) USD 16.9 billion
Forecast CAGR (2025 to 2035) 4.0%

Rationale for Segmental Growth in the Antipruritic Market

The antipruritic market is advancing steadily, driven by the rising prevalence of dermatological conditions, increasing patient awareness, and the availability of diverse treatment options. Current market dynamics are being shaped by demand for effective therapies that provide rapid relief from itching and inflammation, as well as regulatory approval for novel formulations with improved safety profiles.

The market is also benefiting from ongoing research in immunology and dermatology, which has expanded understanding of pruritus pathophysiology and supported the development of targeted drugs. Pricing pressures and side-effect concerns are being addressed by manufacturers through innovation in drug delivery systems and investment in topical and systemic therapies with fewer adverse effects.

The future outlook is marked by continued adoption of advanced therapies, wider access to treatment in emerging economies, and the expansion of over-the-counter options, all of which are expected to enhance availability and affordability Growth rationale is underpinned by strong clinical demand, technological advancements in formulation, and healthcare infrastructure expansion, ensuring the market maintains its upward trajectory.
Segmental Analysis

Insights into the Drug Segment

Antipruritic Market Analysis By Drug

The corticosteroids segment, accounting for 35.40% of the drug category, has been leading due to its established effectiveness in reducing inflammation and providing rapid relief from itching. Its widespread adoption has been reinforced by strong clinician preference, particularly in managing both acute and chronic dermatological conditions.

Regulatory approval for multiple formulations, including creams, ointments, and sprays, has expanded accessibility across different patient groups. The segment’s growth has been supported by manufacturing consistency, affordability, and integration into treatment guidelines worldwide.

Recent innovations in low-potency and combination corticosteroids have further improved safety and tolerability, reducing long-term side effects while maintaining efficacy These developments are ensuring that corticosteroids continue to dominate the antipruritic market.
Insights into the Disease Segment

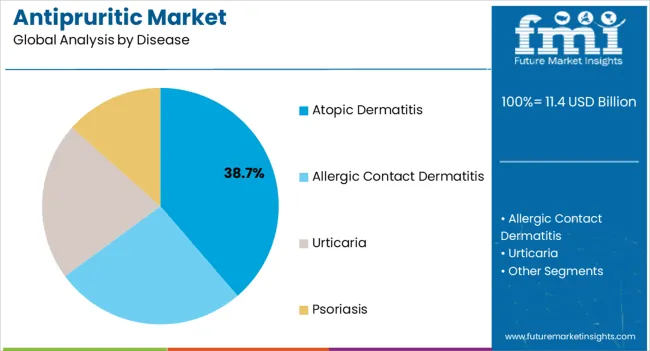
Antipruritic Market Analysis By Disease

The atopic dermatitis segment, representing 38.70% of the disease category, has retained its leadership due to the high incidence of the condition across both pediatric and adult populations. Its prominence is supported by the chronic and recurrent nature of the disease, which requires sustained therapeutic intervention.

Increased awareness, early diagnosis, and expanded availability of advanced therapies have further strengthened this segment. Integration of antipruritic drugs into standard care protocols has ensured consistent demand, while ongoing research into disease mechanisms has led to improved targeted therapies.

Rising healthcare expenditure and the expansion of dermatology clinics have also contributed to segment stability Over the forecast horizon, strong pipeline developments and the introduction of biologics are expected to sustain the segment’s market share.
Insights into the Route of Administration Segment

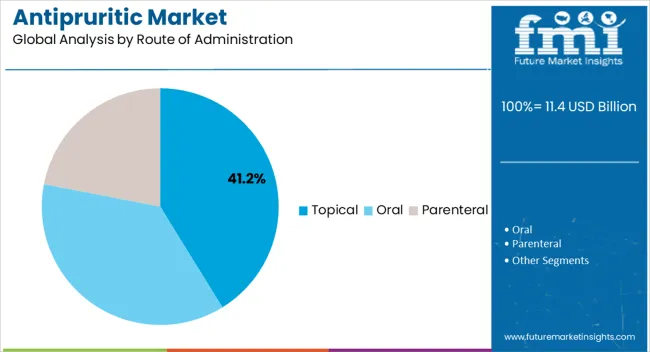
Antipruritic Market Analysis By Route Of Administration

The topical route, holding 41.20% of the administration category, has emerged as the leading mode due to its ease of use, rapid onset of action, and minimal systemic absorption. Adoption has been strengthened by patient preference for non-invasive application and clinician confidence in its effectiveness for localized pruritus management.

Widespread availability of creams, gels, and ointments has ensured accessibility across retail and hospital pharmacies. The segment has also benefited from innovations in formulation technology, including sustained-release and barrier-enhancing products that improve skin penetration and therapeutic outcomes.

Lower risk of systemic side effects has reinforced the appeal of topical administration, particularly for long-term management of chronic dermatological conditions Continued product innovation and expansion into over-the-counter categories are expected to maintain the topical route’s dominance in the market.

Sales Trend Analysis from 2020 to 2025 Compared to Market Outlook for 2025 to 2035

Attributes Details
Antipruritic Market Size (2020) USD 9.1 billion
Antipruritic Market Size (2025) USD 10.5 billion
Antipruritic Market CAGR (2020 to 2025) 4.1%

The market observed a growth of 4.1% during 2020 and 2025. The global market for antipruritic held nearly 64.6% of the overall USD 11.4 billion skin treatment market shares in 2025.

The most frequent dermatologic symptom reported by patients is pruritus. It is associated with a variety of skin conditions, the majority of which are characterized by primary lesions such as vesicles, plaques, and papules.

The underlying causes of pruritus are still unknown, making it difficult for healthcare practitioners to control itching in individuals with severe pruritus adequately. There are typically discrepancies between causative and symptomatic approaches to pruritus therapy. A common strategy for navigating the broad terrain of pruritus therapy is to categorize these alternatives according to their underlying causes.

Causative therapy aims to identify and treat the underlying illness causing the itching. Symptomatic treatment hides the itch through treatments such as cooling, heating, or counter-irritation (e.g., scratching). To provide relief sooner, symptomatic treatment and addressing the underlying disease process may be used. The popular therapeutic options are classified as symptomatic therapy and management.

Disruptive technical advancements, increasing healthcare investments, and health system optimization are driving the swift development of the medical and drug industries. Modern medical institutions, ambulatory care centers, and clinics throughout the world are deliberately adopting cutting-edge technological technologies and equipment into their operations to improve efficiency and competitiveness.

The global market's revenue growth is fuelled by factors such as rising chronic illness incidence, rapid improvements in the healthcare and medical sectors, widespread use of new instruments and techniques, and increased funding from various public and private sectors.

Furthermore, rising emphasis on drug discovery, rising need for precision medicine, widespread deployment of home care services and point-of-care diagnostics, and increased investments in R&D activities are likely to boost global market revenue and profit during the projected timeframe.

These factors are projected to impact the growth of the industry worldwide positively. With a CAGR of 4.2%, the industry is predicted to develop significantly during the following decade.

Lucrative Opportunities Driving Demand Growth in the Antipruritic Market

Chronic pruritus, a growing health problem, significantly impacts quality of life. Ongoing research has revealed new pathways and itch receptors, which has improved our understanding of these aspects. Expectations are strong that these latest insights are going to encourage the development of ground-breaking treatments for this frequently ignored and inconvenient ailment.

The administration of medications that reduce neural sensitization to pain, such as gabapentin, pregabalin, SSRIs, and norepinephrine antidepressants, either singly or in combination, is now required for the therapeutic management of chronic pruritus.

In the future, adopting a variety of topical and systemic medicines that focus on the different receptors and neurological pathways mediating distinct forms of itch would improve the quality of life for millions of pruritic patients.

Factors Restraining the Demand for Antipruritics

Because of the condition's complex etiology and various contributing factors, treating chronic pruritus (CP) remains challenging. Despite the well-known antipruritic properties of traditional pharmacotherapy, such as topical therapy, light therapy, and systemic therapy, these strategies typically fail to provide significant relief for affected individuals.

Despite the wide range of therapy options, chronic pruritus is still challenging to treat. Several antipruritic treatments are still used off-label as of right now. There are currently just a few effective topical treatments for itching, and existing itch management techniques do not cover most unmet needs.

Furthermore, few published works employ general health metrics to evaluate CP, and there are very few economic statistics on the cost of chronic pruritus. According to the American Academy of Dermatology's (AAD) National Burden of Skin Disease report, pruritus-related disorders in the United States incur a yearly treatment expense of USD 9.4 million and an opportunity cost of USD 107 million (2020).

According to Luk et al. (2024), people with CP have an annual financial burden of USD 1,067 because of both direct and secondary medical costs. The impact of stress, anxiety, depression, and functional incapacity on the patient and their loved ones as a result of the condition are examples of what are known as intangible costs that are not taken into account by current techniques of cost assessment.

During the forecast period, the market is expected to experience barriers in its growth trajectory due to a significant financial burden, limited evidence-based data, and parameters associated with existing treatment alternatives.

Analysis of Top Countries Prescribing,Distributing,Formulating,and Using Antipruritics

Countries CAGR (2025 to 2035)
United States 37.4%
China 8.9%
Germany 4.70%
United Kingdom 5.10%
Japan 3.20%

The United States Emerges as the Leading Market for Antipruritic

The United States dominated the antipruritic market with 37.4% of market shares in 2025. The antipruritic market size in the United States is estimated to rise at a 4.30% CAGR through 2035. The country has a vast healthcare system includes comprehensive patient care and reimbursement provisions. Moreover, with greater patient awareness regarding various treatment modalities and options for pruritus treatments, the country holds a leading stance within the global market.

China is Considered a Lucrative Market for Antipruritic

China captured a value share of 8.9% in the global market in 2025. The demand for antipruritic treatments is projected to surge at a 6.90% CAGR through 2035. It has been observed in several population-based studies that in Chinese patients, the frequency and severity of pruritus vary with skin conditions, skin type, age, and gender.

According to GBD 2020, young and middle-aged demographics have a higher illness burden from acne. Nearly 9.4% of the world’s population suffers from acne, making it the 8th most widespread condition globally. The market for antipruritics is driven by the increased prevalence of skin diseases in China, providing key producers with opportunities to expand within the country.

Sales Outlook for Germany in the Global Market

Germany held around 5.7% of the antipruritic market in 2025. The market for antipruritic in Germany is predicted to thrive at a 4.70% CAGR through 2035. In Germany, a surprisingly high number of pruritus sufferers, particularly those with specific localizations on the body, have unmet medical needs. This factor promotes opportunities for established manufacturers within the country to promote and develop novel therapeutics, addressing these unmet needs, hence propelling growth throughout the forecast period.

Rising Telemedicine Adoption Surges Market Growth in the United Kingdom

The United Kingdom held nearly 3.50% of the market shares in 2025. The demand for antipruritic in the United Kingdom is estimated to rise at a 5.10% CAGR through 2035. The introduction of telemedicine services in the United Kingdom has unlocked the door to online consultations and prescriptions for antipruritic drugs, increasing access to healthcare services. Government subsidies or incentives for research and development could appeal to pharmaceutical businesses to invest in producing new and improved antipruritic remedies.

Technological Developments in Dermatology Spur Expansion in Japan

Japan held nearly 5.20% of the market shares in 2025. The antipruritic market size in Japan is projected to surge at a 3.20% CAGR through 2035. Skincare and appearance are highly valued in Japanese society. A robust cultural preference for preserving good skin increases demand for antipruritic treatments, particularly those with aesthetic advantages. Japan is famous for its technological advances. Integration of cutting-edge technology, such as smart skincare devices or AI-driven diagnostic tools for dermatological diseases, could represent a differentiating element in market growth.

Antipruritic Industry Analysis by Top Investment Segments

Immunosuppressants Experience High Adoption on a Global Scale

Segment Immunosuppressants (Drug Type)
Value Share (2025) 31.3%

Immunosuppressants held a share of around 31.3% in the global market in 2025. This is due to the effectiveness of oral immunosuppressants such as cyclosporine, mycophenolate mofetil, and azathioprine in treating itching caused by inflammatory disorders like atopic dermatitis. Furthermore, systemic corticosteroids can also be administered to reduce inflammation in extreme situations of chronic pruritus.

The most effective way to reduce itching in atopic dermatitis is to manage the inflammation with topical or systemic immunosuppressive medications effectively.

Psoriasis Disease is a Large Concern within the Global Market

Segment Psoriasis (Disease Type)
Value Share (2025) 33.2%

Psoriasis held around 33.2% of the global market in 2025. Psoriasis is a prevalent, chronic illness that has no cure. According to the 2020 report on the worldwide disease burden, there have been 4,622,594 reported cases of psoriasis globally in that year. The age range of 60 to 69 years has the maximum prevalence of psoriasis overall, with a roughly equal frequency between men and women.

The burden is substantially heavier in North American and European countries with high incomes and high SDI indices. To help reduce the disease burden of psoriasis globally, this factor fuels the interest of manufacturers in the market in the development of novel therapies.

Oral Route of Administration is Highly Preferred in the Antipruritic Market

Segment Oral (Route of Administration)
Value Share (2025) 39.8%

The oral route of administration held a share of around 39.8% in the global market in 2025. This is due to the usage of oral antihistamines for the symptomatic alleviation of pruritus. Oral antihistamines of the first or second generations, such as cetirizine and loratadine, are widely recommended. First-generation oral antihistamines include diphenhydramine and hydroxyzine.

Moreover, due to the ease of administration of oral medication dosages, the oral route of administration gains a more significant share within the global market.

Hospital Pharmacies Distribution Channel Reap Great Benefits

Segment Hospital Pharmacies (Distribution Channel)
Value Share (2025) 30.4%

Hospital pharmacies held around 30.4% of the global market in 2025. Several institutional pharmacies provide commonly prescribed medications for pruritus at subsidized rates, thus propelling sales of antipruritics within these settings. Moreover, with the ease of dispensing, presence of branded and generic drug options, as well as greater accessibility to patients, this segment holds a dominant share within the global market.
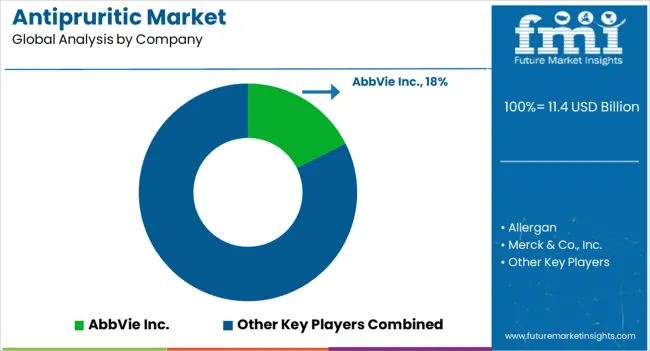
Leading Suppliers of Antipruritic Products

Antipruritic Market Analysis By Company

Key players are enhancing their research and development activities to launch novel products. The expansion of their product range and efforts to improve their pipelined products are two other strategic acquisitions and partnerships with key businesses.

Recent Developments

  • In May 2025, Biofrontera announced that the care foam Belixos ACTIVE CARE was added to the active cosmetic series Belixos. Topical dermatitis and psoriasis patients' go-to treatment for basic or extensive skin issues can benefit from using Belixos ACTIVE CARE, a skin-soothing care foam for irritated and itchy skin.
  • In October 2025, Sonoma Pharmaceuticals, Inc., a leader in the global healthcare industry that develops and produces stabilized hypochlorous acid (HOCl) products based on patented Microcyn technology for a variety of applications, including wound, eye, oral, and nasal care, as well as dermatological conditions, announced the launch of Reliefacyn Advanced Itch-Burn-Rash-Pain Relief Hydrogel and Rejuvacyn Advanced Skin Repair Cooling Mist for consumers in the United States for over-the-counter use.
  • The new atopic dermatitis therapy Moizerto Ointment (generic name: difamilast), available in 1 percent and 0.3 percent formulations, was introduced in Japan on June 1, 2025, according to a statement from Otsuka Pharmaceutical Co., Ltd. (Otsuka).
  • The United States FDA authorized Pfizer's CIBINQO (abrocitinib) in January 2025 for use in individuals with moderate-to-severe atopic dermatitis.
  • In May 2024, Sanofi received United States FDA approval for its Dupixent (dupilumab), the first biologic medicine for children aged 6 to 11 years with moderate-to-severe atopic dermatitis.

Key Shifting Preferences Covered in Antipruritic Market Report

Attribute Details
Forecast Period 2025 to 2035
Historical Data Available for 2020 to 2025
Market Analysis USD billion for Value
Key Regions Covered North America, Latin America, Europe, South Asia, East Asia, Oceania, the Middle East and Africa (MEA)
Key Countries Covered United States, Canada, Brazil, Mexico, Argentina, Germany, Italy, France, Spain, United Kingdom, Russia, BENELUX, China, Japan, South Korea, India, Indonesia, Thailand, Malaysia, Australia, New Zealand, GCC Countries, Turkey, North Africa, South Africa
Key Companies Covered AbbVie Inc.; Allergan, Merck & Co., Inc.; Amgen Inc.; Pfizer Inc.; Cara Therapeutics; Enteris BioPharma; NeRRe Therapeutics; Menlo Therapeutics; XBiotech Inc.; Ipsen Pharma; Eledon Pharmaceuticals, Inc.; Amorepacific; RDD Pharma, Ltd; Novartis AG; AstraZeneca; Sanofi; Sun Pharmaceutical Industries Ltd.; Teva Pharmaceutical Industries Ltd.; Takeda Pharmaceutical Company Limited; Cipla Ltd.
Key Market Segments Covered Drug, Disease, Route of Administration, Distribution Channel, and Region
Pricing Available upon Request

Top Segments Studied in the Antipruritic Market Report

By Drug:

  • Corticosteroids
  • Antihistamines
  • Local Anaesthetics
  • Immunosuppressants
  • Others

By Disease:

  • Atopic Dermatitis
  • Allergic Contact Dermatitis
  • Urticaria
  • Psoriasis

By Route of Administration:

  • Oral
  • Parenteral
  • Topical

By Distribution Channel:

  • Hospital Pharmacies
  • Drug Stores
  • Retail Pharmacies
  • Online Stores

By Region:

  • North America
  • Latin America
  • Europe
  • South Asia
  • East Asia
  • Oceania
  • The Middle East & Africa (MEA)

Frequently Asked Questions

How big is the antipruritic market in 2025?

The global antipruritic market is estimated to be valued at USD 11.4 billion in 2025.

What will be the size of antipruritic market in 2035?

The market size for the antipruritic market is projected to reach USD 16.9 billion by 2035.

How much will be the antipruritic market growth between 2025 and 2035?

The antipruritic market is expected to grow at a 4.0% CAGR between 2025 and 2035.

What are the key product types in the antipruritic market?

The key product types in antipruritic market are corticosteroids, antihistamines, local anaesthetics, immunosuppressants and others.

Which disease segment to contribute significant share in the antipruritic market in 2025?

In terms of disease, atopic dermatitis segment to command 38.7% share in the antipruritic market in 2025.

Table of Content

  1. Executive Summary
    • Global Market Outlook
    • Demand-side Trends
    • Supply-side Trends
    • Technology Roadmap Analysis
    • Analysis and Recommendations
  2. Market Overview
    • Market Coverage / Taxonomy
    • Market Definition / Scope / Limitations
  3. Market Background
    • Market Dynamics
      • Drivers
      • Restraints
      • Opportunity
      • Trends
    • Scenario Forecast
      • Demand in Optimistic Scenario
      • Demand in Likely Scenario
      • Demand in Conservative Scenario
    • Opportunity Map Analysis
    • Product Life Cycle Analysis
    • Supply Chain Analysis
    • Investment Feasibility Matrix
    • Value Chain Analysis
    • PESTLE and Porter’s Analysis
    • Regulatory Landscape
    • Regional Parent Market Outlook
    • Production and Consumption Statistics
    • Import and Export Statistics
  4. Global Market Analysis 2020 to 2024 and Forecast, 2025 to 2035
    • Historical Market Size Value (USD Million) Analysis, 2020 to 2024
    • Current and Future Market Size Value (USD Million) Projections, 2025 to 2035
      • Y-o-Y Growth Trend Analysis
      • Absolute $ Opportunity Analysis
  5. Global Market Pricing Analysis 2020 to 2024 and Forecast 2025 to 2035
  6. Global Market Analysis 2020 to 2024 and Forecast 2025 to 2035, By Drug
    • Introduction / Key Findings
    • Historical Market Size Value (USD Million) Analysis By Drug , 2020 to 2024
    • Current and Future Market Size Value (USD Million) Analysis and Forecast By Drug , 2025 to 2035
      • Corticosteroids
      • Antihistamines
      • Local Anaesthetics
      • Immunosuppressants
      • Others
    • Y-o-Y Growth Trend Analysis By Drug , 2020 to 2024
    • Absolute $ Opportunity Analysis By Drug , 2025 to 2035
  7. Global Market Analysis 2020 to 2024 and Forecast 2025 to 2035, By Disease
    • Introduction / Key Findings
    • Historical Market Size Value (USD Million) Analysis By Disease, 2020 to 2024
    • Current and Future Market Size Value (USD Million) Analysis and Forecast By Disease, 2025 to 2035
      • Atopic Dermatitis
      • Allergic Contact Dermatitis
      • Urticaria
      • Psoriasis
    • Y-o-Y Growth Trend Analysis By Disease, 2020 to 2024
    • Absolute $ Opportunity Analysis By Disease, 2025 to 2035
  8. Global Market Analysis 2020 to 2024 and Forecast 2025 to 2035, By Route of Administration
    • Introduction / Key Findings
    • Historical Market Size Value (USD Million) Analysis By Route of Administration, 2020 to 2024
    • Current and Future Market Size Value (USD Million) Analysis and Forecast By Route of Administration, 2025 to 2035
      • Topical
      • Oral
      • Parenteral
    • Y-o-Y Growth Trend Analysis By Route of Administration, 2020 to 2024
    • Absolute $ Opportunity Analysis By Route of Administration, 2025 to 2035
  9. Global Market Analysis 2020 to 2024 and Forecast 2025 to 2035, By Distribution Channel
    • Introduction / Key Findings
    • Historical Market Size Value (USD Million) Analysis By Distribution Channel, 2020 to 2024
    • Current and Future Market Size Value (USD Million) Analysis and Forecast By Distribution Channel, 2025 to 2035
      • Hospital Pharmacies
      • Drug Stores
      • Retail Pharmacies
      • Online Stores
    • Y-o-Y Growth Trend Analysis By Distribution Channel, 2020 to 2024
    • Absolute $ Opportunity Analysis By Distribution Channel, 2025 to 2035
  10. Global Market Analysis 2020 to 2024 and Forecast 2025 to 2035, By Region
    • Introduction
    • Historical Market Size Value (USD Million) Analysis By Region, 2020 to 2024
    • Current Market Size Value (USD Million) Analysis and Forecast By Region, 2025 to 2035
      • North America
      • Latin America
      • Western Europe
      • Eastern Europe
      • East Asia
      • South Asia and Pacific
      • Middle East & Africa
    • Market Attractiveness Analysis By Region
  11. North America Market Analysis 2020 to 2024 and Forecast 2025 to 2035, By Country
    • Historical Market Size Value (USD Million) Trend Analysis By Market Taxonomy, 2020 to 2024
    • Market Size Value (USD Million) Forecast By Market Taxonomy, 2025 to 2035
      • By Country
        • USA
        • Canada
        • Mexico
      • By Drug
      • By Disease
      • By Route of Administration
      • By Distribution Channel
    • Market Attractiveness Analysis
      • By Country
      • By Drug
      • By Disease
      • By Route of Administration
      • By Distribution Channel
    • Key Takeaways
  12. Latin America Market Analysis 2020 to 2024 and Forecast 2025 to 2035, By Country
    • Historical Market Size Value (USD Million) Trend Analysis By Market Taxonomy, 2020 to 2024
    • Market Size Value (USD Million) Forecast By Market Taxonomy, 2025 to 2035
      • By Country
        • Brazil
        • Chile
        • Rest of Latin America
      • By Drug
      • By Disease
      • By Route of Administration
      • By Distribution Channel
    • Market Attractiveness Analysis
      • By Country
      • By Drug
      • By Disease
      • By Route of Administration
      • By Distribution Channel
    • Key Takeaways
  13. Western Europe Market Analysis 2020 to 2024 and Forecast 2025 to 2035, By Country
    • Historical Market Size Value (USD Million) Trend Analysis By Market Taxonomy, 2020 to 2024
    • Market Size Value (USD Million) Forecast By Market Taxonomy, 2025 to 2035
      • By Country
        • Germany
        • UK
        • Italy
        • Spain
        • France
        • Nordic
        • BENELUX
        • Rest of Western Europe
      • By Drug
      • By Disease
      • By Route of Administration
      • By Distribution Channel
    • Market Attractiveness Analysis
      • By Country
      • By Drug
      • By Disease
      • By Route of Administration
      • By Distribution Channel
    • Key Takeaways
  14. Eastern Europe Market Analysis 2020 to 2024 and Forecast 2025 to 2035, By Country
    • Historical Market Size Value (USD Million) Trend Analysis By Market Taxonomy, 2020 to 2024
    • Market Size Value (USD Million) Forecast By Market Taxonomy, 2025 to 2035
      • By Country
        • Russia
        • Poland
        • Hungary
        • Balkan & Baltic
        • Rest of Eastern Europe
      • By Drug
      • By Disease
      • By Route of Administration
      • By Distribution Channel
    • Market Attractiveness Analysis
      • By Country
      • By Drug
      • By Disease
      • By Route of Administration
      • By Distribution Channel
    • Key Takeaways
  15. East Asia Market Analysis 2020 to 2024 and Forecast 2025 to 2035, By Country
    • Historical Market Size Value (USD Million) Trend Analysis By Market Taxonomy, 2020 to 2024
    • Market Size Value (USD Million) Forecast By Market Taxonomy, 2025 to 2035
      • By Country
        • China
        • Japan
        • South Korea
      • By Drug
      • By Disease
      • By Route of Administration
      • By Distribution Channel
    • Market Attractiveness Analysis
      • By Country
      • By Drug
      • By Disease
      • By Route of Administration
      • By Distribution Channel
    • Key Takeaways
  16. South Asia and Pacific Market Analysis 2020 to 2024 and Forecast 2025 to 2035, By Country
    • Historical Market Size Value (USD Million) Trend Analysis By Market Taxonomy, 2020 to 2024
    • Market Size Value (USD Million) Forecast By Market Taxonomy, 2025 to 2035
      • By Country
        • India
        • ASEAN
        • Australia & New Zealand
        • Rest of South Asia and Pacific
      • By Drug
      • By Disease
      • By Route of Administration
      • By Distribution Channel
    • Market Attractiveness Analysis
      • By Country
      • By Drug
      • By Disease
      • By Route of Administration
      • By Distribution Channel
    • Key Takeaways
  17. Middle East & Africa Market Analysis 2020 to 2024 and Forecast 2025 to 2035, By Country
    • Historical Market Size Value (USD Million) Trend Analysis By Market Taxonomy, 2020 to 2024
    • Market Size Value (USD Million) Forecast By Market Taxonomy, 2025 to 2035
      • By Country
        • Kingdom of Saudi Arabia
        • Other GCC Countries
        • Turkiye
        • South Africa
        • Other African Union
        • Rest of Middle East & Africa
      • By Drug
      • By Disease
      • By Route of Administration
      • By Distribution Channel
    • Market Attractiveness Analysis
      • By Country
      • By Drug
      • By Disease
      • By Route of Administration
      • By Distribution Channel
    • Key Takeaways
  18. Key Countries Market Analysis
    • USA
      • Pricing Analysis
      • Market Share Analysis, 2024
        • By Drug
        • By Disease
        • By Route of Administration
        • By Distribution Channel
    • Canada
      • Pricing Analysis
      • Market Share Analysis, 2024
        • By Drug
        • By Disease
        • By Route of Administration
        • By Distribution Channel
    • Mexico
      • Pricing Analysis
      • Market Share Analysis, 2024
        • By Drug
        • By Disease
        • By Route of Administration
        • By Distribution Channel
    • Brazil
      • Pricing Analysis
      • Market Share Analysis, 2024
        • By Drug
        • By Disease
        • By Route of Administration
        • By Distribution Channel
    • Chile
      • Pricing Analysis
      • Market Share Analysis, 2024
        • By Drug
        • By Disease
        • By Route of Administration
        • By Distribution Channel
    • Germany
      • Pricing Analysis
      • Market Share Analysis, 2024
        • By Drug
        • By Disease
        • By Route of Administration
        • By Distribution Channel
    • UK
      • Pricing Analysis
      • Market Share Analysis, 2024
        • By Drug
        • By Disease
        • By Route of Administration
        • By Distribution Channel
    • Italy
      • Pricing Analysis
      • Market Share Analysis, 2024
        • By Drug
        • By Disease
        • By Route of Administration
        • By Distribution Channel
    • Spain
      • Pricing Analysis
      • Market Share Analysis, 2024
        • By Drug
        • By Disease
        • By Route of Administration
        • By Distribution Channel
    • France
      • Pricing Analysis
      • Market Share Analysis, 2024
        • By Drug
        • By Disease
        • By Route of Administration
        • By Distribution Channel
    • India
      • Pricing Analysis
      • Market Share Analysis, 2024
        • By Drug
        • By Disease
        • By Route of Administration
        • By Distribution Channel
    • ASEAN
      • Pricing Analysis
      • Market Share Analysis, 2024
        • By Drug
        • By Disease
        • By Route of Administration
        • By Distribution Channel
    • Australia & New Zealand
      • Pricing Analysis
      • Market Share Analysis, 2024
        • By Drug
        • By Disease
        • By Route of Administration
        • By Distribution Channel
    • China
      • Pricing Analysis
      • Market Share Analysis, 2024
        • By Drug
        • By Disease
        • By Route of Administration
        • By Distribution Channel
    • Japan
      • Pricing Analysis
      • Market Share Analysis, 2024
        • By Drug
        • By Disease
        • By Route of Administration
        • By Distribution Channel
    • South Korea
      • Pricing Analysis
      • Market Share Analysis, 2024
        • By Drug
        • By Disease
        • By Route of Administration
        • By Distribution Channel
    • Russia
      • Pricing Analysis
      • Market Share Analysis, 2024
        • By Drug
        • By Disease
        • By Route of Administration
        • By Distribution Channel
    • Poland
      • Pricing Analysis
      • Market Share Analysis, 2024
        • By Drug
        • By Disease
        • By Route of Administration
        • By Distribution Channel
    • Hungary
      • Pricing Analysis
      • Market Share Analysis, 2024
        • By Drug
        • By Disease
        • By Route of Administration
        • By Distribution Channel
    • Kingdom of Saudi Arabia
      • Pricing Analysis
      • Market Share Analysis, 2024
        • By Drug
        • By Disease
        • By Route of Administration
        • By Distribution Channel
    • Turkiye
      • Pricing Analysis
      • Market Share Analysis, 2024
        • By Drug
        • By Disease
        • By Route of Administration
        • By Distribution Channel
    • South Africa
      • Pricing Analysis
      • Market Share Analysis, 2024
        • By Drug
        • By Disease
        • By Route of Administration
        • By Distribution Channel
  19. Market Structure Analysis
    • Competition Dashboard
    • Competition Benchmarking
    • Market Share Analysis of Top Players
      • By Regional
      • By Drug
      • By Disease
      • By Route of Administration
      • By Distribution Channel
  20. Competition Analysis
    • Competition Deep Dive
      • AbbVie Inc.
        • Overview
        • Product Portfolio
        • Profitability by Market Segments (Product/Age /Sales Channel/Region)
        • Sales Footprint
        • Strategy Overview
          • Marketing Strategy
          • Product Strategy
          • Channel Strategy
      • Allergan
      • Merck & Co., Inc.
      • Amgen Inc.
      • Pfizer Inc.
      • Cara Therapeutics
      • Enteris BioPharma
      • NeRRe Therapeutics
      • Menlo Therapeutics
      • XBiotech Inc.
      • Ipsen Pharma
      • Eledon Pharmaceuticals, Inc.
      • Amorepacific
      • RDD Pharma, Ltd
      • Novartis AG
      • AstraZeneca
      • Sanofi
      • Sun Pharmaceutical Industries Ltd.
      • Teva Pharmaceutical Industries Ltd.
      • Takeda Pharmaceutical Company Limited
  21. Assumptions & Acronyms Used
  22. Research Methodology

List of Tables

  • Table 1: Global Market Value (USD Million) Forecast by Region, 2020-2035
  • Table 2: Global Market Value (USD Million) Forecast by Drug , 2020-2035
  • Table 3: Global Market Value (USD Million) Forecast by Disease, 2020-2035
  • Table 4: Global Market Value (USD Million) Forecast by Route of Administration, 2020-2035
  • Table 5: Global Market Value (USD Million) Forecast by Distribution Channel, 2020-2035
  • Table 6: North America Market Value (USD Million) Forecast by Country, 2020-2035
  • Table 7: North America Market Value (USD Million) Forecast by Drug , 2020-2035
  • Table 8: North America Market Value (USD Million) Forecast by Disease, 2020-2035
  • Table 9: North America Market Value (USD Million) Forecast by Route of Administration, 2020-2035
  • Table 10: North America Market Value (USD Million) Forecast by Distribution Channel, 2020-2035
  • Table 11: Latin America Market Value (USD Million) Forecast by Country, 2020-2035
  • Table 12: Latin America Market Value (USD Million) Forecast by Drug , 2020-2035
  • Table 13: Latin America Market Value (USD Million) Forecast by Disease, 2020-2035
  • Table 14: Latin America Market Value (USD Million) Forecast by Route of Administration, 2020-2035
  • Table 15: Latin America Market Value (USD Million) Forecast by Distribution Channel, 2020-2035
  • Table 16: Western Europe Market Value (USD Million) Forecast by Country, 2020-2035
  • Table 17: Western Europe Market Value (USD Million) Forecast by Drug , 2020-2035
  • Table 18: Western Europe Market Value (USD Million) Forecast by Disease, 2020-2035
  • Table 19: Western Europe Market Value (USD Million) Forecast by Route of Administration, 2020-2035
  • Table 20: Western Europe Market Value (USD Million) Forecast by Distribution Channel, 2020-2035
  • Table 21: Eastern Europe Market Value (USD Million) Forecast by Country, 2020-2035
  • Table 22: Eastern Europe Market Value (USD Million) Forecast by Drug , 2020-2035
  • Table 23: Eastern Europe Market Value (USD Million) Forecast by Disease, 2020-2035
  • Table 24: Eastern Europe Market Value (USD Million) Forecast by Route of Administration, 2020-2035
  • Table 25: Eastern Europe Market Value (USD Million) Forecast by Distribution Channel, 2020-2035
  • Table 26: East Asia Market Value (USD Million) Forecast by Country, 2020-2035
  • Table 27: East Asia Market Value (USD Million) Forecast by Drug , 2020-2035
  • Table 28: East Asia Market Value (USD Million) Forecast by Disease, 2020-2035
  • Table 29: East Asia Market Value (USD Million) Forecast by Route of Administration, 2020-2035
  • Table 30: East Asia Market Value (USD Million) Forecast by Distribution Channel, 2020-2035
  • Table 31: South Asia and Pacific Market Value (USD Million) Forecast by Country, 2020-2035
  • Table 32: South Asia and Pacific Market Value (USD Million) Forecast by Drug , 2020-2035
  • Table 33: South Asia and Pacific Market Value (USD Million) Forecast by Disease, 2020-2035
  • Table 34: South Asia and Pacific Market Value (USD Million) Forecast by Route of Administration, 2020-2035
  • Table 35: South Asia and Pacific Market Value (USD Million) Forecast by Distribution Channel, 2020-2035
  • Table 36: Middle East & Africa Market Value (USD Million) Forecast by Country, 2020-2035
  • Table 37: Middle East & Africa Market Value (USD Million) Forecast by Drug , 2020-2035
  • Table 38: Middle East & Africa Market Value (USD Million) Forecast by Disease, 2020-2035
  • Table 39: Middle East & Africa Market Value (USD Million) Forecast by Route of Administration, 2020-2035
  • Table 40: Middle East & Africa Market Value (USD Million) Forecast by Distribution Channel, 2020-2035

List of Figures

  • Figure 1: Global Market Pricing Analysis
  • Figure 2: Global Market Value (USD Million) Forecast 2020-2035
  • Figure 3: Global Market Value Share and BPS Analysis by Drug , 2025 and 2035
  • Figure 4: Global Market Y-o-Y Growth Comparison by Drug , 2025-2035
  • Figure 5: Global Market Attractiveness Analysis by Drug
  • Figure 6: Global Market Value Share and BPS Analysis by Disease, 2025 and 2035
  • Figure 7: Global Market Y-o-Y Growth Comparison by Disease, 2025-2035
  • Figure 8: Global Market Attractiveness Analysis by Disease
  • Figure 9: Global Market Value Share and BPS Analysis by Route of Administration, 2025 and 2035
  • Figure 10: Global Market Y-o-Y Growth Comparison by Route of Administration, 2025-2035
  • Figure 11: Global Market Attractiveness Analysis by Route of Administration
  • Figure 12: Global Market Value Share and BPS Analysis by Distribution Channel, 2025 and 2035
  • Figure 13: Global Market Y-o-Y Growth Comparison by Distribution Channel, 2025-2035
  • Figure 14: Global Market Attractiveness Analysis by Distribution Channel
  • Figure 15: Global Market Value (USD Million) Share and BPS Analysis by Region, 2025 and 2035
  • Figure 16: Global Market Y-o-Y Growth Comparison by Region, 2025-2035
  • Figure 17: Global Market Attractiveness Analysis by Region
  • Figure 18: North America Market Incremental Dollar Opportunity, 2025-2035
  • Figure 19: Latin America Market Incremental Dollar Opportunity, 2025-2035
  • Figure 20: Western Europe Market Incremental Dollar Opportunity, 2025-2035
  • Figure 21: Eastern Europe Market Incremental Dollar Opportunity, 2025-2035
  • Figure 22: East Asia Market Incremental Dollar Opportunity, 2025-2035
  • Figure 23: South Asia and Pacific Market Incremental Dollar Opportunity, 2025-2035
  • Figure 24: Middle East & Africa Market Incremental Dollar Opportunity, 2025-2035
  • Figure 25: North America Market Value Share and BPS Analysis by Country, 2025 and 2035
  • Figure 26: North America Market Value Share and BPS Analysis by Drug , 2025 and 2035
  • Figure 27: North America Market Y-o-Y Growth Comparison by Drug , 2025-2035
  • Figure 28: North America Market Attractiveness Analysis by Drug
  • Figure 29: North America Market Value Share and BPS Analysis by Disease, 2025 and 2035
  • Figure 30: North America Market Y-o-Y Growth Comparison by Disease, 2025-2035
  • Figure 31: North America Market Attractiveness Analysis by Disease
  • Figure 32: North America Market Value Share and BPS Analysis by Route of Administration, 2025 and 2035
  • Figure 33: North America Market Y-o-Y Growth Comparison by Route of Administration, 2025-2035
  • Figure 34: North America Market Attractiveness Analysis by Route of Administration
  • Figure 35: North America Market Value Share and BPS Analysis by Distribution Channel, 2025 and 2035
  • Figure 36: North America Market Y-o-Y Growth Comparison by Distribution Channel, 2025-2035
  • Figure 37: North America Market Attractiveness Analysis by Distribution Channel
  • Figure 38: Latin America Market Value Share and BPS Analysis by Country, 2025 and 2035
  • Figure 39: Latin America Market Value Share and BPS Analysis by Drug , 2025 and 2035
  • Figure 40: Latin America Market Y-o-Y Growth Comparison by Drug , 2025-2035
  • Figure 41: Latin America Market Attractiveness Analysis by Drug
  • Figure 42: Latin America Market Value Share and BPS Analysis by Disease, 2025 and 2035
  • Figure 43: Latin America Market Y-o-Y Growth Comparison by Disease, 2025-2035
  • Figure 44: Latin America Market Attractiveness Analysis by Disease
  • Figure 45: Latin America Market Value Share and BPS Analysis by Route of Administration, 2025 and 2035
  • Figure 46: Latin America Market Y-o-Y Growth Comparison by Route of Administration, 2025-2035
  • Figure 47: Latin America Market Attractiveness Analysis by Route of Administration
  • Figure 48: Latin America Market Value Share and BPS Analysis by Distribution Channel, 2025 and 2035
  • Figure 49: Latin America Market Y-o-Y Growth Comparison by Distribution Channel, 2025-2035
  • Figure 50: Latin America Market Attractiveness Analysis by Distribution Channel
  • Figure 51: Western Europe Market Value Share and BPS Analysis by Country, 2025 and 2035
  • Figure 52: Western Europe Market Value Share and BPS Analysis by Drug , 2025 and 2035
  • Figure 53: Western Europe Market Y-o-Y Growth Comparison by Drug , 2025-2035
  • Figure 54: Western Europe Market Attractiveness Analysis by Drug
  • Figure 55: Western Europe Market Value Share and BPS Analysis by Disease, 2025 and 2035
  • Figure 56: Western Europe Market Y-o-Y Growth Comparison by Disease, 2025-2035
  • Figure 57: Western Europe Market Attractiveness Analysis by Disease
  • Figure 58: Western Europe Market Value Share and BPS Analysis by Route of Administration, 2025 and 2035
  • Figure 59: Western Europe Market Y-o-Y Growth Comparison by Route of Administration, 2025-2035
  • Figure 60: Western Europe Market Attractiveness Analysis by Route of Administration
  • Figure 61: Western Europe Market Value Share and BPS Analysis by Distribution Channel, 2025 and 2035
  • Figure 62: Western Europe Market Y-o-Y Growth Comparison by Distribution Channel, 2025-2035
  • Figure 63: Western Europe Market Attractiveness Analysis by Distribution Channel
  • Figure 64: Eastern Europe Market Value Share and BPS Analysis by Country, 2025 and 2035
  • Figure 65: Eastern Europe Market Value Share and BPS Analysis by Drug , 2025 and 2035
  • Figure 66: Eastern Europe Market Y-o-Y Growth Comparison by Drug , 2025-2035
  • Figure 67: Eastern Europe Market Attractiveness Analysis by Drug
  • Figure 68: Eastern Europe Market Value Share and BPS Analysis by Disease, 2025 and 2035
  • Figure 69: Eastern Europe Market Y-o-Y Growth Comparison by Disease, 2025-2035
  • Figure 70: Eastern Europe Market Attractiveness Analysis by Disease
  • Figure 71: Eastern Europe Market Value Share and BPS Analysis by Route of Administration, 2025 and 2035
  • Figure 72: Eastern Europe Market Y-o-Y Growth Comparison by Route of Administration, 2025-2035
  • Figure 73: Eastern Europe Market Attractiveness Analysis by Route of Administration
  • Figure 74: Eastern Europe Market Value Share and BPS Analysis by Distribution Channel, 2025 and 2035
  • Figure 75: Eastern Europe Market Y-o-Y Growth Comparison by Distribution Channel, 2025-2035
  • Figure 76: Eastern Europe Market Attractiveness Analysis by Distribution Channel
  • Figure 77: East Asia Market Value Share and BPS Analysis by Country, 2025 and 2035
  • Figure 78: East Asia Market Value Share and BPS Analysis by Drug , 2025 and 2035
  • Figure 79: East Asia Market Y-o-Y Growth Comparison by Drug , 2025-2035
  • Figure 80: East Asia Market Attractiveness Analysis by Drug
  • Figure 81: East Asia Market Value Share and BPS Analysis by Disease, 2025 and 2035
  • Figure 82: East Asia Market Y-o-Y Growth Comparison by Disease, 2025-2035
  • Figure 83: East Asia Market Attractiveness Analysis by Disease
  • Figure 84: East Asia Market Value Share and BPS Analysis by Route of Administration, 2025 and 2035
  • Figure 85: East Asia Market Y-o-Y Growth Comparison by Route of Administration, 2025-2035
  • Figure 86: East Asia Market Attractiveness Analysis by Route of Administration
  • Figure 87: East Asia Market Value Share and BPS Analysis by Distribution Channel, 2025 and 2035
  • Figure 88: East Asia Market Y-o-Y Growth Comparison by Distribution Channel, 2025-2035
  • Figure 89: East Asia Market Attractiveness Analysis by Distribution Channel
  • Figure 90: South Asia and Pacific Market Value Share and BPS Analysis by Country, 2025 and 2035
  • Figure 91: South Asia and Pacific Market Value Share and BPS Analysis by Drug , 2025 and 2035
  • Figure 92: South Asia and Pacific Market Y-o-Y Growth Comparison by Drug , 2025-2035
  • Figure 93: South Asia and Pacific Market Attractiveness Analysis by Drug
  • Figure 94: South Asia and Pacific Market Value Share and BPS Analysis by Disease, 2025 and 2035
  • Figure 95: South Asia and Pacific Market Y-o-Y Growth Comparison by Disease, 2025-2035
  • Figure 96: South Asia and Pacific Market Attractiveness Analysis by Disease
  • Figure 97: South Asia and Pacific Market Value Share and BPS Analysis by Route of Administration, 2025 and 2035
  • Figure 98: South Asia and Pacific Market Y-o-Y Growth Comparison by Route of Administration, 2025-2035
  • Figure 99: South Asia and Pacific Market Attractiveness Analysis by Route of Administration
  • Figure 100: South Asia and Pacific Market Value Share and BPS Analysis by Distribution Channel, 2025 and 2035
  • Figure 101: South Asia and Pacific Market Y-o-Y Growth Comparison by Distribution Channel, 2025-2035
  • Figure 102: South Asia and Pacific Market Attractiveness Analysis by Distribution Channel
  • Figure 103: Middle East & Africa Market Value Share and BPS Analysis by Country, 2025 and 2035
  • Figure 104: Middle East & Africa Market Value Share and BPS Analysis by Drug , 2025 and 2035
  • Figure 105: Middle East & Africa Market Y-o-Y Growth Comparison by Drug , 2025-2035
  • Figure 106: Middle East & Africa Market Attractiveness Analysis by Drug
  • Figure 107: Middle East & Africa Market Value Share and BPS Analysis by Disease, 2025 and 2035
  • Figure 108: Middle East & Africa Market Y-o-Y Growth Comparison by Disease, 2025-2035
  • Figure 109: Middle East & Africa Market Attractiveness Analysis by Disease
  • Figure 110: Middle East & Africa Market Value Share and BPS Analysis by Route of Administration, 2025 and 2035
  • Figure 111: Middle East & Africa Market Y-o-Y Growth Comparison by Route of Administration, 2025-2035
  • Figure 112: Middle East & Africa Market Attractiveness Analysis by Route of Administration
  • Figure 113: Middle East & Africa Market Value Share and BPS Analysis by Distribution Channel, 2025 and 2035
  • Figure 114: Middle East & Africa Market Y-o-Y Growth Comparison by Distribution Channel, 2025-2035
  • Figure 115: Middle East & Africa Market Attractiveness Analysis by Distribution Channel
  • Figure 116: Global Market - Tier Structure Analysis
  • Figure 117: Global Market - Company Share Analysis
Dashboard
Dashboard
Dashboard
Dashboard
Dashboard
Dashboard

Full Research Suite comprises of:

Market outlook & trends analysis

Market outlook & trends analysis

Interviews & case studies

Interviews & case studies

Strategic recommendations

Strategic recommendations

Vendor profiles & capabilities analysis

Vendor profiles & capabilities analysis

5-year forecasts

5-year forecasts

8 regions and 60+ country-level data splits

8 regions and 60+ country-level data splits

Market segment data splits

Market segment data splits

12 months of continuous data updates

12 months of continuous data updates

DELIVERED AS:

PDF EXCEL ONLINE

Full Research Suite


$5000

$7500

$10000

Buy Report Now
Future Market Insights

Antipruritic Market

Chat With MaRIA

Chat With

MaRIA

Hi There, I am MaRIA, Your Market Research Intelligence Assistant. How may I help you?