
- Market Size (2026)
- USD 308.2 Mn
- Forecast (2036)
- USD 487.9 Mn
- CAGR (2026 to 2036)
- 4.7%
How big is Apocarotenal Market in 2026?
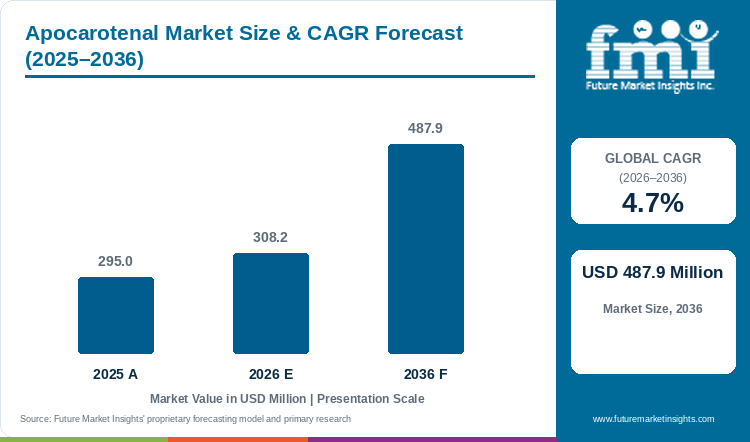
Starting from USD 295.0 million in 2025, the apocarotenal market valuation advanced to USD 308.2 million in 2026, with projections pointing toward USD 487.9 million by 2036 at a CAGR of 4.7%.
The global apocarotenal market was valued at USD 295.0 million in 2025 and is estimated to reach USD 308.2 million in 2026. The market is projected to reach USD 487.9 million by 2036, expanding at a compound annual growth rate (CAGR) of 4.7% between 2026 and 2036. Oil Suspension 20% formulations hold an estimated 42.7% share of 2026 demand, given that micronized C30 crystals dispersed in high-oleic sunflower oil blend directly into processed cheese kettles without water-phase spotting. Formulation trend analysis by FMI indicates that procurement of beta-apo-8'-carotenal is governed by synthetic dye phase-out schedules, since food brands replacing Sunset Yellow FCF (Yellow 6) need a single heat-stable molecule that delivers a true reddish-orange shade at 5 to 15 parts per million.
That regulatory dosage cap separates the category from the cheese color sector at 25.2% CAGR, where uncapped annatto and paprika extracts expand on sheer volume while INS 160e adoption tracks precision reformulation under the Joint FAO/WHO JECFA 0 to 0.3 mg/kg body-weight Acceptable Daily Intake ceiling. Color houses are scaling concentrated dispersion capacity to capture those conversions, evidenced when Sensient Technologies reported 18.1% Color Group revenue growth in the third quarter of 2026 on natural color rollouts. Dairy and beverage buyers lock in multi-year supply contracts once an E160e suspension or cold-water dispersible powder passes six-month light-stability qualification.
Key Market Trends & Insights
- By color formulation: Oil Suspension 20% holds an estimated 42.7% share in 2026 since micronized oil dispersions integrate directly into fat-continuous dairy and margarine lines.
- By regulatory grade: Food Grade Colorant E160e represents 63.1% in 2026 driven by retail and regulatory removal of petroleum-based Yellow 6 across packaged foods.
- By commercial end-use: Processed Cheese and Dairy Natural Reddish-Orange Coloring accounts for 41.9% in 2026 owing to high thermal stability during pasteurization and hot-fill slicing.
- By production pathway: Chemical Wittig and C30 Synthesis secures 68.4% in 2026 supported by consistent trans-isomer purity and standardized spectrophotometric color value.
- By distribution channel: Direct B2B Industrial Supply commands 61.5% in 2026 through custom shade calibration and antioxidant-stabilized contract deliveries.
Regional Highlights
- Top national expansion: India leads national growth projections at a 5.6% CAGR through 2036 under rapid organized dairy processing and export-compliant color standardization.
- Broader country progression: China advances at a 5.2% CAGR ahead of Germany at 4.9% and the United States at 4.7%, while Japan progresses at a 3.9% CAGR.
Market Size & Forecast
Table 1: Market Size and Forecast for the Apocarotenal Market (USD million and CAGR percentage), 2025 to 2036
| Metric | Value |
|---|---|
| 2025 Market Size | USD 295.0 million |
| Estimated Market Size in 2026 | USD 308.2 million |
| Projected Market Size by 2036 | USD 487.9 million |
| CAGR, 2026 to 2036 | 4.7% |
| Added Revenue, 2026 to 2036 | USD 179.7 million |
Processed cheese, salad dressing, and carbonated citrus drink manufacturers face intense retail pressure to eliminate petroleum-derived Yellow 6 and Red 40 without losing vivid reddish-orange shelf appeal. Standard C40 beta-carotene formulations often shift toward pale yellow in high-fat or UHT-treated matrices, forcing formulators to blend multiple pigments that oxidize at different rates. In July 2025, Lycored unveiled superstable nature-based color emulsions at IFT FIRST engineered to replace synthetic yellow and red dyes across UHT dairy and clear beverages with zero flavor carryover. Consequently, R&D teams specify beta-apo-8'-carotenal to achieve single-ingredient reddish-orange chromaticity with built-in provitamin A activity.
Treated-Matrix and Active-Dosage Sizing
Table 2: Treated-Matrix and Active-Dosage Sizing for the Apocarotenal Market (USD million and operational ranges), 2025 to 2036
| Metric | 2025 | 2026 | 2036 |
|---|---|---|---|
| Market size (USD million) | 295.0 | 308.2 | 487.9 |
| Treated processed cheese & fat matrices (million metric tons) | 11.8 to 13.4 | 12.3 to 14.0 | 18.8 to 21.5 |
| Commercial C30 carotenal dispersion volume (metric tons) | 1,420 to 1,580 | 1,485 to 1,650 | 2,290 to 2,540 |
| Active coloring cost per metric ton of finished food (USD) | 18.5 to 23.2 | 18.8 to 23.6 | 20.4 to 25.5 |
As per Table 2 estimates derived from industrial dairy and beverage batch records, global commercial volume of C30 carotenal dispersions rises from 1,485 to 1,650 metric tons in 2026 to 2,290 to 2,540 metric tons by 2036. High tinting strength allows dairy processors to color a metric ton of processed cheddar or gouda rind at an active pigment cost of USD 18.8 to 23.6, insulating buyer margins against agricultural crop volatility seen in botanical extracts.
Codex GSFA & Regulatory Ceiling Indicators
Table 3: Codex GSFA Maximum Permitted Levels and Clean-Label Conversion Indicators for the Apocarotenal Market (mg/kg and percentages), 2025 to 2036
| Metric | 2025 | 2026 | 2036 |
|---|---|---|---|
| Codex GSFA max level in ripened cheese rind (mg/kg) | 12.0 | 12.0 | 12.0 |
| Codex GSFA max level in emulsified sauces (mg/kg) | 80.0 | 80.0 | 80.0 |
| Codex GSFA max level in hard and soft candy (mg/kg) | 50.0 | 50.0 | 50.0 |
| Clean-label synthetic dye replacement share (%) | 54.0% to 58.0% | 57.0% to 61.0% | 74.0% to 79.0% |
Table 4: Regulatory & Grade Spending Indicators for the Apocarotenal Market (USD and statutory limits), 2026
| Metric | Value | Institutional Reference Basis |
|---|---|---|
| Market size, 2026 | USD 308.2 million | 2026 global valuation baseline |
| JECFA Acceptable Daily Intake (ADI) | 0 to 0.3 mg/kg bw | Joint FAO/WHO JECFA INS 160e toxicology benchmark |
| U.S. FDA 21 CFR 73.90 max dosage limit | 15 mg per lb or pt | FDA exempt color additive specification for foods |
| Food Grade Colorant E160e allocation, 2026 | USD 194.5 million | 63.1% regulatory grade revenue allocation |
As per the Joint FAO/WHO Expert Committee on Food Additives (JECFA) database and Codex Alimentarius GSFA Table 3 and Table 4 benchmarks, INS 160e is governed by an Acceptable Daily Intake of 0 to 0.3 mg/kg body weight. Permitted food levels reach 12 mg/kg in ripened cheese and 50 mg/kg in confectionery, while emulsified sauces allow up to 80 mg/kg. In the United States, 21 CFR 73.90 caps beta-apo-8'-carotenal at 15 milligrams per pound of solid food or pint of liquid, which directs commercial sales toward high-potency micro-dispersions that maximize visual chroma per milligram of active pigment.
Analyst Perspective
"Food and dairy processors do not procure beta-apo-8'-carotenal as a bulk commodity pigment; they buy guaranteed reddish-orange hue stability that survives UHT pasteurization and light-exposed retail chillers at single-digit ppm dosing. Suppliers that pair ascorbyl-palmitate and alpha-tocopherol antioxidant shields with cold-water dispersible starch matrices will capture the wave of Yellow 6 reformulations through 2036."
- Nandini Roy Choudhury, Principal Consultant, Future Market Insights.
How is the Apocarotenal Market segmented?
The apocarotenal market is segmented by color formulation, regulatory grade, commercial end-use, production pathway, and distribution channel.
By color formulation: Oil Suspension 20%, Cold Water Dispersible CWD Powder, Encapsulated Beadlets and Emulsified Liquid Concentrates.
By regulatory grade: Food Grade Colorant E160e, Animal Feed Carotenoid Premix, Pharmaceutical and Nutraceutical Excipient Grade and Cosmetic Grade.
By commercial end-use: Processed Cheese and Dairy Natural Reddish-Orange Coloring, Salad Dressings and Margarines, Citrus Beverages and Soft Drinks and Poultry Egg Yolk Pigmentation.
By production pathway: Chemical Wittig and C30 Synthesis, Botanical and Citrus Peel Extraction, Microbial and Algal Fermentation and Bio-Catalytic Cleavage.
By distribution channel: Direct B2B Industrial Supply, Specialty Chemical and Ingredient Distributors, Feed and Premix Blenders and Online B2B Portals.
Why does Oil Suspension 20% lead the color formulation category?
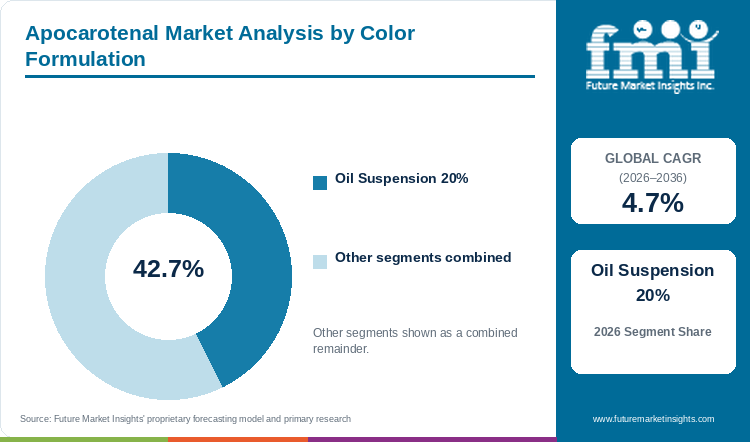
Oil Suspension 20% formulations hold an estimated 42.7% of color formulation demand in 2026, supported by direct lipid solubility in melted cheese and yellow fat processing.
Table 5: Color Formulation Share for the Apocarotenal Market (percentage share), 2026
| Color Formulation | Share (2026) |
|---|---|
| Oil Suspension 20% | 42.7% |
| Other Segments Combined | 57.3%* |
| Total | 100.0% |
Table 6: Color Formulation Leadership and Market Growth for the Apocarotenal Market (segment and CAGR percentage), 2026 to 2036
| Metric | Value |
|---|---|
| Global CAGR (2026 to 2036) | 4.7% |
| Leading Segment | Oil Suspension 20% |
Micronized 20% oil suspensions milled to crystal sizes below 5 microns in vegetable oil allow processed cheese, margarine, and lipid-based sauce manufacturers to dose C30 pigment directly into warm fat tanks without pre-hydration equipment. Technical research published in Applied Sciences in November 2025 confirmed that lipid and biopolymer barrier systems protect sensitive carotenoid pigments from oxygen and thermal degradation during dairy and bakery processing. High crystal concentration can cause sedimentation in chilled storage drums if viscosity is not controlled, prompting suppliers to stabilize suspensions with dl-alpha-tocopherol.
- Within the color formulation segment, Oil Suspension 20% is projected to account for a leading 42.7% share in 2026, driven by direct fat-phase dissolution in continuous cheese cookers.
- Cold Water Dispersible CWD Powder formulations are anticipated to gain incremental share through 2036 as beverage and dry-mix brands expand aqueous vitamin-drink lines.
What sustains Food Grade Colorant E160e leadership in the regulatory grade segment?
Food Grade Colorant E160e represents 63.1% of the regulatory grade category in 2026, driven by synthetic azo-dye replacement across human food and beverage categories.
Food Grade Colorant E160e dominates commercial procurement since human food and beverage brands pay a substantial purity premium for preparations meeting FCC and EU Regulation 231/2012 limits on residual solvents and heavy metals. Multi-country food exporters prefer E160e over plant-based food colors like paprika oleoresin when capsaicin pungency or batch-to-batch shade drift cannot be tolerated in mild dairy recipes. Strict JECFA toddler exposure ceilings nonetheless require formulators to verify exact ppm carry-over across multi-component food fillings.
- In 2026, Food Grade Colorant E160e is anticipated to capture 63.1% of global regulatory grade demand, reflecting widespread grocery brand conversion away from certified synthetic dyes.
- Regulatory records maintained by the U.S. Food and Drug Administration in August 2026 confirm that beta-apo-8'-carotenal holds permanent listing exempt from batch certification for general food coloring.
How does Processed Cheese and Dairy Natural Reddish-Orange Coloring lead commercial end-use?
Processed Cheese and Dairy Natural Reddish-Orange Coloring accounts for 41.9% of commercial end-use demand in 2026, anchored by thermal stability during UHT and emulsification steps.
Industrial processed cheese slices, spreads, and cheddar sauces subject colorants to 85-degree Celsius emulsifying salts and shear mixing where anthocyanins and betalains rapidly fade. Beta-apo-8'-carotenal binds uniformly to casein-fat globules to impart a warm reddish-orange cheddar tone without the pinking defects sometimes seen with annatto food colors under fluorescent retail lighting. Industry survey data released by Oterra in 2026 shows that more than 71% of American shoppers express concern over artificial colors in family food and dairy items, accelerating dairy plant conversions.
- By commercial end-use, Processed Cheese and Dairy Natural Reddish-Orange Coloring is estimated to reach 41.9% of category share in 2026 as dairy processors standardize heat-stable cheddar and rind hues.
- Citrus Beverages and Soft Drinks represent the fastest-advancing end-use niche through 2036 as starch-encapsulated CWD powders prevent neck-ringing in clear PET bottles.
Why does Chemical Wittig and C30 Synthesis lead the production pathway category?
Chemical Wittig and C30 Synthesis secures 68.4% of production pathway demand in 2026, supported by high-purity stereoisomer yields and standardized batch tinting strength.
Industrial synthesis via C19 aldehyde and C11 Wittig condensation or selective C40 beta-carotene oxidative cleavage delivers >96% all-trans isomer purity that natural spinach or citrus peel extraction cannot match at commercial scale. Food and feed buyers sourcing aluminum-free natural food colors and nature-identical carotenoids rely on synthetic C30 pathways to lock in fixed annual contract pricing. High capital intensity for multi-step synthesis reactors and vitamin-intermediate feedstocks remains the primary entry barrier restricting new producers.
- Strong repeat ordering across multinational food and feed blenders places Chemical Wittig and C30 Synthesis on course to hold an estimated 68.4% share of the production pathway category in 2026.
- Corporate sustainability filings from Divi's Laboratories in July 2026 document 20 years of continuous backward-integrated carotenoid synthesis and finished beadlet production serving global food and feed accounts.
What gives Direct B2B Industrial Supply the leading position in distribution channel?
Direct B2B Industrial Supply commands 61.5% of distribution channel share in 2026, anchored by multi-plant shade matching and oxidative stability qualification.
Carotenoid polyene chains oxidize rapidly if exposed to head-space oxygen or elevated warehouse temperatures. Large dairy and beverage integrators therefore contract directly with primary synthesis and encapsulation houses in aluminum-barrier drums flushed with nitrogen. Sustainability benchmarking published by Sensient Technologies in April 2026 demonstrated that engineering higher color-load dispersions reduces net dosage rates and transport emissions across direct industrial accounts. Smaller regional confectioners still rely on third-party distributors when minimum order quantities exceed single-pallet thresholds.
- Direct B2B Industrial Supply is predicted to secure 61.5% of distribution channel demand in 2026, supported by plant-specific shade matching and accelerated stability testing.
- Specialty Chemical and Ingredient Distributors are projected to expand steadily through 2036 by offering pre-blended carotenoid and emulsifier kits to mid-sized bakery and sauce makers.
What are the drivers, restraints, and opportunities in the Apocarotenal Market?
In the apocarotenal market, regulatory phase-outs of petroleum-derived food dyes and processed dairy expansion are projected to drive adoption, while narrow Acceptable Daily Intake ceilings restrain high-dosage beverage inclusion and cold-water dispersible microencapsulation opens clear drink reformulation.
- Driver: Federal and retail phase-outs of petroleum-derived Yellow 6 and Red 40 dyes compel processed cheese, snack, and beverage brands to qualify high-tinting E160e dispersions.
- Restraint: Tight JECFA Acceptable Daily Intake limits of 0 to 0.3 mg/kg body weight and polyene oxidation sensitivity restrict maximum dosage levels and require costly antioxidant encapsulation.
- Opportunity: Modified-starch and plant-protein cold-water dispersible microcapsules open transparent citrus beverage, gummy, and vegan cheese applications.
Growth Analysis and Future Potential: Qualitative Demand Catalysts
Regulatory enforcement and voluntary corporate pledges to eliminate synthetic petroleum dyes across North America and Europe are driving sustained procurement of beta-apo-8'-carotenal. Food manufacturers reformulating orange sodas and snack seasonings away from Sunset Yellow FCF require a pigment that delivers high redness (a* value) without blending unstable red and yellow extracts. In October 2026, the U.S. FDA updated its public registry tracking food industry pledges to remove petroleum-based food dyes while expanding flexibility for no-artificial-colors label claims. This compliance wave is driving multi-year volume commitments for E160e oil suspensions and water-dispersible powders across retail and foodservice supply chains.
Risk Assessment of the Apocarotenal Market: Operational and Formulation Friction
Auto-oxidation of the conjugated C30 polyene aldehyde chain under acidic beverage pH and UV retail lighting represents the primary technical friction restraining unencapsulated apocarotenal adoption. When protective hydrocolloid shells rupture during high-pressure homogenization, free carotenal crystals aggregate and form unsightly orange rings in bottled drinks while losing chromatic intensity. In December 2025, researchers reporting in Foods demonstrated that hydrophobic carotenoids require precise polysaccharide or protein colloidal organization to balance oxidative protection against digestive release. In addition, the JECFA 0.3 mg/kg body-weight ADI ceiling limits permissible inclusion rates in categories heavily consumed by children, restraining volume expansion compared with unrestricted anthocyanin food colors.
Commercial Opportunity Analysis: Formulation Differentiation and Value-Add Formats
Ingredient formulators are creating new demand avenues by replacing porcine-gelatin beadlet carriers with modified food starch and plant-protein nanoencapsulation matrices that qualify for kosher and vegan labels. Cold-water dispersible C30 powders engineered via high-pressure microfluidization dissolve instantaneously in cold beverage tanks without cloudiness or flavor off-notes, complementing lycopene food colors in fruit-blend drinks. In January 2026, a study in Frontiers in Nutrition verified that electrosprayed and nanoemulsified carotenoid carriers prevent crystal Ostwald ripening and substantially elevate oxidative shelf life and intestinal bioaccessibility. Suppliers offering gelatin-free, palm-free CWD apocarotenal grades capture premium margins from clean-label beverage and supplement brands.
Apocarotenal Market by Country (2026 to 2036)
FMI country modeling indicates that India leads apocarotenal expansion at a 5.6% CAGR through 2036, while Japan advances at a 3.9% CAGR. National adoption patterns across Asian food processing hubs, European cheese and feed complexes, and North American beverage plants reflect local synthetic-dye restrictions and cold-water dispersion capabilities.
Table 7: Country CAGR and Primary Growth Levers for the Apocarotenal Market (CAGR percentage and operational drivers), 2026 to 2036
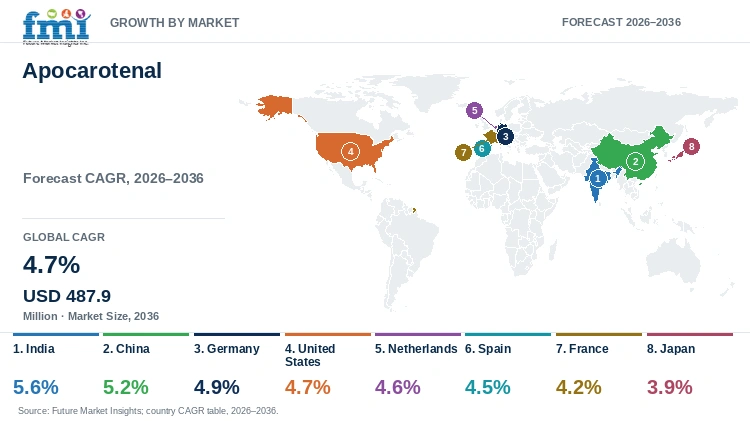
| Country | CAGR (2026 to 2036) | Primary Growth Lever |
|---|---|---|
| India | 5.6% | Rapid food processing formalization and export-aligned dairy coloring |
| China | 5.2% | Industrialized dairy, condiment, and laying-hen feed premix standardization |
| Germany | 4.9% | E160e processed cheese and emulsion sauce reformulation without azo dyes |
| United States | 4.7% | FDA no-artificial-colors claim flexibility and Yellow 6 replacement trials |
| Netherlands | 4.6% | Export cheese rind coating and concentrated carotenoid emulsion blending |
| Spain | 4.5% | Mediterranean citrus beverage, dressing, and poultry yolk pigment demand |
| France | 4.2% | Clean-label culinary sauce and processed cheese slice shade standardization |
| Japan | 3.9% | Precision beverage emulsion and premium red-yolk poultry feed supplementation |
Source: Future Market Insights analysis
India Apocarotenal Market Outlook (2026 to 2036)
Demand for apocarotenal in India is projected to expand at a leading 5.6% CAGR between 2026 and 2036 as domestic dairy cooperatives and snack processors scale packaged cheese slices, extruded namkeen snacks, and fruit drinks. What sets India apart from mature Western markets is its dual role as a rapidly formalizing consumer food market and a primary global synthesis and beadlet export base led by domestic manufacturers. New Delhi GAIN attaché analysis published in March 2026 noted that India's food processing industry is projected to expand by more than 50% between 2024 and the end of fiscal year 2026 while contributing 8% to 9% of national manufacturing output. While price sensitivity in unorganized snack segments still favors low-cost synthetic tartrazine and sunset yellow, export-oriented Indian dairy and confectionery plants specify E160e oil suspensions to comply with European and Middle Eastern import rules.
Key takeaway: In India, rapid food processing formalization and backward-integrated domestic carotenoid beadlet manufacturing are projected to drive leading 5.6% CAGR growth.
China Apocarotenal Market Outlook (2026 to 2036)
China's apocarotenal market is anticipated to advance at a 5.2% CAGR from 2026 to 2036, supported by large-scale industrial laying-hen feed premix operations and modernized dairy and beverage processing. Compared with Western markets where cheese coloring dominates, Chinese procurement balances GB 2760 food-additive coloring in citrus drinks and compound seasonings with intensive poultry egg-yolk pigmentation across commercial layer megafarms. Shenyang GAIN sector records from April 2026 documented that China remains the world's second-largest food processing and ingredient import market as domestic processors upgrade toward clean-label and functional formulations. Overcapacity in commodity C40 beta-carotene synthesis periodically pressures domestic pigment margins, prompting Chinese chemical producers to shift fermentation and Wittig reactor lines toward higher-margin C30 apocarotenal CWD powders.
Key takeaway: In China, commercial layer-feed yolk pigmentation and beverage reformulation under GB 2760 standards are anticipated to sustain a 5.2% CAGR through 2036.
Germany Apocarotenal Market Outlook (2026 to 2036)
In Germany, apocarotenal sales are forecast to progress at a 4.9% CAGR during the 2026 to 2036 period across automated processed cheese and vitamin beverage plants. Germany diverges from global baseline averages through its concentration of world-leading carotenoid synthesis and dispersion engineering combined with deeply entrenched retail avoidance of Southampton Six azo dyes that require child-activity warning labels under EU Regulation 1333/2008. Berlin agricultural attaché filings in March 2026 confirmed that Germany operates Europe's fourth-largest food processing industry and acts as the primary ingredient distribution hub for Central and Western Europe. Strict BfR and EFSA exposure monitoring nonetheless compels German formulators to blend E160e with paprika or beta-carotene to stay well below category ppm ceilings.
Key takeaway: In Germany, zero-azo-dye retail specifications across processed cheese and emulsified sauces are forecast to anchor a 4.9% CAGR.
United States Apocarotenal Market Outlook (2026 to 2036)
Commercial apocarotenal demand in the United States is estimated to grow with a 4.7% CAGR during the 2026 to 2036 decade across pasteurized process American cheese loaves, pourable salad dressings, and citrus soft drinks. What distinguishes the United States from European markets is the rapid 2025-to-2026 transition from certified FD&C Yellow No. 6 toward exempt color additives under federal and state school-food legislation. Federal color additive inventories updated in December 2025 reaffirmed beta-apo-8'-carotenal under 21 CFR 73.90 as an exempt color additive permitted up to 15 milligrams per pound of solid or semi-solid food or per pint of liquid food. American food brands switching from synthetic dyes to natural food color solutions rely on 20% oil suspensions to preserve iconic orange cheese-slice hues without triggering batch certification delays.
Key takeaway: In the United States, federal no-artificial-colors claim flexibility and FD&C Yellow No. 6 replacement in processed cheese and dressings are estimated to support a 4.7% CAGR.
Netherlands Apocarotenal Market Outlook (2026 to 2036)
The Netherlands apocarotenal market is projected to register a 4.6% CAGR through 2036, anchored by the country's massive export-oriented Gouda and Edam cheese processing sector and specialty premix compounding plants. In contrast to domestic-consumption markets, Dutch ingredient buyers incorporate E160e into protective cheese rind coatings and concentrated animal-nutrition premixes shipped across the European Union. Trade briefings from The Hague in April 2026 highlighted the Netherlands as the premier agri-food import and processing gateway supplying Germany and France. High energy and environmental compliance costs at Dutch dairy plants encourage processors to adopt pre-emulsified high-load carotenal concentrates that shorten vat mixing cycles.
Key takeaway: In the Netherlands, export cheese rind coloring and pan-European premix compounding are projected to sustain a 4.6% CAGR through 2036.
Spain Apocarotenal Market Outlook (2026 to 2036)
Demand for apocarotenal in Spain is slated to expand at a 4.5% CAGR across the 2026 to 2036 window in citrus fruit nectars, Mediterranean mayonnaise and dressing emulsions, and commercial laying-hen feed mills. Spain differs from northern European dairy-heavy markets given that high domestic consumption of orange-flavored soft drinks and golden-reddish table eggs drives dual demand for CWD beverage powders and feed-grade carotenoid premixes. Madrid GAIN market assessments published in March 2026 documented that Spain ranks as the European Union's third-largest agricultural producer and reached a record volume of imported food processing inputs in 2025. Elevated summer ambient temperatures across Spanish beverage distribution networks require ascorbate-stabilized CWD apocarotenal beadlets to prevent thermal color fading.
Key takeaway: In Spain, citrus beverage bottling and commercial laying-hen yolk pigmentation are slated to drive a 4.5% CAGR over the forecast decade.
France Apocarotenal Market Outlook (2026 to 2036)
In France, apocarotenal procurement is predicted to increase at a 4.2% CAGR from 2026 through 2036 in industrial processed cheese portions and gourmet emulsified sauces. Compared with markets that permit broad synthetic additive usage, French supermarket Nutri-Score and clean-label charters push formulators to minimize E-number complexity while maintaining appetizing golden-orange visual cues in European natural food color systems. Paris agricultural attaché briefings in April 2026 pointed out that domestic food processors continue prioritizing high-value ingredient reformulation despite modest macroeconomic expansion in 2025. French culinary brands consequently pair micro-dosed E160e oil suspensions with natural rosemary and tocopherol antioxidants to preserve color in chilled glass-jar sauces.
Key takeaway: In France, retail clean-label reformulation across processed cheese portions and culinary sauces is predicted to support a 4.2% CAGR.
Japan Apocarotenal Market Outlook (2026 to 2036)
Japanese apocarotenal demand is forecast to advance at a 3.9% CAGR over the 2026 to 2036 timeline in precision-formulated functional beverages, processed cheese snacks, and specialty poultry rations for deep-orange tamago egg yolks. What sets Japan apart from Western markets is its mature demographic profile and strict Ministry of Health, Labour and Welfare specifications for non-settling sub-micron beverage emulsions. Tokyo GAIN sector data from April 2026 demonstrated that while Japan's overall food processing output contracted by 3% in 2025, demand remained resilient across soft drinks and value-added prepared foods. Japanese beverage formulators specify high-clarity polyglycerol-ester emulsified apocarotenal liquids to prevent ring formation in hot-vended PET bottles.
Key takeaway: In Japan, high-clarity hot-vend beverage emulsions and premium deep-orange poultry egg-yolk feed rations are forecast to maintain a 3.9% CAGR.
Full report country CAGRs cover: North America; Latin America; Western Europe; Eastern Europe; East Asia; South Asia and Pacific; Middle East and Africa.
Who are the notable companies in the Apocarotenal Market?
dsm-firmenich, BASF, Allied Biotech Corporation, Divi's Laboratories Limited, Oterra, Sensient Technologies Corporation, and Givaudan SA are the notable companies in the apocarotenal market.
Competitive structure in the apocarotenal industry divides primary C30 chemical synthesis leaders, specialty carotenoid microencapsulation formulators, and global natural color and flavor integration houses. Primary producers dsm-firmenich and BASF operate large-scale Wittig synthesis and beadlet towers, while Divi's Laboratories Limited and Allied Biotech Corporation supply backward-integrated oil suspensions and CWD powders. Oterra, and Sensient Technologies Corporation compete in high-stability emulsions. Givaudan SA deliver application-specific color conversion systems.
- Primary C30 Carotenoid Synthesis and Beadlet Leaders: dsm-firmenich and BASF as well as Allied Biotech Corporation and Divi's Laboratories Limited manufacture bulk beta-apo-8'-carotenal crystals, 20% oil suspensions, and spray-dried CWD beadlets.
- Specialty Natural Color and Microencapsulation Formulators: Oterra, and Sensient Technologies Corporation engineer light-stable emulsions and gelatin-free starch matrices for synthetic-dye replacement.
- Integrated Taste and Color Biosolutions Houses: Givaudan SA combine natural reddish-orange coloring systems with flavor modulation and dairy matrix stabilization.
Competitive Benchmarking: Apocarotenal Market
Table 8: Competitive Benchmarking for the Apocarotenal Market (qualitative capability ratings), 2026
| Company | C30 Synthesis & Extraction | Microencapsulation Tech | Azo-Dye Replacement Fit | Geographic Reach |
|---|---|---|---|---|
| dsm-firmenich | High | High | High | Global Carophyll and Apocarotenal network across Europe, Americas, and Asia |
| BASF | High | High | High | Global Lucantin C30 carotenoid synthesis and dispersion plants |
| Allied Biotech Corporation | High | High | High | Taiwan synthesis hub supplying global Altratene E160e suspensions and powders |
| Divi's Laboratories Limited | High | High | High | India integrated API and carotenoid beadlet manufacturing exporting to 100+ nations |
| Oterra | Medium | High | High | Global natural color house converting U.S. and EU dairy and beverage accounts |
| Sensient Technologies Corporation | Medium | High | High | Global high-load natural color dispersions; Color Group revenue up 18.1% in Q3 2026 |
| Givaudan SA | Medium | High | High | Global Taste & Wellbeing natural colors and dairy formulation centers |
Key Developments in the Apocarotenal Market
- In September 2025, BASF SE completed the sale of its Food and Health Performance Ingredients business to Louis Dreyfus Company (LDC). The transaction excluded vitamins and carotenoids, which BASF confirmed it would retain as the strategic core of its Nutrition and Health division, reinforcing its role as a supplier of carotenoid colorants for human and animal nutrition markets [22].
- In February 2026, dsm-firmenich AG announced an agreement to divest its Animal Nutrition and Health business to CVC Capital Partners for an enterprise value of approximately €2.2 billion. The divested businessincludes vitamins, carotenoids, and aroma ingredients supplied to global poultry, aquaculture, and livestock markets, and is expected to operate as two independent companies upon completion [23]
Key Players in the Apocarotenal Market
Primary C30 Carotenoid Synthesis and Beadlet Leaders
- dsm-firmenich
- BASF
- Allied Biotech Corporation
- Divi's Laboratories Limited
Specialty Natural Color and Microencapsulation Formulators
- Oterra
- Sensient Technologies Corporation
- Integrated Taste, Color and Biosolutions Houses
Apocarotenal Market - Report Scope
Table 9: Report Scope for the Apocarotenal Market (coverage fields and definitions), 2026 to 2036
| Coverage field | Report scope |
|---|---|
| Market breakdown | Color Formulation; Regulatory Grade; Commercial End-Use; Production Pathway; Distribution Channel |
| Quantitative Units | USD Million |
| Market Definition | Encompasses global commercial sales of beta-apo-8'-carotenal (C30H40O, INS 160e, CAS 1107-26-2) supplied as 20% oil suspensions, cold-water dispersible (CWD) powders, encapsulated beadlets, and emulsified liquid concentrates for food, beverage, animal feed, pharmaceutical, and cosmetic coloring. Category Scope Note: Excludes C40 beta-carotene (E160a), astaxanthin, canthaxanthin, and beta-apo-8'-carotenoic acid ethyl ester (E160f). |
| Regions Covered | North America; Latin America; Western Europe; Eastern Europe; East Asia; South Asia and Pacific; Middle East and Africa |
| Countries Covered | India, China, Germany, United States, Netherlands, Spain, France, Japan, and additional countries in the full report |
| Key Companies Covered | dsm-firmenich, BASF, Allied Biotech Corporation, Divi's Laboratories Limited,Oterra, Sensient Technologies Corporation, Givaudan SA |
| Forecast Period | 2026 to 2036 |
| Approach | Primary and secondary research with top-down and bottom-up volume-to-value triangulation. |
Apocarotenal Market - Research Methodology
Table 10: Research Methodology for the Apocarotenal Market (research methods and approach), 2026 edition
| Method | Approach |
|---|---|
| Primary Research | Structured interviews with carotenoid synthesis directors, microencapsulation chemists, processed cheese procurement managers, and poultry premix nutritionists to validate ppm dosing and ASP realizations. |
| Secondary Research | Evaluation of Joint FAO/WHO JECFA toxicological monographs, Codex Alimentarius GSFA maximum level tables, U.S. FDA 21 CFR 73.90 dockets, USDA FAS GAIN reports, and corporate financial filings. |
| Market Sizing and Forecasting | Top-down food colorant and feed carotenoid baselines reconciled against bottom-up shipment tonnage of 20% oil suspensions and 10% CWD powders from 2026 to 2036. |
| Country Forecasting Model | Country-level econometric models weight synthetic azo-dye replacement schedules, processed cheese and beverage output, and commercial laying-hen feed production across eight national markets. |
| Operational Benchmark Traceability | Dosing and regulatory indicators in Tables 2, 3, and 4 trace to Codex GSFA INS 160e category limits, JECFA 0 to 0.3 mg/kg bw ADI evaluations, and FDA 15 mg/lb food standards. |
| Data Triangulation and Validation | Valuation figures isolate C30 beta-apo-8'-carotenal preparations while excluding C40 beta-carotene, lycopene, lutein, and paprika oleoresin revenues. |
Apocarotenal Market by Segments
Apocarotenal Market segmented by Color Formulation:
- Oil Suspension 20%
- Cold Water Dispersible CWD Powder
- Encapsulated Beadlets
- Emulsified Liquid Concentrates
Apocarotenal Market segmented by Regulatory Grade:
- Food Grade Colorant E160e
- Animal Feed Carotenoid Premix
- Pharmaceutical and Nutraceutical Excipient Grade
- Cosmetic and Personal Care Grade
Apocarotenal Market segmented by Commercial End-Use:
- Processed Cheese and Dairy Natural Reddish-Orange Coloring
- Salad Dressings and Margarines
- Citrus Beverages and Soft Drinks
- Poultry Egg Yolk Pigmentation
- Confectionery and Bakery Glazes
Apocarotenal Market segmented by Production Pathway:
- Chemical Wittig and C30 Synthesis
- Botanical and Citrus Peel Extraction
- Microbial and Algal Fermentation
- Bio-Catalytic Carotenoid Cleavage
Apocarotenal Market segmented by Distribution Channel:
- Direct B2B Industrial Supply
- Specialty Chemical and Ingredient Distributors
- Feed and Premix Blenders
- Online B2B Ingredient Portals
Apocarotenal Market by Region
- North America
- United States
- Canada
- Latin America
- Brazil
- Mexico
- Argentina
- Chile
- Western Europe
- Germany
- France
- United Kingdom
- Italy
- Spain
- Benelux
- Nordics
- Eastern Europe
- Poland
- Czech Republic
- Romania
- Hungary
- East Asia
- China
- Japan
- South Korea
- South Asia and Pacific
- India
- ASEAN
- Australia and New Zealand
- Middle East and Africa
- GCC Countries
- South Africa
- Türkiye
- Israel
Research Sources and Bibliography
- [1] U.S. Food and Drug Administration. (2026, February 5). FDA Takes New Approach to No Artificial Colors Claims. U.S. Department of Health and Human Services.
- [2] Food and Agriculture Organization of the United Nations. (2026, July 8). Summary Report of the 102nd JECFA Meeting on Food Additives Including Beta-Apo-8-Carotenal. Joint FAO/WHO Expert Committee on Food Additives.
- [3] Sensient Technologies Corporation. (2026, October 30). Sensient Technologies Corporation Reports Financial Results for the Third Quarter Ended September 30 2026. Sensient Technologies Investor Relations.
- [4] Lycored. (2025, July 14). Lycored Unveils Superstable Color Emulsions at IFT FIRST for Nature-Based Food Colors. Lycored Corporate Newsroom.
- [5] World Health Organization. (2025, March 12). Evaluations of the Joint FAO/WHO Expert Committee on Food Additives for Beta-Apo-8-Carotenal INS 160e. WHO JECFA Chemical Database.
- [6] Kowalska, M., & Janas, S. (2025, November 9). Innovative Microencapsulation Techniques of Bioactive Compounds and Carotenoid Stability in Food Properties. Applied Sciences, 15(22), 11908 (MDPI).
- [7] U.S. Food and Drug Administration. (2026, August 14). Regulatory Status of Color Additives Exempt from Certification Including Beta-Apo-8-Carotenal. FDA Color Additive Inventories.
- [8] Oterra A/S. (2026, January 20). Natural Color Conversion and Replacement of Artificial Dyes in Dairy and Beverage Applications. Oterra Technical Insights.
- [9] Divi's Laboratories Limited. (2026, July 15). Sustainability Report 2025-26: 20 Years of Divi's Nutraceuticals Carotenoid Ingredients and Formulations. Divi's Laboratories Corporate Filings.
- [10] Sensient Technologies Corporation. (2026, April 15). Sensient Sustainability Report 2025: Decarbonization and Concentrated Color Load in Natural Color Conversion. Sensient Corporate Sustainability.
- [11] U.S. Food and Drug Administration. (2026, October 16). Tracking Food Industry Pledges to Remove Petroleum-Based Food Dyes. FDA Human Foods Program.
- [12] Ceylan, Z., & Meral, R. (2025, December 30). Molecular Insights into Bioactive Interactions Within Protein and Polysaccharide-Carotenoid Colloidal Systems. Foods, 15(1), 112 (MDPI).
- [13] Zhang, L., & Chen, H. (2026, January 12). Nanoencapsulation of Nutraceuticals: Enhancing Stability and Bioavailability of Carotenoids. Frontiers in Nutrition, 12, 1746176.
- [14] USDA Foreign Agricultural Service. (2026, March 27). India: Food Processing Ingredients Annual. U.S. Department of Agriculture GAIN Report IN2026-0016.
- [15] USDA Foreign Agricultural Service. (2026, April 1). China: Food Processing Ingredients Annual. U.S. Department of Agriculture GAIN Report CH2026-0042.
- [16] USDA Foreign Agricultural Service. (2026, March 30). Germany: Food Processing Ingredients Annual. U.S. Department of Agriculture GAIN Report GM2026-0007.
- [17] U.S. Food and Drug Administration. (2025, December 16). Summary of Color Additives for Use in the United States in Foods, Drugs, Cosmetics, and Medical Devices. FDA Office of Food Additive Safety.
- [18] USDA Foreign Agricultural Service. (2026, April 2). Netherlands: Food Processing Ingredients Annual. U.S. Department of Agriculture GAIN Report NL2026-0006.
- [19] USDA Foreign Agricultural Service. (2026, March 31). Spain: Food Processing Ingredients Annual. U.S. Department of Agriculture GAIN Report SP2026-0003.
- [20] USDA Foreign Agricultural Service. (2026, April 3). France: Food Processing Ingredients Annual. U.S. Department of Agriculture GAIN Report FR2026-0003.
- [21] USDA Foreign Agricultural Service. (2026, April 1). Japan: Food Processing Ingredients Annual. U.S. Department of Agriculture GAIN Report JA2026-0012.
- [22] BASF SE. (2025). BASF and Louis Dreyfus Company Complete Sale and Purchase Transaction for BASF’s Food and Health Performance Ingredients Business (Press release P-25-188, 30 September 2025).
https://www.basf.com/global/en/media/news-releases/2025/09/p-25-188 - [23] dsm-firmenich AG. (2026). Integrated Annual Report 2025 — Events After the Balance Sheet Date. https://annualreport.dsm-firmenich.com/2025/financial-statements/consolidated-financial-statements/notes/events-after-the-balance-sheet-date.html
- [24] dsm-firmenich. (2026, October 26). World Nutrition Forum 2026 Advances Science Innovation in Animal Nutrition Carotenoids and Premix Solutions. dsm-firmenich Animal Nutrition and Health Press Releases.
This bibliography is provided for reader reference and is not exhaustive. The full report contains the complete reference list and detailed citations.
This Report Answers
- How large is the apocarotenal market in 2026 and what is forecast for 2036?
- Which synthetic dye phase-out and processed cheese coloring pressures support demand for apocarotenal?
- Why does Oil Suspension 20% lead the color formulation category?
- Why does Food Grade Colorant E160e lead the regulatory grade category?
- How do growth rates differ across India and China compared with Germany and the United States?
- Which leading companies manufacture primary C30 apocarotenal crystals versus specialty emulsions?
- What limits apocarotenal dosage levels or causes oxidative ring fading in beverages?
- What should dairy and beverage formulators evaluate before replacing Yellow 6 with E160e?
Table of Content
- Key Takeaways
- Market Size and CAGR
- Top Growth Driver
- Fastest Growing Segment
- Leading Region
- Key Companies
- Emerging Opportunities
- Executive Summary
- Global Market Outlook
- Demand-side Trends
- Supply-side Trends
- Technology Roadmap Analysis
- Analysis and Recommendations
- Analyst Perspective (What is happening? Why now? What should investors know?)
- Key Questions Answered
- How large is the market?
- What is the CAGR?
- What are key trends?
- Which region dominates?
- Who are the leaders?
Read More...
- Market Overview
- Market Coverage / Taxonomy
- Market Definition / Scope / Limitations
- Research Methodology
- Chapter Orientation
- Analytical Lens and Working Hypotheses
- Market Structure, Signals, and Trend Drivers
- Benchmarking and Cross-market Comparability
- Market Sizing, Forecasting, and Opportunity Mapping
- Research Design and Evidence Framework
- Desk Research Programme (Secondary Evidence)
- Expert Input and Fieldwork (Primary Evidence)
- Tooling, Models, and Reference Databases
- Data Engineering and Model Build
- Quality Assurance and Audit Trail
- Market Background
- Market Dynamics (Drivers, Restraints, Opportunity, Trends)
- Scenario Forecast (Optimistic, Likely, Conservative)
- Impact Analysis
- AI Impact
- Sustainability Impact
- Regulatory Impact
- Technology Impact
- Consumer / Buyer Analysis
- Purchase Drivers
- Adoption Barriers
- Buyer Journey
- Opportunity Map Analysis
- Product Life Cycle Analysis
- Supply Chain Analysis
- Investment Feasibility Matrix
- Value Chain Analysis
- PESTLE and Porter's Analysis
- Regulatory Landscape
- Regional Parent Market Outlook
- Production and Consumption Statistics
- Import and Export Statistics
- Global Market Analysis and Forecast, 2021 to 2036
- Historical Market Size Value (USD Million) Analysis, 2021 to 2025
- Current and Future Market Size Value (USD Million) Projections, 2026 to 2036
- Y-o-Y Growth Trend Analysis
- Absolute $ Opportunity Analysis
- Global Market Pricing Analysis, 2021 to 2036
- Global Market Analysis and Forecast, By Color Formulation, 2021 to 2036
- Introduction / Key Findings
- Historical Market Size Value (USD Million) Analysis By Color Formulation, 2021 to 2025
- Current and Future Market Size Value (USD Million) Analysis and Forecast By Color Formulation, 2026 to 2036
- Oil Suspension 20%
- Cold Water Dispersible CWD Powder
- Encapsulated Beadlets
- Emulsified Liquid Concentrates
- Y-o-Y Growth Trend Analysis By Color Formulation, 2021 to 2025
- Absolute $ Opportunity Analysis By Color Formulation, 2026 to 2036
- Global Market Analysis and Forecast, By Regulatory Grade, 2021 to 2036
- Introduction / Key Findings
- Historical Market Size Value (USD Million) Analysis By Regulatory Grade, 2021 to 2025
- Current and Future Market Size Value (USD Million) Analysis and Forecast By Regulatory Grade, 2026 to 2036
- Food Grade Colorant E160e
- Animal Feed Carotenoid Premix
- Pharmaceutical and Nutraceutical Excipient Grade
- Cosmetic and Personal Care Grade
- Y-o-Y Growth Trend Analysis By Regulatory Grade, 2021 to 2025
- Absolute $ Opportunity Analysis By Regulatory Grade, 2026 to 2036
- Global Market Analysis and Forecast, By Commercial End-Use, 2021 to 2036
- Introduction / Key Findings
- Historical Market Size Value (USD Million) Analysis By Commercial End-Use, 2021 to 2025
- Current and Future Market Size Value (USD Million) Analysis and Forecast By Commercial End-Use, 2026 to 2036
- Processed Cheese and Dairy Natural Reddish-Orange Coloring
- Salad Dressings and Margarines
- Citrus Beverages and Soft Drinks
- Poultry Egg Yolk Pigmentation
- Confectionery and Bakery Glazes
- Y-o-Y Growth Trend Analysis By Commercial End-Use, 2021 to 2025
- Absolute $ Opportunity Analysis By Commercial End-Use, 2026 to 2036
- Global Market Analysis and Forecast, By Production Pathway, 2021 to 2036
- Introduction / Key Findings
- Historical Market Size Value (USD Million) Analysis By Production Pathway, 2021 to 2025
- Current and Future Market Size Value (USD Million) Analysis and Forecast By Production Pathway, 2026 to 2036
- Chemical Wittig and C30 Synthesis
- Botanical and Citrus Peel Extraction
- Microbial and Algal Fermentation
- Bio-Catalytic Carotenoid Cleavage
- Y-o-Y Growth Trend Analysis By Production Pathway, 2021 to 2025
- Absolute $ Opportunity Analysis By Production Pathway, 2026 to 2036
- Global Market Analysis and Forecast, By Distribution Channel, 2021 to 2036
- Introduction / Key Findings
- Historical Market Size Value (USD Million) Analysis By Distribution Channel, 2021 to 2025
- Current and Future Market Size Value (USD Million) Analysis and Forecast By Distribution Channel, 2026 to 2036
- Direct B2B Industrial Supply
- Specialty Chemical and Ingredient Distributors
- Feed and Premix Blenders
- Online B2B Ingredient Portals
- Y-o-Y Growth Trend Analysis By Distribution Channel, 2021 to 2025
- Absolute $ Opportunity Analysis By Distribution Channel, 2026 to 2036
- Global Market Analysis and Forecast, By Region, 2021 to 2036
- Introduction
- Historical Market Size Value (USD Million) Analysis By Region, 2021 to 2025
- Current Market Size Value (USD Million) Analysis and Forecast By Region, 2026 to 2036
- North America
- Latin America
- Western Europe
- Eastern Europe
- East Asia
- South Asia and Pacific
- Middle East and Africa
- Market Attractiveness Analysis By Region
- North America Market Analysis and Forecast, By Country, 2021 to 2036
- Historical Market Size Value (USD Million) Trend Analysis By Market Taxonomy, 2021 to 2025
- Market Size Value (USD Million) Forecast By Market Taxonomy, 2026 to 2036
- By Country
- United States
- Canada
- By Color Formulation
- By Regulatory Grade
- By Commercial End-Use
- By Production Pathway
- By Distribution Channel
- By Country
- Market Attractiveness Analysis
- By Country
- By Color Formulation
- By Regulatory Grade
- By Commercial End-Use
- By Production Pathway
- By Distribution Channel
- Key Takeaways
- Latin America Market Analysis and Forecast, By Country
- Historical Market Size Value (USD Million) Trend Analysis By Market Taxonomy, 2021 to 2025
- Market Size Value (USD Million) Forecast By Market Taxonomy, 2026 to 2036
- By Country
- Brazil
- Mexico
- Argentina
- Chile
- By Color Formulation
- By Regulatory Grade
- By Commercial End-Use
- By Production Pathway
- By Distribution Channel
- By Country
- Market Attractiveness Analysis
- By Country
- By Color Formulation
- By Regulatory Grade
- By Commercial End-Use
- By Production Pathway
- By Distribution Channel
- Key Takeaways
- Western Europe Market Analysis and Forecast, By Country
- Historical Market Size Value (USD Million) Trend Analysis By Market Taxonomy, 2021 to 2025
- Market Size Value (USD Million) Forecast By Market Taxonomy, 2026 to 2036
- By Country
- Germany
- France
- United Kingdom
- Italy
- Spain
- Benelux
- Nordics
- By Color Formulation
- By Regulatory Grade
- By Commercial End-Use
- By Production Pathway
- By Distribution Channel
- By Country
- Market Attractiveness Analysis
- By Country
- By Color Formulation
- By Regulatory Grade
- By Commercial End-Use
- By Production Pathway
- By Distribution Channel
- Key Takeaways
- Eastern Europe Market Analysis and Forecast, By Country
- Historical Market Size Value (USD Million) Trend Analysis By Market Taxonomy, 2021 to 2025
- Market Size Value (USD Million) Forecast By Market Taxonomy, 2026 to 2036
- By Country
- Poland
- Czech Republic
- Romania
- Hungary
- By Color Formulation
- By Regulatory Grade
- By Commercial End-Use
- By Production Pathway
- By Distribution Channel
- By Country
- Market Attractiveness Analysis
- By Country
- By Color Formulation
- By Regulatory Grade
- By Commercial End-Use
- By Production Pathway
- By Distribution Channel
- Key Takeaways
- East Asia Market Analysis and Forecast, By Country
- Historical Market Size Value (USD Million) Trend Analysis By Market Taxonomy, 2021 to 2025
- Market Size Value (USD Million) Forecast By Market Taxonomy, 2026 to 2036
- By Country
- China
- Japan
- South Korea
- By Color Formulation
- By Regulatory Grade
- By Commercial End-Use
- By Production Pathway
- By Distribution Channel
- By Country
- Market Attractiveness Analysis
- By Country
- By Color Formulation
- By Regulatory Grade
- By Commercial End-Use
- By Production Pathway
- By Distribution Channel
- Key Takeaways
- South Asia and Pacific Market Analysis and Forecast, By Country
- Historical Market Size Value (USD Million) Trend Analysis By Market Taxonomy, 2021 to 2025
- Market Size Value (USD Million) Forecast By Market Taxonomy, 2026 to 2036
- By Country
- India
- ASEAN
- Australia and New Zealand
- By Color Formulation
- By Regulatory Grade
- By Commercial End-Use
- By Production Pathway
- By Distribution Channel
- By Country
- Market Attractiveness Analysis
- By Country
- By Color Formulation
- By Regulatory Grade
- By Commercial End-Use
- By Production Pathway
- By Distribution Channel
- Key Takeaways
- Middle East and Africa Market Analysis and Forecast, By Country
- Historical Market Size Value (USD Million) Trend Analysis By Market Taxonomy, 2021 to 2025
- Market Size Value (USD Million) Forecast By Market Taxonomy, 2026 to 2036
- By Country
- GCC Countries
- South Africa
- Türkiye
- Israel
- By Color Formulation
- By Regulatory Grade
- By Commercial End-Use
- By Production Pathway
- By Distribution Channel
- By Country
- Market Attractiveness Analysis
- By Country
- By Color Formulation
- By Regulatory Grade
- By Commercial End-Use
- By Production Pathway
- By Distribution Channel
- Key Takeaways
- Key Countries Market Analysis
- United States
- Pricing Analysis
- Market Share Analysis, 2025
- By Color Formulation
- By Regulatory Grade
- By Commercial End-Use
- By Production Pathway
- By Distribution Channel
- Canada
- Pricing Analysis
- Market Share Analysis, 2025
- By Color Formulation
- By Regulatory Grade
- By Commercial End-Use
- By Production Pathway
- By Distribution Channel
- Mexico
- Pricing Analysis
- Market Share Analysis, 2025
- By Color Formulation
- By Regulatory Grade
- By Commercial End-Use
- By Production Pathway
- By Distribution Channel
- Brazil
- Pricing Analysis
- Market Share Analysis, 2025
- By Color Formulation
- By Regulatory Grade
- By Commercial End-Use
- By Production Pathway
- By Distribution Channel
- Chile
- Pricing Analysis
- Market Share Analysis, 2025
- By Color Formulation
- By Regulatory Grade
- By Commercial End-Use
- By Production Pathway
- By Distribution Channel
- Germany
- Pricing Analysis
- Market Share Analysis, 2025
- By Color Formulation
- By Regulatory Grade
- By Commercial End-Use
- By Production Pathway
- By Distribution Channel
- United Kingdom
- Pricing Analysis
- Market Share Analysis, 2025
- By Color Formulation
- By Regulatory Grade
- By Commercial End-Use
- By Production Pathway
- By Distribution Channel
- Italy
- Pricing Analysis
- Market Share Analysis, 2025
- By Color Formulation
- By Regulatory Grade
- By Commercial End-Use
- By Production Pathway
- By Distribution Channel
- Spain
- Pricing Analysis
- Market Share Analysis, 2025
- By Color Formulation
- By Regulatory Grade
- By Commercial End-Use
- By Production Pathway
- By Distribution Channel
- France
- Pricing Analysis
- Market Share Analysis, 2025
- By Color Formulation
- By Regulatory Grade
- By Commercial End-Use
- By Production Pathway
- By Distribution Channel
- India
- Pricing Analysis
- Market Share Analysis, 2025
- By Color Formulation
- By Regulatory Grade
- By Commercial End-Use
- By Production Pathway
- By Distribution Channel
- ASEAN
- Pricing Analysis
- Market Share Analysis, 2025
- By Color Formulation
- By Regulatory Grade
- By Commercial End-Use
- By Production Pathway
- By Distribution Channel
- Australia and New Zealand
- Pricing Analysis
- Market Share Analysis, 2025
- By Color Formulation
- By Regulatory Grade
- By Commercial End-Use
- By Production Pathway
- By Distribution Channel
- China
- Pricing Analysis
- Market Share Analysis, 2025
- By Color Formulation
- By Regulatory Grade
- By Commercial End-Use
- By Production Pathway
- By Distribution Channel
- Japan
- Pricing Analysis
- Market Share Analysis, 2025
- By Color Formulation
- By Regulatory Grade
- By Commercial End-Use
- By Production Pathway
- By Distribution Channel
- South Korea
- Pricing Analysis
- Market Share Analysis, 2025
- By Color Formulation
- By Regulatory Grade
- By Commercial End-Use
- By Production Pathway
- By Distribution Channel
- Poland
- Pricing Analysis
- Market Share Analysis, 2025
- By Color Formulation
- By Regulatory Grade
- By Commercial End-Use
- By Production Pathway
- By Distribution Channel
- Hungary
- Pricing Analysis
- Market Share Analysis, 2025
- By Color Formulation
- By Regulatory Grade
- By Commercial End-Use
- By Production Pathway
- By Distribution Channel
- Türkiye
- Pricing Analysis
- Market Share Analysis, 2025
- By Color Formulation
- By Regulatory Grade
- By Commercial End-Use
- By Production Pathway
- By Distribution Channel
- South Africa
- Pricing Analysis
- Market Share Analysis, 2025
- By Color Formulation
- By Regulatory Grade
- By Commercial End-Use
- By Production Pathway
- By Distribution Channel
- Netherlands
- Pricing Analysis
- Market Share Analysis, 2025
- By Color Formulation
- By Regulatory Grade
- By Commercial End-Use
- By Production Pathway
- By Distribution Channel
- United States
- Market Structure Analysis
- Competition Dashboard
- Competition Benchmarking
- Market Share Analysis of Top Players
- By Regional
- By Color Formulation
- By Regulatory Grade
- By Commercial End-Use
- By Production Pathway
- By Distribution Channel
- Emerging Startups
- Innovation Benchmarking
- Competition Analysis
- Competition Deep Dive
- dsm-firmenich
- Overview
- Product Portfolio
- Profitability by Market Segments
- Sales Footprint
- Strategy Overview
- Marketing Strategy
- Product Strategy
- Channel Strategy
- BASF
- Allied Biotech Corporation
- Divi's Laboratories Limited
- Lycored
- Oterra
- Sensient Technologies Corporation
- Givaudan SA
- Integrated Taste, Color and Biosolutions Houses
- dsm-firmenich
- Case Studies
- Success Stories
- Recent Developments
- Competition Deep Dive
- Assumptions & Acronyms Used
List of Tables
- Table 1: Global Market Value (USD Million) Forecast by Region, 2021 to 2036
- Table 2: Global Market Value (USD Million) Forecast by Color Formulation, 2021 to 2036
- Table 3: Global Market Value (USD Million) Forecast by Regulatory Grade, 2021 to 2036
- Table 4: Global Market Value (USD Million) Forecast by Commercial End-Use, 2021 to 2036
- Table 5: Global Market Value (USD Million) Forecast by Production Pathway, 2021 to 2036
- Table 6: Global Market Value (USD Million) Forecast by Distribution Channel, 2021 to 2036
- Table 7: North America Market Value (USD Million) Forecast by Country, 2021 to 2036
- Table 8: North America Market Value (USD Million) Forecast by Color Formulation, 2021 to 2036
- Table 9: North America Market Value (USD Million) Forecast by Regulatory Grade, 2021 to 2036
- Table 10: North America Market Value (USD Million) Forecast by Commercial End-Use, 2021 to 2036
- Table 11: North America Market Value (USD Million) Forecast by Production Pathway, 2021 to 2036
- Table 12: North America Market Value (USD Million) Forecast by Distribution Channel, 2021 to 2036
- Table 13: Latin America Market Value (USD Million) Forecast by Country, 2021 to 2036
- Table 14: Latin America Market Value (USD Million) Forecast by Color Formulation, 2021 to 2036
- Table 15: Latin America Market Value (USD Million) Forecast by Regulatory Grade, 2021 to 2036
- Table 16: Latin America Market Value (USD Million) Forecast by Commercial End-Use, 2021 to 2036
- Table 17: Latin America Market Value (USD Million) Forecast by Production Pathway, 2021 to 2036
- Table 18: Latin America Market Value (USD Million) Forecast by Distribution Channel, 2021 to 2036
- Table 19: Western Europe Market Value (USD Million) Forecast by Country, 2021 to 2036
- Table 20: Western Europe Market Value (USD Million) Forecast by Color Formulation, 2021 to 2036
- Table 21: Western Europe Market Value (USD Million) Forecast by Regulatory Grade, 2021 to 2036
- Table 22: Western Europe Market Value (USD Million) Forecast by Commercial End-Use, 2021 to 2036
- Table 23: Western Europe Market Value (USD Million) Forecast by Production Pathway, 2021 to 2036
- Table 24: Western Europe Market Value (USD Million) Forecast by Distribution Channel, 2021 to 2036
- Table 25: Eastern Europe Market Value (USD Million) Forecast by Country, 2021 to 2036
- Table 26: Eastern Europe Market Value (USD Million) Forecast by Color Formulation, 2021 to 2036
- Table 27: Eastern Europe Market Value (USD Million) Forecast by Regulatory Grade, 2021 to 2036
- Table 28: Eastern Europe Market Value (USD Million) Forecast by Commercial End-Use, 2021 to 2036
- Table 29: Eastern Europe Market Value (USD Million) Forecast by Production Pathway, 2021 to 2036
- Table 30: Eastern Europe Market Value (USD Million) Forecast by Distribution Channel, 2021 to 2036
- Table 31: East Asia Market Value (USD Million) Forecast by Country, 2021 to 2036
- Table 32: East Asia Market Value (USD Million) Forecast by Color Formulation, 2021 to 2036
- Table 33: East Asia Market Value (USD Million) Forecast by Regulatory Grade, 2021 to 2036
- Table 34: East Asia Market Value (USD Million) Forecast by Commercial End-Use, 2021 to 2036
- Table 35: East Asia Market Value (USD Million) Forecast by Production Pathway, 2021 to 2036
- Table 36: East Asia Market Value (USD Million) Forecast by Distribution Channel, 2021 to 2036
- Table 37: South Asia and Pacific Market Value (USD Million) Forecast by Country, 2021 to 2036
- Table 38: South Asia and Pacific Market Value (USD Million) Forecast by Color Formulation, 2021 to 2036
- Table 39: South Asia and Pacific Market Value (USD Million) Forecast by Regulatory Grade, 2021 to 2036
- Table 40: South Asia and Pacific Market Value (USD Million) Forecast by Commercial End-Use, 2021 to 2036
- Table 41: South Asia and Pacific Market Value (USD Million) Forecast by Production Pathway, 2021 to 2036
- Table 42: South Asia and Pacific Market Value (USD Million) Forecast by Distribution Channel, 2021 to 2036
- Table 43: Middle East and Africa Market Value (USD Million) Forecast by Country, 2021 to 2036
- Table 44: Middle East and Africa Market Value (USD Million) Forecast by Color Formulation, 2021 to 2036
- Table 45: Middle East and Africa Market Value (USD Million) Forecast by Regulatory Grade, 2021 to 2036
- Table 46: Middle East and Africa Market Value (USD Million) Forecast by Commercial End-Use, 2021 to 2036
- Table 47: Middle East and Africa Market Value (USD Million) Forecast by Production Pathway, 2021 to 2036
- Table 48: Middle East and Africa Market Value (USD Million) Forecast by Distribution Channel, 2021 to 2036
List of Figures
- Figure 1: Global Market Pricing Analysis
- Figure 2: Global Market Value (USD Million) Forecast 2021-2036
- Figure 3: Global Market Value Share and BPS Analysis by Color Formulation, 2026 and 2036
- Figure 4: Global Market Y-o-Y Growth Comparison by Color Formulation, 2026-2036
- Figure 5: Global Market Attractiveness Analysis by Color Formulation
- Figure 6: Global Market Value Share and BPS Analysis by Regulatory Grade, 2026 and 2036
- Figure 7: Global Market Y-o-Y Growth Comparison by Regulatory Grade, 2026-2036
- Figure 8: Global Market Attractiveness Analysis by Regulatory Grade
- Figure 9: Global Market Value Share and BPS Analysis by Commercial End-Use, 2026 and 2036
- Figure 10: Global Market Y-o-Y Growth Comparison by Commercial End-Use, 2026-2036
- Figure 11: Global Market Attractiveness Analysis by Commercial End-Use
- Figure 12: Global Market Value Share and BPS Analysis by Production Pathway, 2026 and 2036
- Figure 13: Global Market Y-o-Y Growth Comparison by Production Pathway, 2026-2036
- Figure 14: Global Market Attractiveness Analysis by Production Pathway
- Figure 15: Global Market Value Share and BPS Analysis by Distribution Channel, 2026 and 2036
- Figure 16: Global Market Y-o-Y Growth Comparison by Distribution Channel, 2026-2036
- Figure 17: Global Market Attractiveness Analysis by Distribution Channel
- Figure 18: Global Market Value (USD Million) Share and BPS Analysis by Region, 2026 and 2036
- Figure 19: Global Market Y-o-Y Growth Comparison by Region, 2026-2036
- Figure 20: Global Market Attractiveness Analysis by Region
- Figure 21: North America Market Incremental Dollar Opportunity, 2026-2036
- Figure 22: Latin America Market Incremental Dollar Opportunity, 2026-2036
- Figure 23: Western Europe Market Incremental Dollar Opportunity, 2026-2036
- Figure 24: Eastern Europe Market Incremental Dollar Opportunity, 2026-2036
- Figure 25: East Asia Market Incremental Dollar Opportunity, 2026-2036
- Figure 26: South Asia and Pacific Market Incremental Dollar Opportunity, 2026-2036
- Figure 27: Middle East and Africa Market Incremental Dollar Opportunity, 2026-2036
- Figure 28: North America Market Value Share and BPS Analysis by Country, 2026 and 2036
- Figure 29: North America Market Value Share and BPS Analysis by Color Formulation, 2026 and 2036
- Figure 30: North America Market Y-o-Y Growth Comparison by Color Formulation, 2026-2036
- Figure 31: North America Market Attractiveness Analysis by Color Formulation
- Figure 32: North America Market Value Share and BPS Analysis by Regulatory Grade, 2026 and 2036
- Figure 33: North America Market Y-o-Y Growth Comparison by Regulatory Grade, 2026-2036
- Figure 34: North America Market Attractiveness Analysis by Regulatory Grade
- Figure 35: North America Market Value Share and BPS Analysis by Commercial End-Use, 2026 and 2036
- Figure 36: North America Market Y-o-Y Growth Comparison by Commercial End-Use, 2026-2036
- Figure 37: North America Market Attractiveness Analysis by Commercial End-Use
- Figure 38: North America Market Value Share and BPS Analysis by Production Pathway, 2026 and 2036
- Figure 39: North America Market Y-o-Y Growth Comparison by Production Pathway, 2026-2036
- Figure 40: North America Market Attractiveness Analysis by Production Pathway
- Figure 41: North America Market Value Share and BPS Analysis by Distribution Channel, 2026 and 2036
- Figure 42: North America Market Y-o-Y Growth Comparison by Distribution Channel, 2026-2036
- Figure 43: North America Market Attractiveness Analysis by Distribution Channel
- Figure 44: Latin America Market Value Share and BPS Analysis by Country, 2026 and 2036
- Figure 45: Latin America Market Value Share and BPS Analysis by Color Formulation, 2026 and 2036
- Figure 46: Latin America Market Y-o-Y Growth Comparison by Color Formulation, 2026-2036
- Figure 47: Latin America Market Attractiveness Analysis by Color Formulation
- Figure 48: Latin America Market Value Share and BPS Analysis by Regulatory Grade, 2026 and 2036
- Figure 49: Latin America Market Y-o-Y Growth Comparison by Regulatory Grade, 2026-2036
- Figure 50: Latin America Market Attractiveness Analysis by Regulatory Grade
- Figure 51: Latin America Market Value Share and BPS Analysis by Commercial End-Use, 2026 and 2036
- Figure 52: Latin America Market Y-o-Y Growth Comparison by Commercial End-Use, 2026-2036
- Figure 53: Latin America Market Attractiveness Analysis by Commercial End-Use
- Figure 54: Latin America Market Value Share and BPS Analysis by Production Pathway, 2026 and 2036
- Figure 55: Latin America Market Y-o-Y Growth Comparison by Production Pathway, 2026-2036
- Figure 56: Latin America Market Attractiveness Analysis by Production Pathway
- Figure 57: Latin America Market Value Share and BPS Analysis by Distribution Channel, 2026 and 2036
- Figure 58: Latin America Market Y-o-Y Growth Comparison by Distribution Channel, 2026-2036
- Figure 59: Latin America Market Attractiveness Analysis by Distribution Channel
- Figure 60: Western Europe Market Value Share and BPS Analysis by Country, 2026 and 2036
- Figure 61: Western Europe Market Value Share and BPS Analysis by Color Formulation, 2026 and 2036
- Figure 62: Western Europe Market Y-o-Y Growth Comparison by Color Formulation, 2026-2036
- Figure 63: Western Europe Market Attractiveness Analysis by Color Formulation
- Figure 64: Western Europe Market Value Share and BPS Analysis by Regulatory Grade, 2026 and 2036
- Figure 65: Western Europe Market Y-o-Y Growth Comparison by Regulatory Grade, 2026-2036
- Figure 66: Western Europe Market Attractiveness Analysis by Regulatory Grade
- Figure 67: Western Europe Market Value Share and BPS Analysis by Commercial End-Use, 2026 and 2036
- Figure 68: Western Europe Market Y-o-Y Growth Comparison by Commercial End-Use, 2026-2036
- Figure 69: Western Europe Market Attractiveness Analysis by Commercial End-Use
- Figure 70: Western Europe Market Value Share and BPS Analysis by Production Pathway, 2026 and 2036
- Figure 71: Western Europe Market Y-o-Y Growth Comparison by Production Pathway, 2026-2036
- Figure 72: Western Europe Market Attractiveness Analysis by Production Pathway
- Figure 73: Western Europe Market Value Share and BPS Analysis by Distribution Channel, 2026 and 2036
- Figure 74: Western Europe Market Y-o-Y Growth Comparison by Distribution Channel, 2026-2036
- Figure 75: Western Europe Market Attractiveness Analysis by Distribution Channel
- Figure 76: Eastern Europe Market Value Share and BPS Analysis by Country, 2026 and 2036
- Figure 77: Eastern Europe Market Value Share and BPS Analysis by Color Formulation, 2026 and 2036
- Figure 78: Eastern Europe Market Y-o-Y Growth Comparison by Color Formulation, 2026-2036
- Figure 79: Eastern Europe Market Attractiveness Analysis by Color Formulation
- Figure 80: Eastern Europe Market Value Share and BPS Analysis by Regulatory Grade, 2026 and 2036
- Figure 81: Eastern Europe Market Y-o-Y Growth Comparison by Regulatory Grade, 2026-2036
- Figure 82: Eastern Europe Market Attractiveness Analysis by Regulatory Grade
- Figure 83: Eastern Europe Market Value Share and BPS Analysis by Commercial End-Use, 2026 and 2036
- Figure 84: Eastern Europe Market Y-o-Y Growth Comparison by Commercial End-Use, 2026-2036
- Figure 85: Eastern Europe Market Attractiveness Analysis by Commercial End-Use
- Figure 86: Eastern Europe Market Value Share and BPS Analysis by Production Pathway, 2026 and 2036
- Figure 87: Eastern Europe Market Y-o-Y Growth Comparison by Production Pathway, 2026-2036
- Figure 88: Eastern Europe Market Attractiveness Analysis by Production Pathway
- Figure 89: Eastern Europe Market Value Share and BPS Analysis by Distribution Channel, 2026 and 2036
- Figure 90: Eastern Europe Market Y-o-Y Growth Comparison by Distribution Channel, 2026-2036
- Figure 91: Eastern Europe Market Attractiveness Analysis by Distribution Channel
- Figure 92: East Asia Market Value Share and BPS Analysis by Country, 2026 and 2036
- Figure 93: East Asia Market Value Share and BPS Analysis by Color Formulation, 2026 and 2036
- Figure 94: East Asia Market Y-o-Y Growth Comparison by Color Formulation, 2026-2036
- Figure 95: East Asia Market Attractiveness Analysis by Color Formulation
- Figure 96: East Asia Market Value Share and BPS Analysis by Regulatory Grade, 2026 and 2036
- Figure 97: East Asia Market Y-o-Y Growth Comparison by Regulatory Grade, 2026-2036
- Figure 98: East Asia Market Attractiveness Analysis by Regulatory Grade
- Figure 99: East Asia Market Value Share and BPS Analysis by Commercial End-Use, 2026 and 2036
- Figure 100: East Asia Market Y-o-Y Growth Comparison by Commercial End-Use, 2026-2036
- Figure 101: East Asia Market Attractiveness Analysis by Commercial End-Use
- Figure 102: East Asia Market Value Share and BPS Analysis by Production Pathway, 2026 and 2036
- Figure 103: East Asia Market Y-o-Y Growth Comparison by Production Pathway, 2026-2036
- Figure 104: East Asia Market Attractiveness Analysis by Production Pathway
- Figure 105: East Asia Market Value Share and BPS Analysis by Distribution Channel, 2026 and 2036
- Figure 106: East Asia Market Y-o-Y Growth Comparison by Distribution Channel, 2026-2036
- Figure 107: East Asia Market Attractiveness Analysis by Distribution Channel
- Figure 108: South Asia and Pacific Market Value Share and BPS Analysis by Country, 2026 and 2036
- Figure 109: South Asia and Pacific Market Value Share and BPS Analysis by Color Formulation, 2026 and 2036
- Figure 110: South Asia and Pacific Market Y-o-Y Growth Comparison by Color Formulation, 2026-2036
- Figure 111: South Asia and Pacific Market Attractiveness Analysis by Color Formulation
- Figure 112: South Asia and Pacific Market Value Share and BPS Analysis by Regulatory Grade, 2026 and 2036
- Figure 113: South Asia and Pacific Market Y-o-Y Growth Comparison by Regulatory Grade, 2026-2036
- Figure 114: South Asia and Pacific Market Attractiveness Analysis by Regulatory Grade
- Figure 115: South Asia and Pacific Market Value Share and BPS Analysis by Commercial End-Use, 2026 and 2036
- Figure 116: South Asia and Pacific Market Y-o-Y Growth Comparison by Commercial End-Use, 2026-2036
- Figure 117: South Asia and Pacific Market Attractiveness Analysis by Commercial End-Use
- Figure 118: South Asia and Pacific Market Value Share and BPS Analysis by Production Pathway, 2026 and 2036
- Figure 119: South Asia and Pacific Market Y-o-Y Growth Comparison by Production Pathway, 2026-2036
- Figure 120: South Asia and Pacific Market Attractiveness Analysis by Production Pathway
- Figure 121: South Asia and Pacific Market Value Share and BPS Analysis by Distribution Channel, 2026 and 2036
- Figure 122: South Asia and Pacific Market Y-o-Y Growth Comparison by Distribution Channel, 2026-2036
- Figure 123: South Asia and Pacific Market Attractiveness Analysis by Distribution Channel
- Figure 124: Middle East and Africa Market Value Share and BPS Analysis by Country, 2026 and 2036
- Figure 125: Middle East and Africa Market Value Share and BPS Analysis by Color Formulation, 2026 and 2036
- Figure 126: Middle East and Africa Market Y-o-Y Growth Comparison by Color Formulation, 2026-2036
- Figure 127: Middle East and Africa Market Attractiveness Analysis by Color Formulation
- Figure 128: Middle East and Africa Market Value Share and BPS Analysis by Regulatory Grade, 2026 and 2036
- Figure 129: Middle East and Africa Market Y-o-Y Growth Comparison by Regulatory Grade, 2026-2036
- Figure 130: Middle East and Africa Market Attractiveness Analysis by Regulatory Grade
- Figure 131: Middle East and Africa Market Value Share and BPS Analysis by Commercial End-Use, 2026 and 2036
- Figure 132: Middle East and Africa Market Y-o-Y Growth Comparison by Commercial End-Use, 2026-2036
- Figure 133: Middle East and Africa Market Attractiveness Analysis by Commercial End-Use
- Figure 134: Middle East and Africa Market Value Share and BPS Analysis by Production Pathway, 2026 and 2036
- Figure 135: Middle East and Africa Market Y-o-Y Growth Comparison by Production Pathway, 2026-2036
- Figure 136: Middle East and Africa Market Attractiveness Analysis by Production Pathway
- Figure 137: Middle East and Africa Market Value Share and BPS Analysis by Distribution Channel, 2026 and 2036
- Figure 138: Middle East and Africa Market Y-o-Y Growth Comparison by Distribution Channel, 2026-2036
- Figure 139: Middle East and Africa Market Attractiveness Analysis by Distribution Channel
- Figure 140: Global Market - Tier Structure Analysis
- Figure 141: Global Market - Company Share Analysis
Frequently Asked Questions
How big is the Apocarotenal Market in 2026, and what is forecast for 2036?
FMI estimates that the global apocarotenal market size stood at USD 295.0 million in 2025 and reached USD 308.2 million in 2026. Overall industry valuation is on course to hit USD 487.9 million by 2036 as food and dairy processors replace synthetic azo dyes with heat-stable C30 carotenoid dispersions.
What is the CAGR for the Apocarotenal Market from 2026 to 2036?
The apocarotenal sector is projected to expand at a 4.7% CAGR across the 2026 to 2036 window. This expansion generates USD 179.7 million in incremental revenue across dairy, beverage, and poultry feed applications.
Which color formulation segment leads the Apocarotenal Market?
Oil Suspension 20% formulations hold 42.7% of color formulation demand in 2026 since micronized C30 crystals suspended in vegetable oil dissolve directly into melted cheese and fat blends.
Which regulatory grade segment leads the Apocarotenal Market?
Food Grade Colorant E160e represents 63.1% of the regulatory grade category in 2026 driven by grocery clean-label conversions away from petroleum-derived Yellow 6.
Which country has a notable growth outlook during the assessment period?
India leads national expansion projections at a 5.6% CAGR through 2036, supported by rapid organized dairy processing growth and domestic carotenoid beadlet manufacturing.
Who are the key players in the market?
Primary synthesis producers include dsm-firmenich and BASF as well as Divi's Laboratories and Allied Biotech. Specialty color houses include Lycored, Oterra, and Sensient. Givaudan, Symrise, and Novonesis supply integrated systems.
Preview the report firsthand - request a free sample
Get SampleGet the brochure for pricing and purchase details.
Get PDF
