Aquafeed Market Overview (2023 to 2033)

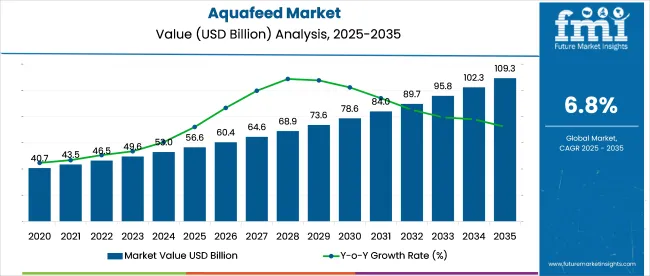
According to Future Market Insights, the global aquafeed market is expected to increase at a CAGR of 6.8% through 2033. The market value is projected to expand from US$ 46.8 billion in 2023 to US$ 90.9 billion by 2033.

Due to the expansion of fish farming operations, the aquafeed market is anticipated to rise quickly. During the forecast period, the market for plant-based aquafeed is expected to be driven by manufacturers' growing desire for natural and organic feed products, which has now emerged as the latest industry trend.

Attributes Details
Aquafeed Market CAGR (2023 to 2033) 6.8%
Aquafeed Market Size (2023) US$ 46.8 billion
Aquafeed Market Size (2033) US$ 90.9 billion

Many governments looking to improve their nations' economic performance have welcomed aquaculture as a key component of the economic development of their nations. As a result, many policies have been introduced to encourage the aquafeed market share.

Don't pay for what you don't need

Customize your report by selecting specific countries or regions and save 30%!

What are the Dynamics of the Aquafeed Market?

Government Regulation

Favorable government standards and regulations, such as the acceptance of insect protein use in aquafeed, are anticipated to boost market expansion. For the aquafeed and aquaculture industries, insects offer a natural and sustainable source of high-quality protein.

One of the main factors influencing the demand for aquafeed is the positive results of using insect proteins as a feed additive for aquaculture in terms of growth and quality.

Organic Farming

Chemical-free, genetically modified, and pesticide-free items are prioritized in the manufacturing of organic fish. Lowering the stocking density also ensures animal well-being.

Aquatic creatures can be raised in a suitable and ethical way by using organic fish feed. The increase in the production of organic feed is anticipated to support the expansion of the sales of aquafeed, as it has been noted that consumers' preference for organic food has expanded dramatically in recent years.

Comparative View of Adjacent Aquafeed Market

Aquafeed Market:

Attributes Aquafeed Market
CAGR (2023 to 2033) 6.8%
Market Value (2033) US$ 90.9 billion
Growth Factor The expansion of the aquafeed market is fueled by rising consumer expenditure on fish and fish products, as well as rising seafood consumption.
Opportunity Opportunities exist in the sector due to rising trade in seafood and rising demand for animal protein in developed Western nations.
Key Trends Several market prospects can be seen with increased investments by market participants and associations in the research and development of innovative goods.

Aquaponics Market:

Attributes Aquaponics Market
CAGR (2023 to 2033) 8.3%
Market Value (2033) US$ 3.3 billion
Growth Factor Demand for sustainable agriculture is contributing to the market share.
Opportunity Industrialization and growing urbanization open up new business opportunities.
Key Trends The aquaponic system's financial benefits are the newest trend in the marketplace.

Aqua Feed Additives Market:

Attributes Aqua Feed Additives Market
CAGR (2023 to 2033) 5.5%
Market Value (2033) US$ 2.7 billion
Growth Factor Due to increased awareness of premixes, there is a greater demand for aqua feed additives.
Opportunity The market for aqua feed additives is seeing some promising growth possibilities due to the increased demand for high-protein diets.
Key Trends To meet consumer demand, manufacturers in the aquafeed additives market are scaling up manufacturing of direct mineral supplements.

Increased aquaculture production is anticipated as a result of rising consumer spending on fish and fish-related products, including fish oil, fish meal, and fish silage, as well as rising seafood consumption.

Additionally, it is anticipated that the rising commerce in seafood across numerous international countries and the rising need for animal protein in developed Western economies would both contribute to the adoption of aquafeed during the forecast period.

The aquafeed market share expansion may be hampered by the high price fluctuation of the raw materials used in the manufacturing of the feed. For instance, a sharp increase in the cost of soybeans, corn, or other raw materials may have a direct impact on the ultimate price of the product, which may reduce sales of aquafeed.

Additionally, a growing number of individuals are choosing vegetarian diets and avoiding non-vegetarian food, which is predicted to lower demand for fish and has a negative impact on the aquafeed market.

Moreover, the use of crab and other crustacean shells in the treatment and prevention of inflammatory illnesses should increase demand for aquafeed from the medical sector. Numerous health conditions are caused by the world's aging population and unhealthy eating practices. During the forecast period, it is anticipated that this factor is likely to provide several opportunities in the aquafeed market.

Nandini Roy Choudhury

Principal Consultant

Talk to Analyst

Find your sweet spots for generating winning opportunities in this market.

Country-wise Insights

How is the North America Aquafeed Market Shaping?

The global market is expected to experience significant growth in North America. The nation's leadership is a result of a thriving aquaculture sector and rising seafood consumption.

The aquaculture industry in the USA generated 283 million kilograms of produce worth USD 1.4 billion in 2017. The demand for aquafeed is anticipated to expand quickly in the near future as a result of the nation's aquaculture production's recent rapid growth.

What is the Asia Pacific Outlook of the Aquafeed Market?

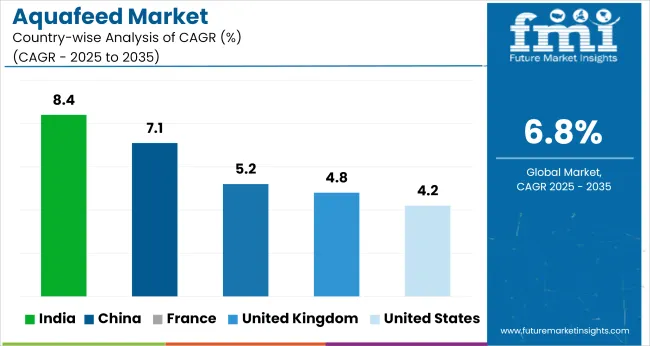
Currently, the Asia Pacific region is a large market for aquafeed and is anticipated to account for a sizable chunk of the worldwide market share over the forecast period. Over the past ten years, the Asia Pacific market has grown quickly, with China and India accounting for more than half of all sales of aquafeed.

Due to the enormous increase in fish production rate, the demand for aquafeed in China and India is anticipated to continue positive during the forecast period.

Category-wise Insights

How does Amino Acid Dominate the Segment in the Aquafeed Market?

Amino acids dominate the market, accounting for more than 32% of total revenue. This major proportion is due to its benefits, which include improving the body’s immune system, optimizing metabolic transformation, increasing tolerance to adverse environmental conditions, mediating breeding season efficiency and timing, and trying to improve filet taste and texture when introduced to aquafeed.

Antibiotics, in addition to amino acids, are commonly used in aquafeed. They are used to maximize efficiency and productivity, encourage good development, and improve overall health.

Which is the Leading Segment in the Aquafeed Market, Based on Species?

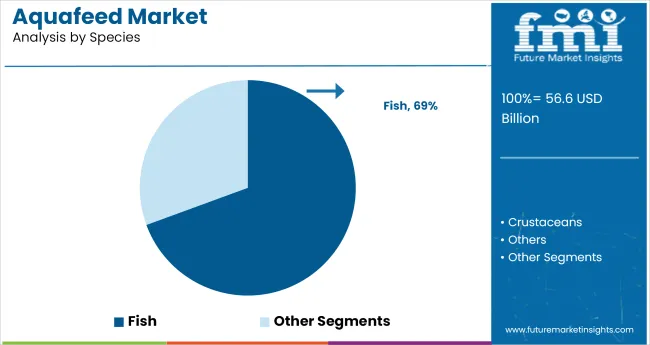
In 2020, the fish category accounted for the biggest share of the global aquafeed market. Fish feed sales could benefit from the enormous expansion of aquaculture to close the supply-demand gap for fish in general.

The base of the food chain and the maintenance of a thriving fish population can both be supported with high-quality fish feed. This may influence the need for fish feed in the coming years. Tilapia and carp are a couple of the more well-known fish that eat feed.

Get the data you need at a Fraction of the cost

Personalize your report by choosing insights you need
and save 40%!

How are Start-ups Performing in the Aquafeed Market?

In order to link strategic and financial investors with specific investment possibilities across the aquaculture market, many startups are emerging with advanced technology.

An Indian biotech startup called String Bio has secured roughly $20 million in Series B funding. The business has developed cutting-edge technology to transform the energy in methane into a variety of value-added goods, including fish and animal feed.

A contract was also signed by the business and one of its major investors, Woodside Energy Technologies Pty Ltd.

Coastal farmers can benefit from real-time, tech-based farm monitoring systems, advice, aquaculture knowledge, and access to export markets through Aquaconnect, a full-stack aquaculture technology enterprise, and marketplace.

Up till this point, Aquaconnect has secured $17 million in capital through a combination of equity and debt.

Omnivore, Rebright Partners, Flourish Ventures, and Trifecta Capital are just a few of the investors in this startup.

Competitive Landscape

High intake has a favorable impact on aquaculture productivity; as a result, demand for aquafeed is predicted to grow at a higher rate. As the market grows, industry participants are being compelled to expand their product portfolios and distribution networks in order to expand their market presence and customer base.

Manufacturers of aquafeed are always doing research and development to offer a choice of natural and organic aquafeeds for use in the growth of various species.

Recent Developments

  • March 2023: Skretting confirmed that the company was establishing an additional research and development centre in Norway.
  • April 2023: BioMar defined that it has struck a collaboration arrangement at the University of Edinburgh.
  • May 2023: Cargill revealed that it has created an innovative aquafeed brand named AquaPro

Key Players

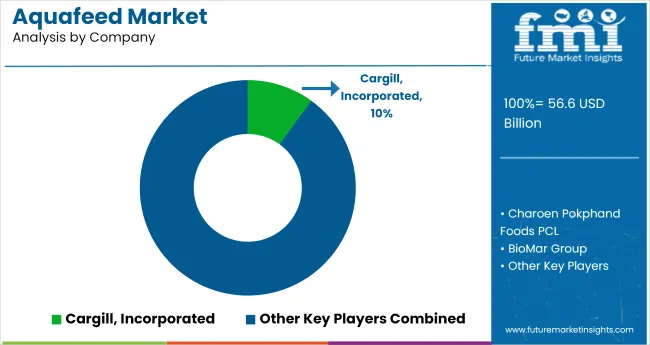
  • Cargill, Incorporated
  • Charoen Pokphand Foods PCL
  • BioMar Group
  • Ridley Corporation Limited
  • Aller Aqua
  • Biostadt India Limited
  • BENEO
  • Alltech
  • INVE Aquaculture
  • AKER BIO MARINE
  • Skretting
  • Purina Animal Nutrition LLC
  • Dibaq Aquaculture
  • Avanti Feeds Limited
  • The Waterbase Limited

Companies like Guiuan and Nutreco are concentrating on adopting cutting-edge strategies and high-quality components for greater growth.

Historically, fishmeal and fish oil made up 70% of the diets of carnivorous fish. As new feed sources are developed, these percentages have drastically decreased. Scientists and fish farmers are discovering via research that alternative mixtures of components can balance the roughly 40 critical nutrients needed by fish.

Moreover, the addition of American soybeans and other grain crops, which are predominantly grown inland, boosts the effectiveness of aquafeeds and increases the financial prospects available to American farmers. 80% of the 89 million acres of soybeans grown in the United States in 2017 were used as animal feed.

These high-quality plant-based components' sourcing unites the heartland and the coasts, fostering home economic prospects and sustainable feed substitutes.

Using aquafeed enriched with taurine typically costs farmers less than half as much as using regular fishmeal. Taurine has long been a component of fish meals in other nations, notably those in the European Union and Canada.

The FDA approved the use of taurine for farmed fish feed in the United States in 2017 on the basis of multiple studies, including work by NOAA Fisheries. The inclusion of taurine levels the playing field for American farmers and expands the range of environmentally friendly, safe, and cost-effective aquafeed options available to producers.

The product portfolio, geographic location, and seller count are the primary determinants of market competition globally. For instance, Hi-Pro Feeds LP was acquired by Nutreco in June 2017. (Canada). Under Trouw Nutrition's global brand, the purchased company would conduct business.

The demand for aquafeed is anticipated to be positively impacted by the rising investments made by market participants and associations in the research and development of novel goods.

For instance, Guiuan hosted the official opening of the Milkfish Aquafeeds Research, Development, and Extension Project (RDEP) in August 2020. In order to combat the market's high feed costs, this new research intends to find alternatives for fish feed ingredients. The utilization of plant-based proteins as a main component of fish feed is a novel replacement.

Aquafeed Market Report Scope

Attribute Details
Forecast Period 2023 to 2033
Historical Data Available for 2018 to 2022
Market Analysis USD billion for Value and Units for Volume
Key Regions Covered
  • North America
  • Latin America
  • Europe
  • Asia Pacific
  • Oceania
  • Middle East & Africa (MEA)
Key Countries Covered
  • The USA
  • Canada
  • Mexico
  • Germany
  • The UK
  • France
  • Italy
  • Spain
  • China
  • Japan
  • India
  • South Korea
  • Australia
  • Brazil
  • Argentina
  • South Africa
  • UAE
Key Segments Covered
  • Species
  • Form
  • Function
  • Ingredient
  • Sales Channel
  • Region
Key Companies Profiled
  • Cargill, Incorporated
  • BioMar Group
  • Ridley Corporation Limited
  • Aller Aqua
  • BENEO
  • Alltech
  • AKER BIOMARINE
  • Charoen Pokphand Foods PCL
  • Skretting
  • Purina Animal Nutrition LLC
  • Dibaq Aquaculture
  • INVE Aquaculture
  • Avanti Feeds Limited
  • Biostadt India Limited
  • The Waterbase Limited
Report Coverage Market Forecast, Company Share Analysis, Competitive Landscape, DROT Analysis, Market Dynamics and Challenges, and Strategic Growth Initiatives
Customization & Pricing Available upon Request

Aquafeed Market by Category

By Species:

  • Crustaceans
  • Fish
  • Others

By Form:

  • Extruded
  • Powder
  • Liquid
  • Pellets

By Function:

  • Health
  • Digestion
  • Palatability
  • Special Nutrition

By Ingredients:

  • Marine
  • Land Animal
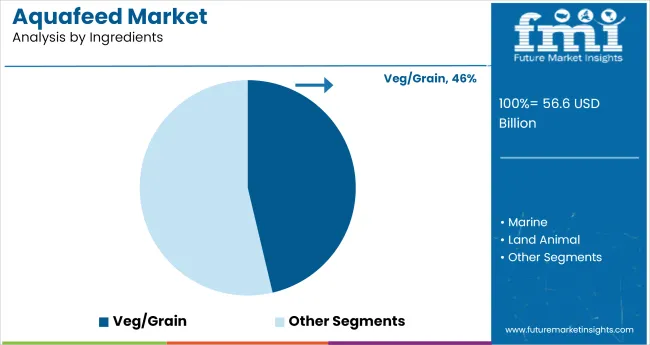
  • Veg/Grain
  • Carotenoid
  • Nutrients
  • Others

By Sales Channel:

  • Direct Sales
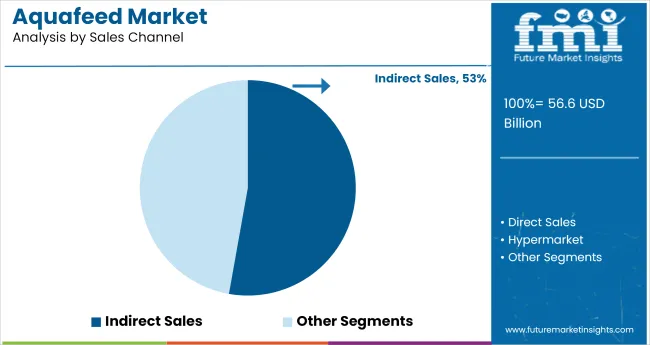
  • Indirect Sales
  • Hypermarket
  • Supermarket
  • Wholesalers
  • Speciality Stores
  • Online
  • Other Retail Formats

By Region:

  • North America
  • Latin America
  • Europe
  • East Asia
  • South Asia
  • Oceania
  • Middle East & Africa (MEA)

Frequently Asked Questions

How Big is the Market?

The market is valued at US$ 46.8 billion in 2023.

Which are the Top Market Players in the Aquafeed Market?

The top market players are Cargill, Incorporated, BioMar Group, and Ridley Corporation Limited.

What is the Estimated Market Size in 2033?

The market is estimated to reach US$ 90.9 billion by 2033.

What Drives Aquafeed Sales?

Increasing production of organic feed drives aquafeed sales.

Which is the Key Segment by Species?

The fish segment is likely to remain preferred through 2033.

Table of Content
1. Executive Summary

    1.1. Global Market Outlook

    1.2. Demand-side Trends

    1.3. Supply-side Trends

    1.4. Technology Roadmap Analysis

    1.5. Analysis and Recommendations

2. Market Overview

    2.1. Market Coverage / Taxonomy

    2.2. Market Definition / Scope / Limitations

3. Market Background

    3.1. Market Dynamics

        3.1.1. Drivers

        3.1.2. Restraints

        3.1.3. Opportunity

        3.1.4. Trends

    3.2. Scenario Forecast

        3.2.1. Demand in Optimistic Scenario

        3.2.2. Demand in Likely Scenario

        3.2.3. Demand in Conservative Scenario

    3.3. Opportunity Map Analysis

    3.4. Product Life Cycle Analysis

    3.5. Supply Chain Analysis

        3.5.1. Supply Side Participants and their Roles

            3.5.1.1. Producers

            3.5.1.2. Mid-Level Participants (Traders/ Agents/ Brokers)

            3.5.1.3. Wholesalers and Distributors

        3.5.2. Value Added and Value Created at Node in the Supply Chain

        3.5.3. List of Raw Material Suppliers

        3.5.4. List of Existing and Potential Buyer’s

    3.6. Investment Feasibility Matrix

    3.7. Value Chain Analysis

        3.7.1. Profit Margin Analysis

        3.7.2. Wholesalers and Distributors

        3.7.3. Retailers

    3.8. PESTLE and Porter’s Analysis

    3.9. Regulatory Landscape

        3.9.1. By Key Regions

        3.9.2. By Key Countries

    3.10. Regional Parent Market Outlook

    3.11. Production and Consumption Statistics

    3.12. Import and Export Statistics

4. Global Market Analysis 2018 to 2022 and Forecast, 2023 to 2033

    4.1. Historical Market Size Value (US$ Million) & Volume (MT) Analysis, 2018 to 2022

    4.2. Current and Future Market Size Value (US$ Million) & Volume (MT) Projections, 2023 to 2033

        4.2.1. Y-o-Y Growth Trend Analysis

        4.2.2. Absolute $ Opportunity Analysis

5. Global Market Analysis 2018 to 2022 and Forecast 2023 to 2033, By Species

    5.1. Introduction / Key Findings

    5.2. Historical Market Size Value (US$ Million) & Volume (MT) Analysis By Species, 2018 to 2022

    5.3. Current and Future Market Size Value (US$ Million) & Volume (MT) Analysis and Forecast By Species, 2023 to 2033

        5.3.1. Crustaceans

        5.3.2. Fish

        5.3.3. Others

    5.4. Y-o-Y Growth Trend Analysis By Species, 2018 to 2022

    5.5. Absolute $ Opportunity Analysis By Species, 2023 to 2033

6. Global Market Analysis 2018 to 2022 and Forecast 2023 to 2033, By Form

    6.1. Introduction / Key Findings

    6.2. Historical Market Size Value (US$ Million) & Volume (MT) Analysis By Form, 2018 to 2022

    6.3. Current and Future Market Size Value (US$ Million) & Volume (MT) Analysis and Forecast By Form, 2023 to 2033

        6.3.1. Extruded

        6.3.2. Powder

        6.3.3. Liquid

        6.3.4. Pellets

    6.4. Y-o-Y Growth Trend Analysis By Form, 2018 to 2022

    6.5. Absolute $ Opportunity Analysis By Form, 2023 to 2033

7. Global Market Analysis 2018 to 2022 and Forecast 2023 to 2033, By Function

    7.1. Introduction / Key Findings

    7.2. Historical Market Size Value (US$ Million) & Volume (MT) Analysis By Function, 2018 to 2022

    7.3. Current and Future Market Size Value (US$ Million) & Volume (MT) Analysis and Forecast By Function, 2023 to 2033

        7.3.1. Health

        7.3.2. Digestion

        7.3.3. Palatability

        7.3.4. Special Nutrition

    7.4. Y-o-Y Growth Trend Analysis By Function, 2018 to 2022

    7.5. Absolute $ Opportunity Analysis By Function, 2023 to 2033

8. Global Market Analysis 2018 to 2022 and Forecast 2023 to 2033, By Ingredients

    8.1. Introduction / Key Findings

    8.2. Historical Market Size Value (US$ Million) & Volume (MT) Analysis By Ingredients, 2018 to 2022

    8.3. Current and Future Market Size Value (US$ Million) & Volume (MT) Analysis and Forecast By Ingredients, 2023 to 2033

        8.3.1. Marine

        8.3.2. Land Animal

        8.3.3. Veg/Grain

        8.3.4. Carotenoid

        8.3.5. Nutrients

        8.3.6. Others

    8.4. Y-o-Y Growth Trend Analysis By Ingredients, 2018 to 2022

    8.5. Absolute $ Opportunity Analysis By Ingredients, 2023 to 2033

9. Global Market Analysis 2018 to 2022 and Forecast 2023 to 2033, By Sales Channel

    9.1. Introduction / Key Findings

    9.2. Historical Market Size Value (US$ Million) & Volume (MT) Analysis By Sales Channel, 2018 to 2022

    9.3. Current and Future Market Size Value (US$ Million) & Volume (MT) Analysis and Forecast By Sales Channel, 2023 to 2033

        9.3.1. Direct Sales

        9.3.2. Indirect Sales

        9.3.3. Hypermarket

        9.3.4. Supermarket

        9.3.5. Wholesalers

        9.3.6. Speciality Stores

        9.3.7. Online

        9.3.8. Others

    9.4. Y-o-Y Growth Trend Analysis By Sales Channel, 2018 to 2022

    9.5. Absolute $ Opportunity Analysis By Sales Channel, 2023 to 2033

10. Global Market Analysis 2018 to 2022 and Forecast 2023 to 2033, By Region

    10.1. Introduction

    10.2. Historical Market Size Value (US$ Million) & Volume (MT) Analysis By Region, 2018 to 2022

    10.3. Current Market Size Value (US$ Million) & Volume (MT) Analysis and Forecast By Region, 2023 to 2033

        10.3.1. North America

        10.3.2. Latin America

        10.3.3. Western Europe

        10.3.4. Eastern Europe

        10.3.5. South Asia and Pacific

        10.3.6. East Asia

        10.3.7. Middle East and Africa

    10.4. Market Attractiveness Analysis By Region

11. North America Market Analysis 2018 to 2022 and Forecast 2023 to 2033, By Country

    11.1. Historical Market Size Value (US$ Million) & Volume (MT) Trend Analysis By Market Taxonomy, 2018 to 2022

    11.2. Market Size Value (US$ Million) & Volume (MT) Forecast By Market Taxonomy, 2023 to 2033

        11.2.1. By Country

            11.2.1.1. USA

            11.2.1.2. Canada

        11.2.2. By Species

        11.2.3. By Form

        11.2.4. By Function

        11.2.5. By Ingredients

        11.2.6. By Sales Channel

    11.3. Market Attractiveness Analysis

        11.3.1. By Country

        11.3.2. By Species

        11.3.3. By Form

        11.3.4. By Function

        11.3.5. By Ingredients

        11.3.6. By Sales Channel

    11.4. Key Takeaways

12. Latin America Market Analysis 2018 to 2022 and Forecast 2023 to 2033, By Country

    12.1. Historical Market Size Value (US$ Million) & Volume (MT) Trend Analysis By Market Taxonomy, 2018 to 2022

    12.2. Market Size Value (US$ Million) & Volume (MT) Forecast By Market Taxonomy, 2023 to 2033

        12.2.1. By Country

            12.2.1.1. Brazil

            12.2.1.2. Mexico

            12.2.1.3. Rest of Latin America

        12.2.2. By Species

        12.2.3. By Form

        12.2.4. By Function

        12.2.5. By Ingredients

        12.2.6. By Sales Channel

    12.3. Market Attractiveness Analysis

        12.3.1. By Country

        12.3.2. By Species

        12.3.3. By Form

        12.3.4. By Function

        12.3.5. By Ingredients

        12.3.6. By Sales Channel

    12.4. Key Takeaways

13. Western Europe Market Analysis 2018 to 2022 and Forecast 2023 to 2033, By Country

    13.1. Historical Market Size Value (US$ Million) & Volume (MT) Trend Analysis By Market Taxonomy, 2018 to 2022

    13.2. Market Size Value (US$ Million) & Volume (MT) Forecast By Market Taxonomy, 2023 to 2033

        13.2.1. By Country

            13.2.1.1. Germany

            13.2.1.2. UK

            13.2.1.3. France

            13.2.1.4. Spain

            13.2.1.5. Italy

            13.2.1.6. Rest of Western Europe

        13.2.2. By Species

        13.2.3. By Form

        13.2.4. By Function

        13.2.5. By Ingredients

        13.2.6. By Sales Channel

    13.3. Market Attractiveness Analysis

        13.3.1. By Country

        13.3.2. By Species

        13.3.3. By Form

        13.3.4. By Function

        13.3.5. By Ingredients

        13.3.6. By Sales Channel

    13.4. Key Takeaways

14. Eastern Europe Market Analysis 2018 to 2022 and Forecast 2023 to 2033, By Country

    14.1. Historical Market Size Value (US$ Million) & Volume (MT) Trend Analysis By Market Taxonomy, 2018 to 2022

    14.2. Market Size Value (US$ Million) & Volume (MT) Forecast By Market Taxonomy, 2023 to 2033

        14.2.1. By Country

            14.2.1.1. Poland

            14.2.1.2. Russia

            14.2.1.3. Czech Republic

            14.2.1.4. Romania

            14.2.1.5. Rest of Eastern Europe

        14.2.2. By Species

        14.2.3. By Form

        14.2.4. By Function

        14.2.5. By Ingredients

        14.2.6. By Sales Channel

    14.3. Market Attractiveness Analysis

        14.3.1. By Country

        14.3.2. By Species

        14.3.3. By Form

        14.3.4. By Function

        14.3.5. By Ingredients

        14.3.6. By Sales Channel

    14.4. Key Takeaways

15. South Asia and Pacific Market Analysis 2018 to 2022 and Forecast 2023 to 2033, By Country

    15.1. Historical Market Size Value (US$ Million) & Volume (MT) Trend Analysis By Market Taxonomy, 2018 to 2022

    15.2. Market Size Value (US$ Million) & Volume (MT) Forecast By Market Taxonomy, 2023 to 2033

        15.2.1. By Country

            15.2.1.1. India

            15.2.1.2. Bangladesh

            15.2.1.3. Australia

            15.2.1.4. New Zealand

            15.2.1.5. Rest of South Asia and Pacific

        15.2.2. By Species

        15.2.3. By Form

        15.2.4. By Function

        15.2.5. By Ingredients

        15.2.6. By Sales Channel

    15.3. Market Attractiveness Analysis

        15.3.1. By Country

        15.3.2. By Species

        15.3.3. By Form

        15.3.4. By Function

        15.3.5. By Ingredients

        15.3.6. By Sales Channel

    15.4. Key Takeaways

16. East Asia Market Analysis 2018 to 2022 and Forecast 2023 to 2033, By Country

    16.1. Historical Market Size Value (US$ Million) & Volume (MT) Trend Analysis By Market Taxonomy, 2018 to 2022

    16.2. Market Size Value (US$ Million) & Volume (MT) Forecast By Market Taxonomy, 2023 to 2033

        16.2.1. By Country

            16.2.1.1. China

            16.2.1.2. Japan

            16.2.1.3. South Korea

        16.2.2. By Species

        16.2.3. By Form

        16.2.4. By Function

        16.2.5. By Ingredients

        16.2.6. By Sales Channel

    16.3. Market Attractiveness Analysis

        16.3.1. By Country

        16.3.2. By Species

        16.3.3. By Form

        16.3.4. By Function

        16.3.5. By Ingredients

        16.3.6. By Sales Channel

    16.4. Key Takeaways

17. Middle East and Africa Market Analysis 2018 to 2022 and Forecast 2023 to 2033, By Country

    17.1. Historical Market Size Value (US$ Million) & Volume (MT) Trend Analysis By Market Taxonomy, 2018 to 2022

    17.2. Market Size Value (US$ Million) & Volume (MT) Forecast By Market Taxonomy, 2023 to 2033

        17.2.1. By Country

            17.2.1.1. GCC Countries

            17.2.1.2. South Africa

            17.2.1.3. Israel

            17.2.1.4. Rest of MEA

        17.2.2. By Species

        17.2.3. By Form

        17.2.4. By Function

        17.2.5. By Ingredients

        17.2.6. By Sales Channel

    17.3. Market Attractiveness Analysis

        17.3.1. By Country

        17.3.2. By Species

        17.3.3. By Form

        17.3.4. By Function

        17.3.5. By Ingredients

        17.3.6. By Sales Channel

    17.4. Key Takeaways

18. Key Countries Market Analysis

    18.1. USA

        18.1.1. Pricing Analysis

        18.1.2. Market Share Analysis, 2022

            18.1.2.1. By Species

            18.1.2.2. By Form

            18.1.2.3. By Function

            18.1.2.4. By Ingredients

            18.1.2.5. By Sales Channel

    18.2. Canada

        18.2.1. Pricing Analysis

        18.2.2. Market Share Analysis, 2022

            18.2.2.1. By Species

            18.2.2.2. By Form

            18.2.2.3. By Function

            18.2.2.4. By Ingredients

            18.2.2.5. By Sales Channel

    18.3. Brazil

        18.3.1. Pricing Analysis

        18.3.2. Market Share Analysis, 2022

            18.3.2.1. By Species

            18.3.2.2. By Form

            18.3.2.3. By Function

            18.3.2.4. By Ingredients

            18.3.2.5. By Sales Channel

    18.4. Mexico

        18.4.1. Pricing Analysis

        18.4.2. Market Share Analysis, 2022

            18.4.2.1. By Species

            18.4.2.2. By Form

            18.4.2.3. By Function

            18.4.2.4. By Ingredients

            18.4.2.5. By Sales Channel

    18.5. Germany

        18.5.1. Pricing Analysis

        18.5.2. Market Share Analysis, 2022

            18.5.2.1. By Species

            18.5.2.2. By Form

            18.5.2.3. By Function

            18.5.2.4. By Ingredients

            18.5.2.5. By Sales Channel

    18.6. UK

        18.6.1. Pricing Analysis

        18.6.2. Market Share Analysis, 2022

            18.6.2.1. By Species

            18.6.2.2. By Form

            18.6.2.3. By Function

            18.6.2.4. By Ingredients

            18.6.2.5. By Sales Channel

    18.7. France

        18.7.1. Pricing Analysis

        18.7.2. Market Share Analysis, 2022

            18.7.2.1. By Species

            18.7.2.2. By Form

            18.7.2.3. By Function

            18.7.2.4. By Ingredients

            18.7.2.5. By Sales Channel

    18.8. Spain

        18.8.1. Pricing Analysis

        18.8.2. Market Share Analysis, 2022

            18.8.2.1. By Species

            18.8.2.2. By Form

            18.8.2.3. By Function

            18.8.2.4. By Ingredients

            18.8.2.5. By Sales Channel

    18.9. Italy

        18.9.1. Pricing Analysis

        18.9.2. Market Share Analysis, 2022

            18.9.2.1. By Species

            18.9.2.2. By Form

            18.9.2.3. By Function

            18.9.2.4. By Ingredients

            18.9.2.5. By Sales Channel

    18.10. Poland

        18.10.1. Pricing Analysis

        18.10.2. Market Share Analysis, 2022

            18.10.2.1. By Species

            18.10.2.2. By Form

            18.10.2.3. By Function

            18.10.2.4. By Ingredients

            18.10.2.5. By Sales Channel

    18.11. Russia

        18.11.1. Pricing Analysis

        18.11.2. Market Share Analysis, 2022

            18.11.2.1. By Species

            18.11.2.2. By Form

            18.11.2.3. By Function

            18.11.2.4. By Ingredients

            18.11.2.5. By Sales Channel

    18.12. Czech Republic

        18.12.1. Pricing Analysis

        18.12.2. Market Share Analysis, 2022

            18.12.2.1. By Species

            18.12.2.2. By Form

            18.12.2.3. By Function

            18.12.2.4. By Ingredients

            18.12.2.5. By Sales Channel

    18.13. Romania

        18.13.1. Pricing Analysis

        18.13.2. Market Share Analysis, 2022

            18.13.2.1. By Species

            18.13.2.2. By Form

            18.13.2.3. By Function

            18.13.2.4. By Ingredients

            18.13.2.5. By Sales Channel

    18.14. India

        18.14.1. Pricing Analysis

        18.14.2. Market Share Analysis, 2022

            18.14.2.1. By Species

            18.14.2.2. By Form

            18.14.2.3. By Function

            18.14.2.4. By Ingredients

            18.14.2.5. By Sales Channel

    18.15. Bangladesh

        18.15.1. Pricing Analysis

        18.15.2. Market Share Analysis, 2022

            18.15.2.1. By Species

            18.15.2.2. By Form

            18.15.2.3. By Function

            18.15.2.4. By Ingredients

            18.15.2.5. By Sales Channel

    18.16. Australia

        18.16.1. Pricing Analysis

        18.16.2. Market Share Analysis, 2022

            18.16.2.1. By Species

            18.16.2.2. By Form

            18.16.2.3. By Function

            18.16.2.4. By Ingredients

            18.16.2.5. By Sales Channel

    18.17. New Zealand

        18.17.1. Pricing Analysis

        18.17.2. Market Share Analysis, 2022

            18.17.2.1. By Species

            18.17.2.2. By Form

            18.17.2.3. By Function

            18.17.2.4. By Ingredients

            18.17.2.5. By Sales Channel

    18.18. China

        18.18.1. Pricing Analysis

        18.18.2. Market Share Analysis, 2022

            18.18.2.1. By Species

            18.18.2.2. By Form

            18.18.2.3. By Function

            18.18.2.4. By Ingredients

            18.18.2.5. By Sales Channel

    18.19. Japan

        18.19.1. Pricing Analysis

        18.19.2. Market Share Analysis, 2022

            18.19.2.1. By Species

            18.19.2.2. By Form

            18.19.2.3. By Function

            18.19.2.4. By Ingredients

            18.19.2.5. By Sales Channel

    18.20. South Korea

        18.20.1. Pricing Analysis

        18.20.2. Market Share Analysis, 2022

            18.20.2.1. By Species

            18.20.2.2. By Form

            18.20.2.3. By Function

            18.20.2.4. By Ingredients

            18.20.2.5. By Sales Channel

    18.21. GCC Countries

        18.21.1. Pricing Analysis

        18.21.2. Market Share Analysis, 2022

            18.21.2.1. By Species

            18.21.2.2. By Form

            18.21.2.3. By Function

            18.21.2.4. By Ingredients

            18.21.2.5. By Sales Channel

    18.22. South Africa

        18.22.1. Pricing Analysis

        18.22.2. Market Share Analysis, 2022

            18.22.2.1. By Species

            18.22.2.2. By Form

            18.22.2.3. By Function

            18.22.2.4. By Ingredients

            18.22.2.5. By Sales Channel

    18.23. Israel

        18.23.1. Pricing Analysis

        18.23.2. Market Share Analysis, 2022

            18.23.2.1. By Species

            18.23.2.2. By Form

            18.23.2.3. By Function

            18.23.2.4. By Ingredients

            18.23.2.5. By Sales Channel

19. Market Structure Analysis

    19.1. Competition Dashboard

    19.2. Competition Benchmarking

    19.3. Market Share Analysis of Top Players

        19.3.1. By Regional

        19.3.2. By Species

        19.3.3. By Form

        19.3.4. By Function

        19.3.5. By Ingredients

        19.3.6. By Sales Channel

20. Competition Analysis

    20.1. Competition Deep Dive

        20.1.1. Cargill, Incorporated

            20.1.1.1. Overview

            20.1.1.2. Product Portfolio

            20.1.1.3. Profitability by Market Segments

            20.1.1.4. Sales Footprint

            20.1.1.5. Strategy Overview

                20.1.1.5.1. Marketing Strategy

                20.1.1.5.2. Product Strategy

                20.1.1.5.3. Channel Strategy

        20.1.2. Charoen Pokphand Foods PCL

            20.1.2.1. Overview

            20.1.2.2. Product Portfolio

            20.1.2.3. Profitability by Market Segments

            20.1.2.4. Sales Footprint

            20.1.2.5. Strategy Overview

                20.1.2.5.1. Marketing Strategy

                20.1.2.5.2. Product Strategy

                20.1.2.5.3. Channel Strategy

        20.1.3. BioMar Group

            20.1.3.1. Overview

            20.1.3.2. Product Portfolio

            20.1.3.3. Profitability by Market Segments

            20.1.3.4. Sales Footprint

            20.1.3.5. Strategy Overview

                20.1.3.5.1. Marketing Strategy

                20.1.3.5.2. Product Strategy

                20.1.3.5.3. Channel Strategy

        20.1.4. Ridley Corporation Limited

            20.1.4.1. Overview

            20.1.4.2. Product Portfolio

            20.1.4.3. Profitability by Market Segments

            20.1.4.4. Sales Footprint

            20.1.4.5. Strategy Overview

                20.1.4.5.1. Marketing Strategy

                20.1.4.5.2. Product Strategy

                20.1.4.5.3. Channel Strategy

        20.1.5. Aller Aqua

            20.1.5.1. Overview

            20.1.5.2. Product Portfolio

            20.1.5.3. Profitability by Market Segments

            20.1.5.4. Sales Footprint

            20.1.5.5. Strategy Overview

                20.1.5.5.1. Marketing Strategy

                20.1.5.5.2. Product Strategy

                20.1.5.5.3. Channel Strategy

        20.1.6. Biostadt India Limited

            20.1.6.1. Overview

            20.1.6.2. Product Portfolio

            20.1.6.3. Profitability by Market Segments

            20.1.6.4. Sales Footprint

            20.1.6.5. Strategy Overview

                20.1.6.5.1. Marketing Strategy

                20.1.6.5.2. Product Strategy

                20.1.6.5.3. Channel Strategy

        20.1.7. BENEO

            20.1.7.1. Overview

            20.1.7.2. Product Portfolio

            20.1.7.3. Profitability by Market Segments

            20.1.7.4. Sales Footprint

            20.1.7.5. Strategy Overview

                20.1.7.5.1. Marketing Strategy

                20.1.7.5.2. Product Strategy

                20.1.7.5.3. Channel Strategy

        20.1.8. Alltech

            20.1.8.1. Overview

            20.1.8.2. Product Portfolio

            20.1.8.3. Profitability by Market Segments

            20.1.8.4. Sales Footprint

            20.1.8.5. Strategy Overview

                20.1.8.5.1. Marketing Strategy

                20.1.8.5.2. Product Strategy

                20.1.8.5.3. Channel Strategy

        20.1.9. INVE Aquaculture

            20.1.9.1. Overview

            20.1.9.2. Product Portfolio

            20.1.9.3. Profitability by Market Segments

            20.1.9.4. Sales Footprint

            20.1.9.5. Strategy Overview

                20.1.9.5.1. Marketing Strategy

                20.1.9.5.2. Product Strategy

                20.1.9.5.3. Channel Strategy

        20.1.10. AKER BIO MARINE

            20.1.10.1. Overview

            20.1.10.2. Product Portfolio

            20.1.10.3. Profitability by Market Segments

            20.1.10.4. Sales Footprint

            20.1.10.5. Strategy Overview

                20.1.10.5.1. Marketing Strategy

                20.1.10.5.2. Product Strategy

                20.1.10.5.3. Channel Strategy

        20.1.11. Skretting

            20.1.11.1. Overview

            20.1.11.2. Product Portfolio

            20.1.11.3. Profitability by Market Segments

            20.1.11.4. Sales Footprint

            20.1.11.5. Strategy Overview

                20.1.11.5.1. Marketing Strategy

                20.1.11.5.2. Product Strategy

                20.1.11.5.3. Channel Strategy

        20.1.12. Purina Animal Nutrition LLC

            20.1.12.1. Overview

            20.1.12.2. Product Portfolio

            20.1.12.3. Profitability by Market Segments

            20.1.12.4. Sales Footprint

            20.1.12.5. Strategy Overview

                20.1.12.5.1. Marketing Strategy

                20.1.12.5.2. Product Strategy

                20.1.12.5.3. Channel Strategy

        20.1.13. Dibaq Aquaculture

            20.1.13.1. Overview

            20.1.13.2. Product Portfolio

            20.1.13.3. Profitability by Market Segments

            20.1.13.4. Sales Footprint

            20.1.13.5. Strategy Overview

                20.1.13.5.1. Marketing Strategy

                20.1.13.5.2. Product Strategy

                20.1.13.5.3. Channel Strategy

        20.1.14. Avanti Feeds Limited

            20.1.14.1. Overview

            20.1.14.2. Product Portfolio

            20.1.14.3. Profitability by Market Segments

            20.1.14.4. Sales Footprint

            20.1.14.5. Strategy Overview

                20.1.14.5.1. Marketing Strategy

                20.1.14.5.2. Product Strategy

                20.1.14.5.3. Channel Strategy

        20.1.15. The Waterbase Limited

            20.1.15.1. Overview

            20.1.15.2. Product Portfolio

            20.1.15.3. Profitability by Market Segments

            20.1.15.4. Sales Footprint

            20.1.15.5. Strategy Overview

                20.1.15.5.1. Marketing Strategy

                20.1.15.5.2. Product Strategy

                20.1.15.5.3. Channel Strategy

21. Assumptions & Acronyms Used

22. Research Methodology
Recommendations

Food and Beverage

Feed Phytogenic Market

November 2017

REP-GB-5622

April 2023

342 pages

Food and Beverage

Feed Flavors Market

September 2024

REP-GB-11677

Upcoming

Explore Food and Beverage Insights

View Reports