Aquafeed Enzyme Market Size, Share, and Forecast Outlook 2025 to 2035 

The global aquafeed enzymes market is projected to increase from USD 505.6 million in 2025 to USD 838.6 million by 2035, expanding an absolute growth of USD 333 million and a CAGR of 5.2%.
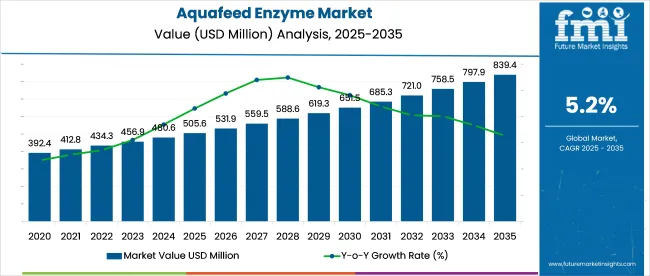
Quick Stats of Aquafeed Enzyme Market

  • Market Value (2025): USD 505.6 million
  • Forecast Value (2035): USD 838.6 million
  • Forecast CAGR (2025 to 2035): 5.2%
  • Leading Segment in 2025:Powder (61.5% share)
  • Key Growth Region: Asia Pacific (India is the fastest growing market with 6.0% CAGR)
  • Key Players: Kemin Industries, ADM Animal Nutrition, American Biosystem, Creative Enzymes, DSM (Koninklijke DSM N.V.), Hostazym X (Huvepharma), BASF SE (Nutrition BASF), Ab Vista, Weifang Yuexiang Chemical Co., Ltd., and ChaoyangStarzyme Bioengineering Co., Ltd

Aquafeed Enzyme Market

Attributes Description
Estimated Global Aquafeed Enzymes Industry Size (2025E) USD 505.6 million
Projected Global Aquafeed Enzymes Industry Value (2035F) USD 838.6 million
Value-based CAGR (2025 to 2035) 5.2%

More than 60% of this growth will be driven by Asia Pacific, primarily due to industrial-scale aquaculture expansion in China, India, Vietnam, and Indonesia. Countries in this region produced over 70% of global aquaculture output by volume in 2023, and enzyme use in pelleted and extruded feed has increased due to cost pressures caused by lower fishmeal inclusion.

In 2025, the industry holds 6.4% of the broader aquafeed market, which is valued at around USD 7.9 billion. Within the animal feed enzymes market, estimated at USD 2.9 billion, aquafeed enzymes account for roughly 17.4%, reflecting their niche yet expanding role. Against the total feed additives market, valued at USD 22.4 billion, aquafeed enzymes contribute just 2.3%.

Within the broader animal nutrition segment, estimated at USD 70 billion, their share is around 0.7%. When positioned against the global industrial enzymes market, projected at USD 20.3 billion in 2025, the share narrows to 2.5%. These figures highlight product as a fast-growing but relatively small subsegment, with growth driven by efficiency gains in aquaculture feed formulations.

The underlying driver is the shift from marine-based to plant-based feed ingredients. Enzymes like phytase have demonstrated up to 45% improved phosphorus digestibility, while protease inclusion has been shown to increase amino acid availability by 18-25% in shrimp and carp diets (DSM trials, 2024).

Feed accounts for up to 70% of operational costs in aquaculture, making enzyme use a cost-leveraging strategy. Between 2022 and 2024, enzyme penetration in aquafeed rose from 18% to 31% globally, with higher uptake in pelleted feed formats compared to mash or wet feeds. The reduction in nitrogen discharge through enzyme-aided digestion has become particularly relevant under new effluent restrictions introduced in ASEAN markets and pilot zoning projects in Latin America.

Analyzing Aquafeed Enzymes Market by Top Investment Segments

Phytase leads enzyme adoption due to its effectiveness in enhancing phosphorus absorption from plant-based feeds. Powder formulations dominate because of their stability and ease in large-scale feed production. Carps drive the highest enzyme demand, driven by volume-intensive farming in Asia using plant-derived feed inputs.
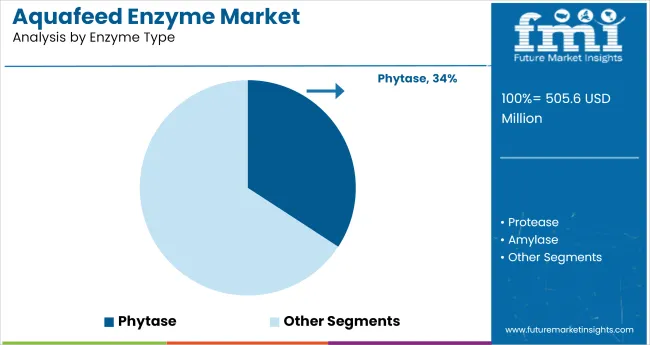
By Enzyme Type, Phytase Leading the Segment in 2025

Aquafeed Enzyme Market Analysis By Enzyme Type

Phytase registers the dominant share among enzyme types in the aquafeed enzymes market, accounting for 34.2% of total revenue in 2025. Its strong position is attributed to its proven role in improving phosphorus digestibility and reducing reliance on inorganic phosphorus supplements, which remain expensive and environmentally challenging.
  • Phytase enables aquaculture producers to increase nutrient absorption from plant-based feed inputs like soybean meal and rapeseed cake, which are high in phytate.
  • Phosphorus regulations tighten globally, and phytase adoption continues to accelerate, particularly in Asia Pacific and parts of Latin America.
  • Other enzymes, such as protease, amylase, and lipase, follow with smaller shares, with protease being increasingly used in shrimp and carnivorous fish feed for enhancing amino acid availability.

Powder Enzymes Dominate Due to Stability and Integration Compatibility

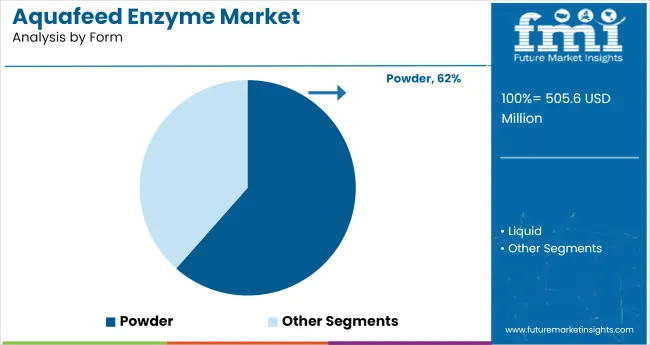
Aquafeed Enzyme Market Analysis By Form

Powder form leads the aquafeed enzymes market in 2025, capturing 61.5% of total value. Its dominance stems from superior shelf stability, ease of blending with dry compound feeds, and compatibility with heat-stable premix formulations used in pelleted or extruded feeds.
  • Powder enzymes are preferred in large-scale commercial aquafeed mills where uniformity, storage life, and controlled-release action are prioritized.
  • Liquid enzymes are gaining traction in modular on-farm systems, though adoption is limited by moisture sensitivity and the need for specialized handling infrastructure.
  • Powder-based enzyme products also reduce transport costs per unit of activity, making them more economical for global distribution.

By Aquatic Animal, Carps Lead on Account of Volume-Driven Feed Enzyme Consumption

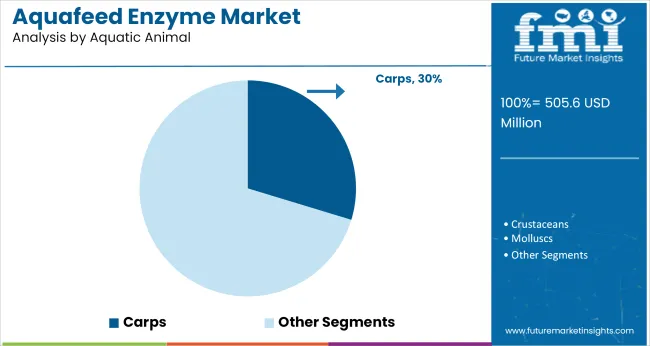
Aquafeed Enzyme Market Analysis By Aquatic Animal

Carps represent the leading segment in the aquafeed enzymes market for 2025, accounting for roughly 29.7% of total demand. Their dominance is linked not to value per unit but to the vast scale of carp aquaculture, particularly in China, India, and Bangladesh, regions that collectively produce over 50% of global aquaculture output by volume.

  • Carps are traditionally raised using plant-based feeds, which require enzymes like phytase and carbohydrase to enhance nutrient absorption and offset the limitations of low-digestibility ingredients.
  • Given the low-margin economics of carp farming, enzyme inclusion becomes critical to reduce feed conversion ratios and maximize protein uptake.
  • Compared to high-value species like salmon, carp feed sees broader application of enzyme blends at scale, despite lower per-unit pricing.

Top Aquafeed Enzymes Market Dynamics

Rising use of plant-based feed and cost pressures are driving phytase adoption to improve nutrient absorption and reduce fishmeal reliance. Regulatory limits on effluent discharge and demand for standardized feed have further accelerated enzyme use in commercial aquaculture systems.

Phytate Degradation and Nutrient Optimization Drive Adoption

The growing shift toward plant-based aquafeed inputs has intensified demand for enzyme supplementation, particularly phytase, which improves phosphorus bioavailability and offsets expensive inorganic additives.

Feed cost reduction through higher nutrient utilization remains a top priority for commercial producers managing large aquatic stocks. Enzymes also help reduce anti-nutritional factors that impair digestion in fish and shrimp, particularly in low-fishmeal diets. This technical advantage supports broader enzyme integration across major aquaculture systems.

  • Phytase cuts dependence on inorganic phosphorus by improving phytate breakdown
  • Enhanced amino acid and starch digestibility improves feed conversion ratios
  • Enzyme use reduces reliance on high-cost fishmeal alternatives

Environmental Compliance and Commercial Feed Standardization Boost Use

Tightening effluent discharge regulations across Asia and Europe have accelerated the uptake of enzymes, especially in intensive aquaculture farms with measurable nutrient outputs. Producers view enzymes as a non-chemical intervention to reduce nitrogen and phosphorus waste in water bodies.

At the same time, the need for standardized commercial feeds has pushed feed mills to incorporate powder-form enzymes that are heat-stable and easily dosed during extrusion. These factors together strengthen the case for enzymes as a long-term cost and compliance tool.

  • Enzymes reduce environmental loading from aquaculture effluents
  • Powder enzymes allow precision blending in extruded feed formats
  • Regulations are triggering faster enzyme uptake in high-output regions

Top Countries Manufacturing, Distributing, and Scaling Demand for Aquafeed Enzymes

Countries CAGR (2025 to 2035)
United States 4.9%
Germany 5.1%
Japan 5.0%
China 5.6%
India 6.0%

The aquafeed enzymes market is projected to grow at a global CAGR of 5.2% between 2025 and 2035, though regional dynamics show sharper contrasts. China, a BRICS nation, leads with 6.7% CAGR, supported by its dominance in fish and shrimp aquaculture and government-backed research in enzyme-enhanced feed conversion. India follows closely at 6.3%, driven by the expansion of pangasius and carp farming and rising demand for cost-efficient feed with better protein digestibility.

ASEAN countries such as Vietnam and Indonesia average 5.8%, slightly above the global benchmark, due to export-focused shrimp farming and incentives for non-antibiotic feed systems. In contrast, OECD countries like Norway and the United States post slower growth, 4.5% and 4.1% respectively, owing to feed regulation complexity and slower reformulation cycles in the salmon and trout segments. This regional divergence highlights how emerging markets are using enzymes to lower input costs and optimize yield, while mature markets move cautiously under tight compliance.

The report covers a detailed analysis of 40+ countries, and the top five countries have been shared as a reference.

Growth Analysis of the Aquafeed Enzymes Market in the United States

The USA Aquafeed Enzymes market is estimated to grow at 4.9% CAGR during the study period.Growth in the United States is being guided by the commercial-scale adoption of functional feed technologies in aquaculture operations. While finfish production, such as trout and catfish, dominates domestic output, a notable shift toward species-specific feed formulation has created room for enzyme customization.

USA-based feed manufacturers are leveraging enzyme blends like phytase and protease to support the growth of high-protein, plant-based diets for freshwater and marine species. Environmental compliance under Clean Water Act revisions has pressured operators to lower phosphorus and nitrogen discharge, where enzymes offer a cost-effective compliance tool. Consolidation across feed mills is also driving a move toward standardized enzyme application in extruded feed.

  • Enzyme adoption supports phosphorus management under the EPA nutrient discharge regulations
  • Protease use is rising in diets for carnivorous species like trout and hybrid striped bass
  • Strategic alliances between enzyme developers and aquafeed firms enhance formulation efficiency

Future Outlook for the Aquafeed Enzymes Market in Germany

Germany’s Aquafeed Enzymes market is projected to expand at a 5.1% CAGR from 2025 to 2035.Germany’s aquafeed enzymes demand is increasing steadily, driven by the country’s compliance with EU nitrogen discharge caps andaquaculture certification schemes. With recirculating aquaculture systems (RAS) gaining ground, especially for salmonids and perch, enzyme use is becoming integral in reducing sludge buildup and optimizing nutrient use in closed-loop systems.

The country imports a large portion of its aquafeed, but domestic blending operations have increasingly turned to enzyme-integrated formulations to improve the digestibility of high-fiber ingredients like wheat middlings and rapeseed meal. Regulatory incentives under Germany’s Blue Bioeconomy strategy also support the integration of enzymes into compound feeds for inland aquaculture.

  • Aquafeed producers integrate enzymes to meet EU water quality directives
  • Enzyme supplementation enhances feed efficiency in RAS-based aquaculture
  • Domestic demand is favoring enzyme compatibility with local feedstocks like rapeseed

Demand Forecast for the Aquafeed Enzymes Market in China

China’s Aquafeed Enzymes market is forecast to grow at a CAGR of 5.6% through 2035.China remains the world’s largest aquaculture producer, and enzyme use in aquafeed is rising as plant-based feed inputs increase and fishmeal dependency declines. Feed manufacturers are responding to policy goals under China’s Aquaculture Green Development Plan, which encourages nutrient-efficient and environmentally friendly feed.

With carp, tilapia, and catfish dominating freshwater systems, enzymes such as phytase and carbohydrase are widely deployed to improve phosphorus and fiber utilization from soybean meal and cottonseed cake. Industrial feed plants in provinces like Guangdong and Hubei are moving toward automatic dosing systems for enzymes, supporting scale-up and consistency. The presence of regional feed centers has also accelerated enzyme formulation R&D.

  • Government policy promotes enzyme use to support green aquaculture transitions
  • Feed enzymes address nutrient uptake issues in soybean- and cotton-based feeds
  • Manufacturing hubs are expanding enzyme-enabled feed processing infrastructure

Aquafeed Enzymes Market Growth Outlook in Japan

Japan’s Aquafeed Enzymes market is expected to grow at 5.0% CAGR during the forecast period. In Japan, enzyme inclusion in aquafeed is gaining ground as producers focus on improving feed conversion ratios in high-value marine species like amberjack, sea bream, and eel.

Domestic aquaculture is constrained by limited coastline and rising feed costs, leading to the adoption of precision-formulated diets where enzymes play a critical role in maximizing nutrient uptake. Japan’s Ministry of Agriculture, Forestry and Fisheries has backed enzyme trials under its Aquatic Resource Sustainability framework, promoting their use in low-impact feed production. The country’s aquafeed manufacturers have also started exporting enzyme-based diets to Southeast Asia, extending the influence of their feed.

  • Enzyme-enriched feeds reduce protein wastage in high-value marine finfish
  • Government support boosts R&D for enzyme integration in marine aquaculture
  • Rising exports of Japanese-formulated feeds create external demand for enzyme products

Analysis of the Aquafeed Enzymes Market in India

India’s Aquafeed Enzymes market is on track to grow at 6.0% CAGR through 2035.India is registering the highest growth among major aquafeed enzyme markets, driven by its expanding shrimp and freshwater fish farming sectors.

As the country pushes to double its aquaculture output under the PMMSY (Pradhan MantriMatsyaSampadaYojana), feed conversion efficiency has become critical. Enzymes like protease, xylanase, and phytase are being widely integrated into both pelleted and extruded feeds to offset the challenges of digesting rice bran, maize, and cottonseed meal.

Domestic feed manufacturers, especially in Andhra Pradesh and Tamil Nadu, are collaborating with international enzyme providers to introduce thermo-stable and species-specific enzyme blends. Awareness campaigns around non-antibiotic growth strategies have also promoted enzyme use.
  • Enzyme use supports protein uptake in low-fishmeal, grain-heavy diets
  • Government-led aquaculture expansion is triggering higher enzyme demand
  • Regional feed producers are aligning with enzyme firms for customized solutions

Leading Aquafeed Enzymes Suppliers

Aquafeed Enzyme Market Analysis By Company

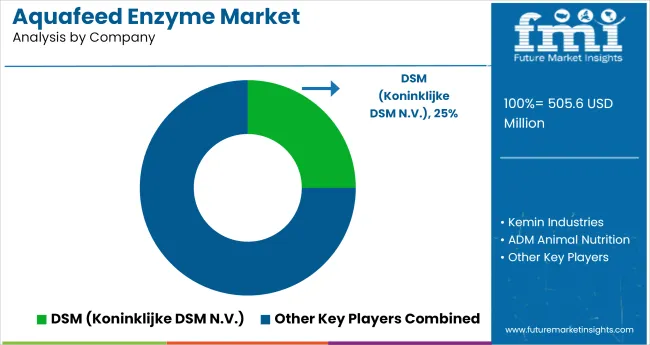
In the aquafeed enzymes market, key suppliers are advancing growth by aligning enzymes with aquaculture-specific feed challenges. Companies such as Kemin Industries, DSM, and BASF SE are leading with thermo-stable enzyme solutions designed for high-temperature extrusion processes. Ab Vista and Huvepharma are focusing on gut-specific enzyme targeting, catering to shrimp and carp farming systems in Asia.

ADM Animal Nutrition and American Biosystem support large-scale feed mill integration via pre-mixed enzyme complexes, improving feed conversion ratios. Chinese players like Weifang Yuexiang and Chaoyang Starzyme are expanding mid-tier access with cost-effective solutions.

Creative Enzymes is carving a niche through tailored protease formulations. Competitive dynamics are shaped by IP in enzyme stability, strategic feed partnerships, and compliance with regional nutrient discharge regulations.

Recent Aquafeed Enzymes Industry News

  • In February 2025, DSM-Firmenich announced it had reached an agreement with Novones is to dissolve the Feed Enzyme Alliance, with Novones is acquiring DSM-Firmenich’s share for EUR 1.5 billion in cash.

Leading Players

  • Kemin Industries
  • ADM Animal Nutrition
  • American Biosystem
  • Creative Enzymes
  • DSM (Koninklijke DSM N.V.)
  • Hostazym X (Huvepharma)
  • BASF SE (Nutrition BASF)
  • Ab Vista
  • Weifang Yuexiang Chemical Co., Ltd.
  • ChaoyangStarzyme Bioengineering Co.,Ltd

Report Coverage and Scope Summary

Report Attributes Details
Market Size (2025) USD 505.6 million
Projected Market Size (2035) USD 838.6 million
CAGR (2025 to 2035) 5.2%
Base Year for Estimation 2024
Historical Period 2020 to 2024
Projections Period 2025 to 2035
Quantitative Units USD million for value and volume in metric tons
Enzyme Type Analyzed (Segment 1) Protease, Amylase, Lipase, Non-Starch Polysaccharidases, Phytase, Glucose Oxidase, and Lysozyme.
Form Analyzed (Segment 2) Liquid and Powder.
Aquatic Animal Analyzed (Segment 3) Carps, Crustaceans, Molluscs, Tilapias, Catfish, Salmon, and Others ( Sturgeons and Paddlefishes)
Regions Covered North America, Europe, Asia Pacific, Middle East & Africa, Latin America
Countries Covered United States, Canada, Germany, United Kingdom, France, Italy, Spain, China, Japan, South Korea, India, Australia, Brazil, Mexico, Argentina, Saudi Arabia, UAE, South Africa
Key Players Kemin Industries, ADM Animal Nutrition, American Biosystem, Creative Enzymes, DSM (Koninklijke DSM N.V.), Hostazym X (Huvepharma), BASF SE (Nutrition BASF), Ab Vista, Weifang Yuexiang Chemical Co., Ltd., and Chaoyang Starzyme Bioengineering Co., Ltd
Additional Attributes Dollar sales, volume demand, regional share, pricing benchmarks, enzyme adoption by species, feed format compatibility, regulatory trends, formulation partnerships, capacity expansions, competitive share, and projected CAGR.

Key Segmentation

By Enzyme Type:

The industry is segmented into protease, amylase, lipase, non-starch polysaccharidases, phytase, glucose oxidase, and lysozyme.

By Form:

The industry is segmented into liquid and powder.

By Aquatic Animal:

The industry finds carps, crustaceans, molluscs, tilapias, catfish, salmon, and others (sturgeons and paddlefishes)

By Region:

The industry covers regions including North America, Europe, Asia Pacific, Latin America, and the Middle East & Africa.

Table of Content

  1. Executive Summary
    • Global Market Outlook
    • Demand-side Trends
    • Supply-side Trends
    • Technology Roadmap Analysis
    • Analysis and Recommendations
  2. Market Overview
    • Market Coverage/Taxonomy
    • Market Definition/Scope/Limitations
  3. Market Background
    • Market Dynamics
      • Drivers
      • Restraints
      • Opportunity
      • Trends
    • Scenario Forecast
      • Demand in Optimistic Scenario
      • Demand in Likely Scenario
      • Demand in Conservative Scenario
    • Opportunity Map Analysis
    • Product Life Cycle Analysis
    • Supply Chain Analysis
      • Supply Side Participants and their Roles
        • Producers
        • Mid-Level Participants (Traders/Agents/Brokers)
        • Wholesalers and Distributors
      • Value Added and Value Created at Node in the Supply Chain
      • List of Raw Material Suppliers
      • List of Existing and Potential Buyer’s
    • Investment Feasibility Matrix
    • Value Chain Analysis
      • Profit Margin Analysis
      • Wholesalers and Distributors
      • Retailers
    • PESTLE and Porter’s Analysis
    • Regulatory Landscape
      • By Key Regions
      • By Key Countries
    • Regional Parent Market Outlook
    • Production and Consumption Statistics
    • Import and Export Statistics
  4. Global Market Analysis 2020 to 2024 and Forecast, 2025 to 2035
    • Historical Market Size Value (USD Million) & Volume (Metric tons) Analysis, 2020 to 2024
    • Current and Future Market Size Value (USD Million) & Volume (Metric tons) Projections, 2025 to 2035
      • Y-o-Y Growth Trend Analysis
      • Absolute $ Opportunity Analysis
  5. Global Market Pricing Analysis 2020 to 2024 and Forecast 2025 to 2035
  6. Global Market Analysis 2020 to 2024 and Forecast 2025 to 2035, By Enzyme Type
    • Introduction/Key Findings
    • Historical Market Size Value (USD Million) & Volume (Metric tons) Analysis By Enzyme Type, 2020 to 2024
    • Current and Future Market Size Value (USD Million) & Volume (Metric tons) Analysis and Forecast By Enzyme Type, 2025 to 2035
      • Protease
      • Amylase
      • Lipase
      • Non-starch polysaccharidases
      • Phytase
      • glucose
      • Oxidase
      • Lysozyme
    • Y-o-Y Growth Trend Analysis By Enzyme Type, 2020 to 2024
    • Absolute $ Opportunity Analysis By Enzyme Type, 2025 to 2035
  7. Global Market Analysis 2020 to 2024 and Forecast 2025 to 2035, By Form
    • Introduction/Key Findings
    • Historical Market Size Value (USD Million) & Volume (Metric tons) Analysis By Form, 2020 to 2024
    • Current and Future Market Size Value (USD Million) & Volume (Metric tons) Analysis and Forecast By Form, 2025 to 2035
      • Liquid
      • Powder
    • Y-o-Y Growth Trend Analysis By Form, 2020 to 2024
    • Absolute $ Opportunity Analysis By Form, 2025 to 2035
  8. Global Market Analysis 2020 to 2024 and Forecast 2025 to 2035, By Aquatic Animal
    • Introduction/Key Findings
    • Historical Market Size Value (USD Million) & Volume (Metric tons) Analysis By Aquatic Animal, 2020 to 2024
    • Current and Future Market Size Value (USD Million) & Volume (Metric tons) Analysis and Forecast By Aquatic Animal, 2025 to 2035
      • Carps
      • Crustaceans
      • Molluscs
      • Tilapias
      • Catfish
      • Salmon
      • Others
        • Sturgeons
        • Paddlefishes
    • Y-o-Y Growth Trend Analysis By Aquatic Animal, 2020 to 2024
    • Absolute $ Opportunity Analysis By Aquatic Animal, 2025 to 2035
  9. Global Market Analysis 2020 to 2024 and Forecast 2025 to 2035, By Region
    • Introduction
    • Historical Market Size Value (USD Million) & Volume (Metric tons) Analysis By Region, 2020 to 2024
    • Current Market Size Value (USD Million) & Volume (Metric tons) Analysis and Forecast By Region, 2025 to 2035
      • North America
      • Latin America
      • Western Europe
      • Eastern Europe
      • East Asia
      • South Asia & Pacific
      • Middle East and Africa
    • Market Attractiveness Analysis By Region
  10. North America Market Analysis 2020 to 2024 and Forecast 2025 to 2035, By Country
    • Historical Market Size Value (USD Million) & Volume (Metric tons) Trend Analysis By Market Taxonomy, 2020 to 2024
    • Market Size Value (USD Million) & Volume (Metric tons) Forecast By Market Taxonomy, 2025 to 2035
      • By Country
        • USA
        • Canada
        • Mexico
      • By Enzyme Type
      • By Form
      • By Aquatic Animal
    • Market Attractiveness Analysis
      • By Country
      • By Enzyme Type
      • By Form
      • By Aquatic Animal
    • Key Takeaways
  11. Latin America Market Analysis 2020 to 2024 and Forecast 2025 to 2035, By Country
    • Historical Market Size Value (USD Million) & Volume (Metric tons) Trend Analysis By Market Taxonomy, 2020 to 2024
    • Market Size Value (USD Million) & Volume (Metric tons) Forecast By Market Taxonomy, 2025 to 2035
      • By Country
        • Brazil
        • Argentina
        • Rest of LATAM
      • By Enzyme Type
      • By Form
      • By Aquatic Animal
    • Market Attractiveness Analysis
      • By Country
      • By Enzyme Type
      • By Form
      • By Aquatic Animal
    • Key Takeaways
  12. Western Europe Market Analysis 2020 to 2024 and Forecast 2025 to 2035, By Country
    • Historical Market Size Value (USD Million) & Volume (Metric tons) Trend Analysis By Market Taxonomy, 2020 to 2024
    • Market Size Value (USD Million) & Volume (Metric tons) Forecast By Market Taxonomy, 2025 to 2035
      • By Country
        • Germany
        • Italy
        • France
        • UK
        • Spain
        • BENELUX
        • Nordic
        • Rest of W.Europe
      • By Enzyme Type
      • By Form
      • By Aquatic Animal
    • Market Attractiveness Analysis
      • By Country
      • By Enzyme Type
      • By Form
      • By Aquatic Animal
    • Key Takeaways
  13. Eastern Europe Market Analysis 2020 to 2024 and Forecast 2025 to 2035, By Country
    • Historical Market Size Value (USD Million) & Volume (Metric tons) Trend Analysis By Market Taxonomy, 2020 to 2024
    • Market Size Value (USD Million) & Volume (Metric tons) Forecast By Market Taxonomy, 2025 to 2035
      • By Country
        • Russia
        • Hungary
        • Poland
        • Balkan & Baltics
        • Rest of E. Europe
      • By Enzyme Type
      • By Form
      • By Aquatic Animal
    • Market Attractiveness Analysis
      • By Country
      • By Enzyme Type
      • By Form
      • By Aquatic Animal
    • Key Takeaways
  14. East Asia Market Analysis 2020 to 2024 and Forecast 2025 to 2035, By Country
    • Historical Market Size Value (USD Million) & Volume (Metric tons) Trend Analysis By Market Taxonomy, 2020 to 2024
    • Market Size Value (USD Million) & Volume (Metric tons) Forecast By Market Taxonomy, 2025 to 2035
      • By Country
        • China
        • Japan
        • South Korea
      • By Enzyme Type
      • By Form
      • By Aquatic Animal
    • Market Attractiveness Analysis
      • By Country
      • By Enzyme Type
      • By Form
      • By Aquatic Animal
    • Key Takeaways
  15. South Asia & Pacific Market Analysis 2020 to 2024 and Forecast 2025 to 2035, By Country
    • Historical Market Size Value (USD Million) & Volume (Metric tons) Trend Analysis By Market Taxonomy, 2020 to 2024
    • Market Size Value (USD Million) & Volume (Metric tons) Forecast By Market Taxonomy, 2025 to 2035
      • By Country
        • India
        • Australia & New Zealand
        • ASEAN
        • Rest of SAP
      • By Enzyme Type
      • By Form
      • By Aquatic Animal
    • Market Attractiveness Analysis
      • By Country
      • By Enzyme Type
      • By Form
      • By Aquatic Animal
    • Key Takeaways
  16. Middle East and Africa Market Analysis 2020 to 2024 and Forecast 2025 to 2035, By Country
    • Historical Market Size Value (USD Million) & Volume (Metric tons) Trend Analysis By Market Taxonomy, 2020 to 2024
    • Market Size Value (USD Million) & Volume (Metric tons) Forecast By Market Taxonomy, 2025 to 2035
      • By Country
        • GCC Countries
        • Northern Africa
        • South Africa
        • Turkiye
        • Rest of MEA
      • By Enzyme Type
      • By Form
      • By Aquatic Animal
    • Market Attractiveness Analysis
      • By Country
      • By Enzyme Type
      • By Form
      • By Aquatic Animal
    • Key Takeaways
  17. Key Countries Market Analysis
    • USA
      • Pricing Analysis
      • Market Share Analysis, 2024
        • By Enzyme Type
        • By Form
        • By Aquatic Animal
    • Canada
      • Pricing Analysis
      • Market Share Analysis, 2024
        • By Enzyme Type
        • By Form
        • By Aquatic Animal
    • Brazil
      • Pricing Analysis
      • Market Share Analysis, 2024
        • By Enzyme Type
        • By Form
        • By Aquatic Animal
    • Mexico
      • Pricing Analysis
      • Market Share Analysis, 2024
        • By Enzyme Type
        • By Form
        • By Aquatic Animal
    • Argentina
      • Pricing Analysis
      • Market Share Analysis, 2024
        • By Enzyme Type
        • By Form
        • By Aquatic Animal
  18. Market Structure Analysis
    • Competition Dashboard
    • Competition Benchmarking
    • Market Share Analysis of Top Players
      • By Regional
      • By Enzyme Type
      • By Form
      • By Aquatic Animal
  19. Competition Analysis
    • Competition Deep Dive
      • Kemin Industries
        • Overview
        • Product Portfolio
        • Profitability by Market Segments (Product/Age/Sales Channel/Region)
        • Sales Footprint
        • Strategy Overview
          • Marketing Strategy
          • Product Strategy
          • Channel Strategy
      • ADM Animal Nutrition
        • Overview
        • Product Portfolio
        • Profitability by Market Segments (Product/Age/Sales Channel/Region)
        • Sales Footprint
        • Strategy Overview
          • Marketing Strategy
          • Product Strategy
          • Channel Strategy
      • American Biosystem
        • Overview
        • Product Portfolio
        • Profitability by Market Segments (Product/Age/Sales Channel/Region)
        • Sales Footprint
        • Strategy Overview
          • Marketing Strategy
          • Product Strategy
          • Channel Strategy
      • Creative Enzymes
        • Overview
        • Product Portfolio
        • Profitability by Market Segments (Product/Age/Sales Channel/Region)
        • Sales Footprint
        • Strategy Overview
          • Marketing Strategy
          • Product Strategy
          • Channel Strategy
      • DSM (Koninklijke DSM N.V.)
        • Overview
        • Product Portfolio
        • Profitability by Market Segments (Product/Age/Sales Channel/Region)
        • Sales Footprint
        • Strategy Overview
          • Marketing Strategy
          • Product Strategy
          • Channel Strategy
      • Hostazym X (Huvepharma)
        • Overview
        • Product Portfolio
        • Profitability by Market Segments (Product/Age/Sales Channel/Region)
        • Sales Footprint
        • Strategy Overview
          • Marketing Strategy
          • Product Strategy
          • Channel Strategy
      • BASF SE (Nutrition BASF)
        • Overview
        • Product Portfolio
        • Profitability by Market Segments (Product/Age/Sales Channel/Region)
        • Sales Footprint
        • Strategy Overview
          • Marketing Strategy
          • Product Strategy
          • Channel Strategy
      • Ab Vista
        • Overview
        • Product Portfolio
        • Profitability by Market Segments (Product/Age/Sales Channel/Region)
        • Sales Footprint
        • Strategy Overview
          • Marketing Strategy
          • Product Strategy
          • Channel Strategy
      • Weifang Yuexiang Chemical Co., Ltd.
        • Overview
        • Product Portfolio
        • Profitability by Market Segments (Product/Age/Sales Channel/Region)
        • Sales Footprint
        • Strategy Overview
          • Marketing Strategy
          • Product Strategy
          • Channel Strategy
      • Chaoyang Starzyme Bioengineering Co.,Ltd
        • Overview
        • Product Portfolio
        • Profitability by Market Segments (Product/Age/Sales Channel/Region)
        • Sales Footprint
        • Strategy Overview
          • Marketing Strategy
          • Product Strategy
          • Channel Strategy
  20. Assumptions & Acronyms Used
  21. Research Methodology

List of Tables

  • Table 1: Global Market Value (USD Million) Forecast by Region, 2020-2035
  • Table 2: Global Market Volume (Metric tons) Forecast by Region, 2020-2035
  • Table 3: Global Market Value (USD Million) Forecast by Enzyme Type, 2020-2035
  • Table 4: Global Market Volume (Metric tons) Forecast by Enzyme Type, 2020-2035
  • Table 5: Global Market Value (USD Million) Forecast by Form, 2020-2035
  • Table 6: Global Market Volume (Metric tons) Forecast by Form, 2020-2035
  • Table 7: Global Market Value (USD Million) Forecast by Aquatic Animal, 2020-2035
  • Table 8: Global Market Volume (Metric tons) Forecast by Aquatic Animal, 2020-2035
  • Table 9: North America Market Value (USD Million) Forecast by Country, 2020-2035
  • Table 10: North America Market Volume (Metric tons) Forecast by Country, 2020-2035
  • Table 11: North America Market Value (USD Million) Forecast by Enzyme Type, 2020-2035
  • Table 12: North America Market Volume (Metric tons) Forecast by Enzyme Type, 2020-2035
  • Table 13: North America Market Value (USD Million) Forecast by Form, 2020-2035
  • Table 14: North America Market Volume (Metric tons) Forecast by Form, 2020-2035
  • Table 15: North America Market Value (USD Million) Forecast by Aquatic Animal, 2020-2035
  • Table 16: North America Market Volume (Metric tons) Forecast by Aquatic Animal, 2020-2035
  • Table 17: Latin America Market Value (USD Million) Forecast by Country, 2020-2035
  • Table 18: Latin America Market Volume (Metric tons) Forecast by Country, 2020-2035
  • Table 19: Latin America Market Value (USD Million) Forecast by Enzyme Type, 2020-2035
  • Table 20: Latin America Market Volume (Metric tons) Forecast by Enzyme Type, 2020-2035
  • Table 21: Latin America Market Value (USD Million) Forecast by Form, 2020-2035
  • Table 22: Latin America Market Volume (Metric tons) Forecast by Form, 2020-2035
  • Table 23: Latin America Market Value (USD Million) Forecast by Aquatic Animal, 2020-2035
  • Table 24: Latin America Market Volume (Metric tons) Forecast by Aquatic Animal, 2020-2035
  • Table 25: Western Europe Market Value (USD Million) Forecast by Country, 2020-2035
  • Table 26: Western Europe Market Volume (Metric tons) Forecast by Country, 2020-2035
  • Table 27: Western Europe Market Value (USD Million) Forecast by Enzyme Type, 2020-2035
  • Table 28: Western Europe Market Volume (Metric tons) Forecast by Enzyme Type, 2020-2035
  • Table 29: Western Europe Market Value (USD Million) Forecast by Form, 2020-2035
  • Table 30: Western Europe Market Volume (Metric tons) Forecast by Form, 2020-2035
  • Table 31: Western Europe Market Value (USD Million) Forecast by Aquatic Animal, 2020-2035
  • Table 32: Western Europe Market Volume (Metric tons) Forecast by Aquatic Animal, 2020-2035
  • Table 33: Eastern Europe Market Value (USD Million) Forecast by Country, 2020-2035
  • Table 34: Eastern Europe Market Volume (Metric tons) Forecast by Country, 2020-2035
  • Table 35: Eastern Europe Market Value (USD Million) Forecast by Enzyme Type, 2020-2035
  • Table 36: Eastern Europe Market Volume (Metric tons) Forecast by Enzyme Type, 2020-2035
  • Table 37: Eastern Europe Market Value (USD Million) Forecast by Form, 2020-2035
  • Table 38: Eastern Europe Market Volume (Metric tons) Forecast by Form, 2020-2035
  • Table 39: Eastern Europe Market Value (USD Million) Forecast by Aquatic Animal, 2020-2035
  • Table 40: Eastern Europe Market Volume (Metric tons) Forecast by Aquatic Animal, 2020-2035
  • Table 41: East Asia Market Value (USD Million) Forecast by Country, 2020-2035
  • Table 42: East Asia Market Volume (Metric tons) Forecast by Country, 2020-2035
  • Table 43: East Asia Market Value (USD Million) Forecast by Enzyme Type, 2020-2035
  • Table 44: East Asia Market Volume (Metric tons) Forecast by Enzyme Type, 2020-2035
  • Table 45: East Asia Market Value (USD Million) Forecast by Form, 2020-2035
  • Table 46: East Asia Market Volume (Metric tons) Forecast by Form, 2020-2035
  • Table 47: East Asia Market Value (USD Million) Forecast by Aquatic Animal, 2020-2035
  • Table 48: East Asia Market Volume (Metric tons) Forecast by Aquatic Animal, 2020-2035
  • Table 49: South Asia & Pacific Market Value (USD Million) Forecast by Country, 2020-2035
  • Table 50: South Asia & Pacific Market Volume (Metric tons) Forecast by Country, 2020-2035
  • Table 51: South Asia & Pacific Market Value (USD Million) Forecast by Enzyme Type, 2020-2035
  • Table 52: South Asia & Pacific Market Volume (Metric tons) Forecast by Enzyme Type, 2020-2035
  • Table 53: South Asia & Pacific Market Value (USD Million) Forecast by Form, 2020-2035
  • Table 54: South Asia & Pacific Market Volume (Metric tons) Forecast by Form, 2020-2035
  • Table 55: South Asia & Pacific Market Value (USD Million) Forecast by Aquatic Animal, 2020-2035
  • Table 56: South Asia & Pacific Market Volume (Metric tons) Forecast by Aquatic Animal, 2020-2035
  • Table 57: Middle East and Africa Market Value (USD Million) Forecast by Country, 2020-2035
  • Table 58: Middle East and Africa Market Volume (Metric tons) Forecast by Country, 2020-2035
  • Table 59: Middle East and Africa Market Value (USD Million) Forecast by Enzyme Type, 2020-2035
  • Table 60: Middle East and Africa Market Volume (Metric tons) Forecast by Enzyme Type, 2020-2035
  • Table 61: Middle East and Africa Market Value (USD Million) Forecast by Form, 2020-2035
  • Table 62: Middle East and Africa Market Volume (Metric tons) Forecast by Form, 2020-2035
  • Table 63: Middle East and Africa Market Value (USD Million) Forecast by Aquatic Animal, 2020-2035
  • Table 64: Middle East and Africa Market Volume (Metric tons) Forecast by Aquatic Animal, 2020-2035

List of Figures

  • Figure 1: Global Market Volume (Metric tons) Forecast 2020-2035
  • Figure 2: Global Market Pricing Analysis
  • Figure 3: Global Market Value (USD Million) Forecast 2020-2035
  • Figure 4: Global Market Value Share and BPS Analysis by Enzyme Type, 2025 and 2035
  • Figure 5: Global Market Y-o-Y Growth Comparison by Enzyme Type, 2025-2035
  • Figure 6: Global Market Attractiveness Analysis by Enzyme Type
  • Figure 7: Global Market Value Share and BPS Analysis by Form, 2025 and 2035
  • Figure 8: Global Market Y-o-Y Growth Comparison by Form, 2025-2035
  • Figure 9: Global Market Attractiveness Analysis by Form
  • Figure 10: Global Market Value Share and BPS Analysis by Aquatic Animal, 2025 and 2035
  • Figure 11: Global Market Y-o-Y Growth Comparison by Aquatic Animal, 2025-2035
  • Figure 12: Global Market Attractiveness Analysis by Aquatic Animal
  • Figure 13: Global Market Value (USD Million) Share and BPS Analysis by Region, 2025 and 2035
  • Figure 14: Global Market Y-o-Y Growth Comparison by Region, 2025-2035
  • Figure 15: Global Market Attractiveness Analysis by Region
  • Figure 16: North America Market Incremental $ Opportunity, 2025-2035
  • Figure 17: Latin America Market Incremental $ Opportunity, 2025-2035
  • Figure 18: Western Europe Market Incremental $ Opportunity, 2025-2035
  • Figure 19: Eastern Europe Market Incremental $ Opportunity, 2025-2035
  • Figure 20: East Asia Market Incremental $ Opportunity, 2025-2035
  • Figure 21: South Asia & Pacific Market Incremental $ Opportunity, 2025-2035
  • Figure 22: Middle East and Africa Market Incremental $ Opportunity, 2025-2035
  • Figure 23: North America Market Value Share and BPS Analysis by Country, 2025 and 2035
  • Figure 24: North America Market Value Share and BPS Analysis by Enzyme Type, 2025 and 2035
  • Figure 25: North America Market Y-o-Y Growth Comparison by Enzyme Type, 2025-2035
  • Figure 26: North America Market Attractiveness Analysis by Enzyme Type
  • Figure 27: North America Market Value Share and BPS Analysis by Form, 2025 and 2035
  • Figure 28: North America Market Y-o-Y Growth Comparison by Form, 2025-2035
  • Figure 29: North America Market Attractiveness Analysis by Form
  • Figure 30: North America Market Value Share and BPS Analysis by Aquatic Animal, 2025 and 2035
  • Figure 31: North America Market Y-o-Y Growth Comparison by Aquatic Animal, 2025-2035
  • Figure 32: North America Market Attractiveness Analysis by Aquatic Animal
  • Figure 33: Latin America Market Value Share and BPS Analysis by Country, 2025 and 2035
  • Figure 34: Latin America Market Value Share and BPS Analysis by Enzyme Type, 2025 and 2035
  • Figure 35: Latin America Market Y-o-Y Growth Comparison by Enzyme Type, 2025-2035
  • Figure 36: Latin America Market Attractiveness Analysis by Enzyme Type
  • Figure 37: Latin America Market Value Share and BPS Analysis by Form, 2025 and 2035
  • Figure 38: Latin America Market Y-o-Y Growth Comparison by Form, 2025-2035
  • Figure 39: Latin America Market Attractiveness Analysis by Form
  • Figure 40: Latin America Market Value Share and BPS Analysis by Aquatic Animal, 2025 and 2035
  • Figure 41: Latin America Market Y-o-Y Growth Comparison by Aquatic Animal, 2025-2035
  • Figure 42: Latin America Market Attractiveness Analysis by Aquatic Animal
  • Figure 43: Western Europe Market Value Share and BPS Analysis by Country, 2025 and 2035
  • Figure 44: Western Europe Market Value Share and BPS Analysis by Enzyme Type, 2025 and 2035
  • Figure 45: Western Europe Market Y-o-Y Growth Comparison by Enzyme Type, 2025-2035
  • Figure 46: Western Europe Market Attractiveness Analysis by Enzyme Type
  • Figure 47: Western Europe Market Value Share and BPS Analysis by Form, 2025 and 2035
  • Figure 48: Western Europe Market Y-o-Y Growth Comparison by Form, 2025-2035
  • Figure 49: Western Europe Market Attractiveness Analysis by Form
  • Figure 50: Western Europe Market Value Share and BPS Analysis by Aquatic Animal, 2025 and 2035
  • Figure 51: Western Europe Market Y-o-Y Growth Comparison by Aquatic Animal, 2025-2035
  • Figure 52: Western Europe Market Attractiveness Analysis by Aquatic Animal
  • Figure 53: Eastern Europe Market Value Share and BPS Analysis by Country, 2025 and 2035
  • Figure 54: Eastern Europe Market Value Share and BPS Analysis by Enzyme Type, 2025 and 2035
  • Figure 55: Eastern Europe Market Y-o-Y Growth Comparison by Enzyme Type, 2025-2035
  • Figure 56: Eastern Europe Market Attractiveness Analysis by Enzyme Type
  • Figure 57: Eastern Europe Market Value Share and BPS Analysis by Form, 2025 and 2035
  • Figure 58: Eastern Europe Market Y-o-Y Growth Comparison by Form, 2025-2035
  • Figure 59: Eastern Europe Market Attractiveness Analysis by Form
  • Figure 60: Eastern Europe Market Value Share and BPS Analysis by Aquatic Animal, 2025 and 2035
  • Figure 61: Eastern Europe Market Y-o-Y Growth Comparison by Aquatic Animal, 2025-2035
  • Figure 62: Eastern Europe Market Attractiveness Analysis by Aquatic Animal
  • Figure 63: East Asia Market Value Share and BPS Analysis by Country, 2025 and 2035
  • Figure 64: East Asia Market Value Share and BPS Analysis by Enzyme Type, 2025 and 2035
  • Figure 65: East Asia Market Y-o-Y Growth Comparison by Enzyme Type, 2025-2035
  • Figure 66: East Asia Market Attractiveness Analysis by Enzyme Type
  • Figure 67: East Asia Market Value Share and BPS Analysis by Form, 2025 and 2035
  • Figure 68: East Asia Market Y-o-Y Growth Comparison by Form, 2025-2035
  • Figure 69: East Asia Market Attractiveness Analysis by Form
  • Figure 70: East Asia Market Value Share and BPS Analysis by Aquatic Animal, 2025 and 2035
  • Figure 71: East Asia Market Y-o-Y Growth Comparison by Aquatic Animal, 2025-2035
  • Figure 72: East Asia Market Attractiveness Analysis by Aquatic Animal
  • Figure 73: South Asia & Pacific Market Value Share and BPS Analysis by Country, 2025 and 2035
  • Figure 74: South Asia & Pacific Market Value Share and BPS Analysis by Enzyme Type, 2025 and 2035
  • Figure 75: South Asia & Pacific Market Y-o-Y Growth Comparison by Enzyme Type, 2025-2035
  • Figure 76: South Asia & Pacific Market Attractiveness Analysis by Enzyme Type
  • Figure 77: South Asia & Pacific Market Value Share and BPS Analysis by Form, 2025 and 2035
  • Figure 78: South Asia & Pacific Market Y-o-Y Growth Comparison by Form, 2025-2035
  • Figure 79: South Asia & Pacific Market Attractiveness Analysis by Form
  • Figure 80: South Asia & Pacific Market Value Share and BPS Analysis by Aquatic Animal, 2025 and 2035
  • Figure 81: South Asia & Pacific Market Y-o-Y Growth Comparison by Aquatic Animal, 2025-2035
  • Figure 82: South Asia & Pacific Market Attractiveness Analysis by Aquatic Animal
  • Figure 83: Middle East and Africa Market Value Share and BPS Analysis by Country, 2025 and 2035
  • Figure 84: Middle East and Africa Market Value Share and BPS Analysis by Enzyme Type, 2025 and 2035
  • Figure 85: Middle East and Africa Market Y-o-Y Growth Comparison by Enzyme Type, 2025-2035
  • Figure 86: Middle East and Africa Market Attractiveness Analysis by Enzyme Type
  • Figure 87: Middle East and Africa Market Value Share and BPS Analysis by Form, 2025 and 2035
  • Figure 88: Middle East and Africa Market Y-o-Y Growth Comparison by Form, 2025-2035
  • Figure 89: Middle East and Africa Market Attractiveness Analysis by Form
  • Figure 90: Middle East and Africa Market Value Share and BPS Analysis by Aquatic Animal, 2025 and 2035
  • Figure 91: Middle East and Africa Market Y-o-Y Growth Comparison by Aquatic Animal, 2025-2035
  • Figure 92: Middle East and Africa Market Attractiveness Analysis by Aquatic Animal
  • Figure 93: Global Market - Tier Structure Analysis
  • Figure 94: Global Market - Company Share Analysis

Frequently Asked Questions

What is the estimated market size of the aquafeed Enzymes industry in 2025?

The industry is valued at USD 505.6 million in 2025.

What is the projected industry size of the aquafeed Enzymes industry by 2035?

It is forecasted to reach USD 838.6 million by 2035.

What is the expected CAGR for the aquafeed Enzymes industry between 2025 and 2035?

The industry is anticipated to grow at a CAGR of 5.2% during this period.

Which segment is expected to lead the aquafeed Enzymes market in 2025?

Powder is projected to lead the market with a 61.5% share in 2025.

Which region is expected to witness the highest growth in the aquafeed Enzymes market?

Asia Pacific, particularly India, is expected to be the key growth region with a projected growth rate of 6.0%.

Explore Similar Insights

Future Market Insights

Aquafeed Enzymes Market