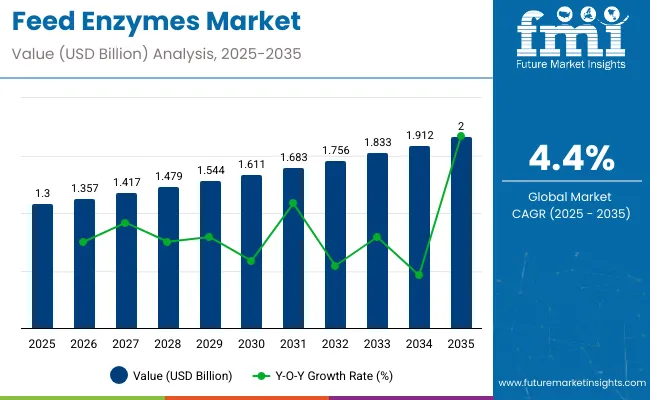
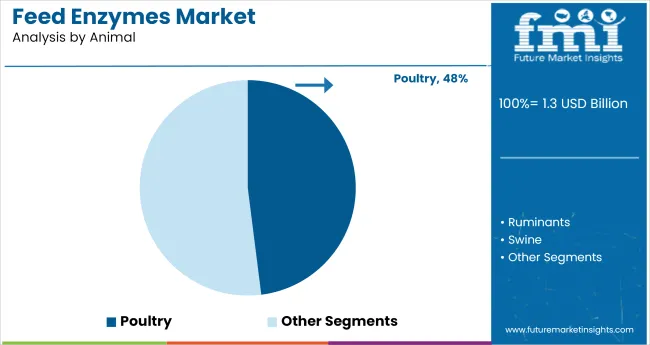
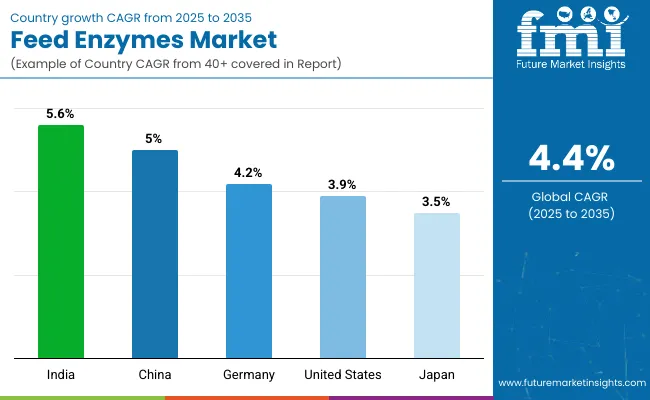
The global feed enzymes market is projected to grow from USD 1.3 billion in 2025 to USD 2.0 billion by 2035, reflecting a compound annual growth rate (CAGR) of 4.4%. This upward trajectory is driven by the livestock industry's increasing focus on improving feed efficiency, enhancing animal health, and reducing environmental impact through precision nutrition.
Feed enzymes-such as phytase, protease, and carbohydrase-are increasingly used in animal nutrition to break down anti-nutritional factors in feed ingredients, thereby improving nutrient absorption and digestion. These enzymes help lower feed costs, reduce waste output, and support better growth rates, especially in poultry, swine, and ruminant livestock systems. As sustainability becomes central to the global agri-food agenda, enzyme supplementation is gaining traction for its role in reducing phosphorus and nitrogen excretion.
The Asia Pacific region leads global consumption due to its massive livestock population and growing demand for animal protein. Countries like China, India, and Vietnam are rapidly industrializing their animal farming sectors, which in turn is driving the adoption of feed enzyme technologies. In North America and Europe, stringent regulations around antibiotic use in feed have accelerated the shift toward enzyme-based alternatives.
Technological advancements in enzyme engineering and delivery mechanisms are also expanding the market. Manufacturers are developing heat-stable and pH-tolerant enzyme blends that can withstand harsh pelleting conditions and remain active throughout the digestive process.
In a 2023 interview with FeedNavigator, Andres Madueno, Director of Strategic Innovation at DSM-Firmenich Animal Nutrition, stated: “Enzymes are no longer optional-they’re foundational in precision animal nutrition strategies aimed at reducing emissions, improving digestibility, and boosting productivity. Our customers want more than performance-they want data-backed sustainability.” His remarks underscore the role feed enzymes play in balancing animal performance with environmental responsibility.
As the global livestock sector adapts to meet the dual demands of production and sustainability, feed enzymes are poised to remain a core component of nutritional innovation over the coming decade.
The below table presents a comparative assessment of the variation in CAGR over six months for the base year (2024) and current year (2025) for global feed enzymes market. This analysis reveals crucial shifts in market performance and indicates revenue realization patterns, thus providing stakeholders with a better vision about the market growth trajectory over the year. The first half of the year, or H1, spans from January to June. The second half, H2, includes the months from July to December.
Particular | Value CAGR |
---|---|
H1 (2024 to 2034) | 3.3% |
H2 (2024 to 2034) | 3.9% |
H1 (2025 to 2035) | 4.4% |
H2 (2025 to 2035) | 5.0% |
The above table presents the expected CAGR for the global feed enzymes demand space over semi-annual period spanning from 2025 to 2035. In the first half (H1) of the year 2024, the business is predicted to surge at a CAGR of 3.3%, followed by a slightly higher growth rate of 3.9% in the second half (H2) of the same year.
Moving into year 2025, the CAGR is projected to increase slightly to 4.4% in the first half and remain relatively moderate at 5.0% in the second half. In the first half (H1 2025) the market witnessed a decrease of 16 BPS while in the second half (H2 2025), the market witnessed an increase of 34 BPS.
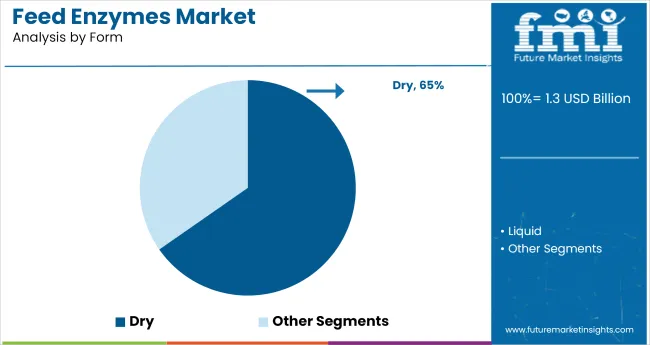
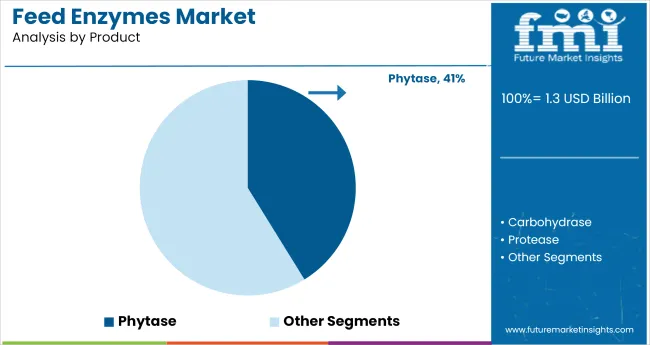
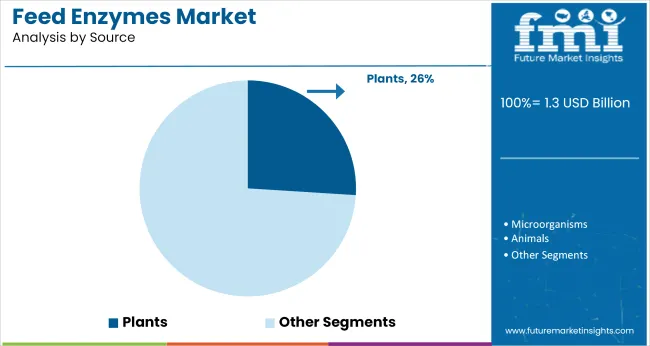
Phytase leads the feed enzymes market share with a 41.2%, driven by its role in improving phosphorus digestibility and reducing environmental waste. The dry form dominates at 65.3%, favored for stability and ease of handling, while plant-sourced enzymes capture 26%, reflecting growing sustainability trends.
The phytase segment accounts for 41.2% of the global feed enzymes market share in 2025, reflecting its critical function in enhancing phosphorus availability in animal diets. By breaking down phytate-bound phosphorus in feed grains, phytase improves nutrient absorption, reduces feed costs, and lowers phosphorus excretion - a key factor in environmental sustainability.
Phytase enzymes are widely adopted in poultry, swine, and aquaculture feed formulations to meet stringent regulatory standards aimed at minimizing ecological impact. Producers are investing in novel phytase variants that offer higher activity at different pH levels and improved thermal stability during feed processing.
Leading companies such as DSM, Novozymes, and DuPont focus on enhancing phytase efficiency through biotechnology innovations and strain optimization. The rising global demand for sustainable animal farming practices continues to position phytase as the fastest-growing and most lucrative product segment in the feed enzymes market.
The dry form of feed enzymes holds a commanding 65.3% market share in 2025, driven by advantages in storage stability, ease of transportation, and longer shelf life compared to liquid alternatives. Dry enzymes maintain their catalytic activity under varied environmental conditions, making them ideal for inclusion in pelleted and mash feeds.
Dry enzyme formulations reduce microbial contamination risk and allow for precise dosing during feed manufacturing, enhancing feed consistency and animal performance. The form is widely preferred in large-scale feed mills and integrated livestock operations due to lower logistical costs and better compatibility with existing feed processing equipment.
Industry leaders such as AB Enzymes, Kemin Industries, and Associated British Foods emphasize dry enzyme development to meet the growing demand from feed producers focusing on efficiency and sustainability. With increasing global livestock production and regulatory pressure to reduce antibiotic use, the dry form segment is set to maintain its leading market position through 2035.
Integration of Technology in Animal Nutrition
In addition to technology, animal nutrition has been dramatically changed by innovation. Simulation agriculture uses extremely detailed data analysis systems, sensors, and health and nutrition monitoring systems that deliver real-time data about livestock health, behavior, and nutritional needs. The smart and data-driven approach of this technique enables the design of feed enzymes which are more specific to the individual livestock's dietary requirements.
By tweaking the nutritional makeup of feed formulations according to the animal's own needs, producers can achieve better growth, feed efficiency, and consequently more profit. Besides, the innovations in biotechnology leads to production of the highly effective and specific feed enzyme products thus driving the demand to meet the efficiencies and productivity goals of the aquaculture industry.
Increased Focus on Sustainable Practices
The livestock sector is increasingly under attack because of the environmental issues it causes, but it is developing a strategy that revolves around the practices of sustainability. The need to cut down on greenhouse gas emissions and minimize waste, as well as the pressure to improve resource efficiency, is compelling the producers to act. Feed enzymes are part of this process, because they improve feed conversion ratios (FCR) which means that animals get more nutrients from a lower quantity of feed.
Therefore, feeding supply costs are cut down with this approach while at the same time the environmental feedstock footprint goes down. If producers will include feed enzymes in their feeding strategies to amp up the process of cutting back on the waste and therefore contribute to more sustainable animal production systems, they will be solving both sustainability targets and environmental challenges, so they will be unequivocally satisfying the consumers' requirements for being more responsible with the environment.
Rising Demand for Aquaculture
The aquaculture sector keeps on receiving massive financing as the ever-increasing demand for fish as a healthy protein source is the primary drive of the sector. With rising populations and changing diets, the need for efficient and sustainable fish farming practices has become of high priority. Feed enzymes that are exclusive to aquatic animals have become widespread, as they enhance nutrient utilization and stimulate growth in fish and shellfish.
These swim-up feeders slow down digestion because they are more effective in utilizing nutrients. The trend, on one hand, enhances the health and growth of the fish in the fish farms, and simultaneously, it expands the market for feed enzymes from the livestock sector to aquaculture, thus creating new platforms for manufacturers to develop and meet the changing needs of the industry.
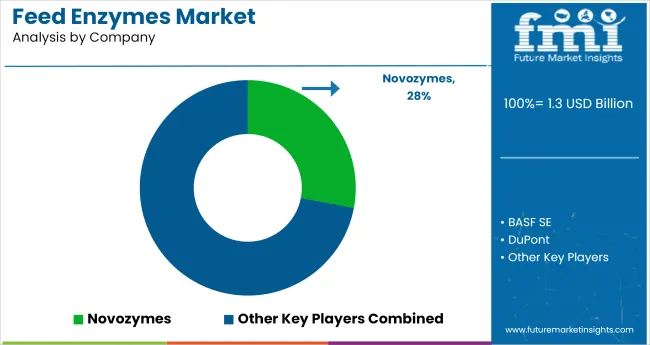
Tier 1 Companies: This tier comprises industry leaders with substantial market revenue exceeding USD 20 million and a market share of approximately 40% to 50%. These companies are recognized for their high production capacity, extensive product portfolios, and strong global presence.
They leverage advanced technologies and have established robust supply chains, enabling them to meet diverse customer needs across various regions. Tier 1 companies are distinguished by their significant investment in research and development, which fosters innovation in enzyme formulations and applications.
Prominent players in this tier include BASF SE, DuPont de Nemours, Inc., Novozymes A/S, and DSM Nutritional Products. Their leadership positions are further supported by strong brand recognition and a loyal consumer base, allowing them to maintain competitive advantages in the market.
Tier 2 Companies: This tier includes mid-sized players with revenues ranging from USD 5 million to USD 20 million. These companies often have a strong regional presence and play a crucial role in influencing local markets. While they may not possess the extensive global reach of Tier 1 companies, they are characterized by their specialized knowledge of local consumer preferences and regulatory environments.
Tier 2 companies typically focus on specific feed enzymes market segments, such as poultry or aquaculture, and are known for their ability to adapt to changing market dynamics. Notable companies in this tier include Kemin Industries, Alltech, and Biomin Holding GmbH. These firms often invest in technology to ensure compliance with industry standards, although they may lack the advanced capabilities of their Tier 1 counterparts.
Tier 3 Companies: The third tier consists of small-scale companies with revenues below USD 5 million. These players primarily operate in local markets, catering to niche demands and specific customer needs. Tier 3 companies are often characterized by limited geographical reach and a focus on fulfilling localized marketplace demands.
This segment is recognized as an unorganized field, lacking the extensive structure and formalization seen in higher-tier competitors. Despite their smaller scale, these companies can be agile and responsive to market changes, allowing them to carve out unique positions within the feed enzymes landscape.
Countries | Market Value (2035) |
---|---|
United States | USD 302.9 million |
Germany | USD 202.0 million |
China | USD 141.4 million |
India | USD 101.0 million |
Japan | USD 40.4 million |
The increase of the pet food market in the USA is strongly driven by the rising trend of pet ownership, with more households regarding pets as family members. As pet owners become more health-conscious, the demand for pet food of high quality and rich in nutrients that are of assistance to the animals well-being is also increasing.
This modification has forced the manufacturers to implement the feed enzymes in the pet food recipes, which in turn improves the digestibility and absorption of nutrients. These enzymes, besides meeting consumers' demands, pave the way for the development of new market opportunities by expanding the feed enzymes application beyond just traditional livestock sectors to include the pet food market.
Germany's strong devotion to research and development in agriculture not only stands out but also contributes significantly to the growth of the feed enzymes market. The country is home to many elite research institutions and universities which are dedicated to agricultural science and consequently have become the driving force of the innovation in enzyme technology. These institutions along with the industry cooperating in projects develop formulations of feed enzymes that farmers will be feeding to livestock animals according to their needs.
This focus on R&D not only results in the invention of more effective and targeted enzyme products, but it also serves as a motivational force for manufacturers to introduce modernization. Consequently, the timeless course of innovation along with the market growth rate prompts Germany to be the leader in the international feed enzymes sector.
The shift from traditional farming to highly commercial and intensive livestock farming in India is largely the result of the need to remain competitive in the face of surging protein demand. This transformation not only requires the involvement of new feed technologies but also the implementation of feed enzymes -to optimize feed formulations and raise overall productivity.
The ascent of commercial farmers is reliant on the realization of the benefits that the use of feed enzymes brings, which include enhanced nutrient digestibility and a better feed conversion ratio. By adding these enzymes to their feeding decisions, farmers may achieve the high potential for the capacity and the welfare of the animal, which ultimately is the gain in profit by both sustainability and competitiveness in the agricultural field.
The competition in the global feed enzymes market is intensifying as companies focus on innovation, product differentiation, and sustainability. Key players are investing in research and development to create advanced enzyme formulations tailored to specific livestock needs.
Strategic partnerships and collaborations with research institutions enhance their technological capabilities. Additionally, companies are expanding their product portfolios to include plant-sourced and natural enzymes, aligning with consumer preferences for sustainable and health-conscious options. This proactive approach helps them maintain a competitive edge in a rapidly evolving market.
For instance:
Report Attributes | Details |
---|---|
Market Size (2025) | USD 1.3 billion |
Projected Market Size (2035) | USD 2.0 billion |
CAGR (2025 to 2035) | 4.4% |
Base Year for Estimation | 2024 |
Historical Period | 2020 to 2024 |
Projections Period | 2025 to 2035 |
Quantitative Units | USD billion for value and metric tons for volume |
Form Types Analyzed (Segment 1) | Dry, Liquid |
Product Types Analyzed (Segment 2) | Phytase, Carbohydrase, Protease |
Source Types Analyzed (Segment 3) | Microorganisms, Plants, Animals |
Animal Types Analyzed (Segment 4) | Poultry, Ruminants, Swine, Aquatic Animals, Others (Equine & Pets) |
Regions Covered | North America; Latin America; Eastern Europe; Western Europe; East Asia; South Asia & Pacific; Central Asia; Balkan & Baltic Countries; Russia & Belarus; Middle East & Africa |
Countries Covered | United States, Canada, Brazil, Mexico, Germany, United Kingdom, France, Italy, Spain, Russia, Poland, China, Japan, India, Australia, UAE, South Africa |
Key Players Influencing the Market | BASF SE, DuPont, Associated British Foods Plc, BEHN MEYER, DSM, Azelis S.A., Rossari, BIO-CAT, BEC Feed Solutions, Others |
Additional Attributes | Manufacturers of Feed Enzymes Market want key insights on dollar sales, market share by region and segment, growth drivers, competitive landscape, regulatory impact, raw material trends, demand by animal type, pricing strategies, and forecasted CAGR. |
This segment is further categorized into Dry and Liquid.
This segment is further categorized into Phytase, Carbohydrase, Protease.
This segment is further categorized into Microorganisms, Plants, and Animals.
This segment is further categorized into Poultry, Ruminants, Swine, Aquatic Animals, and Others (Equine & Pets).
Industry analysis has been carried out in key countries of North America, Latin America, Eastern Europe, Western Europe, East Asia, South Asia & Pacific, Central Asia, Balkan and Baltic Countries, Russia & Belarus and the Middle East & Africa.
Table 1: Global Market Value (US$ Million) Forecast by Region, 2017 to 2033
Table 2: Global Market Volume (MT) Forecast by Region, 2017 to 2033
Table 3: Global Market Value (US$ Million) Forecast by Product Type, 2017 to 2033
Table 4: Global Market Volume (MT) Forecast by Product Type, 2017 to 2033
Table 5: Global Market Value (US$ Million) Forecast by Form, 2017 to 2033
Table 6: Global Market Volume (MT) Forecast by Form, 2017 to 2033
Table 7: Global Market Value (US$ Million) Forecast by Animal Type, 2017 to 2033
Table 8: Global Market Volume (MT) Forecast by Animal Type, 2017 to 2033
Table 9: North America Market Value (US$ Million) Forecast by Country, 2017 to 2033
Table 10: North America Market Volume (MT) Forecast by Country, 2017 to 2033
Table 11: North America Market Value (US$ Million) Forecast by Product Type, 2017 to 2033
Table 12: North America Market Volume (MT) Forecast by Product Type, 2017 to 2033
Table 13: North America Market Value (US$ Million) Forecast by Form, 2017 to 2033
Table 14: North America Market Volume (MT) Forecast by Form, 2017 to 2033
Table 15: North America Market Value (US$ Million) Forecast by Animal Type, 2017 to 2033
Table 16: North America Market Volume (MT) Forecast by Animal Type, 2017 to 2033
Table 17: Latin America Market Value (US$ Million) Forecast by Country, 2017 to 2033
Table 18: Latin America Market Volume (MT) Forecast by Country, 2017 to 2033
Table 19: Latin America Market Value (US$ Million) Forecast by Product Type, 2017 to 2033
Table 20: Latin America Market Volume (MT) Forecast by Product Type, 2017 to 2033
Table 21: Latin America Market Value (US$ Million) Forecast by Form, 2017 to 2033
Table 22: Latin America Market Volume (MT) Forecast by Form, 2017 to 2033
Table 23: Latin America Market Value (US$ Million) Forecast by Animal Type, 2017 to 2033
Table 24: Latin America Market Volume (MT) Forecast by Animal Type, 2017 to 2033
Table 25: Western Europe Market Value (US$ Million) Forecast by Country, 2017 to 2033
Table 26: Western Europe Market Volume (MT) Forecast by Country, 2017 to 2033
Table 27: Western Europe Market Value (US$ Million) Forecast by Product Type, 2017 to 2033
Table 28: Western Europe Market Volume (MT) Forecast by Product Type, 2017 to 2033
Table 29: Western Europe Market Value (US$ Million) Forecast by Form, 2017 to 2033
Table 30: Western Europe Market Volume (MT) Forecast by Form, 2017 to 2033
Table 31: Western Europe Market Value (US$ Million) Forecast by Animal Type, 2017 to 2033
Table 32: Western Europe Market Volume (MT) Forecast by Animal Type, 2017 to 2033
Table 33: Eastern Europe Market Value (US$ Million) Forecast by Country, 2017 to 2033
Table 34: Eastern Europe Market Volume (MT) Forecast by Country, 2017 to 2033
Table 35: Eastern Europe Market Value (US$ Million) Forecast by Product Type, 2017 to 2033
Table 36: Eastern Europe Market Volume (MT) Forecast by Product Type, 2017 to 2033
Table 37: Eastern Europe Market Value (US$ Million) Forecast by Form, 2017 to 2033
Table 38: Eastern Europe Market Volume (MT) Forecast by Form, 2017 to 2033
Table 39: Eastern Europe Market Value (US$ Million) Forecast by Animal Type, 2017 to 2033
Table 40: Eastern Europe Market Volume (MT) Forecast by Animal Type, 2017 to 2033
Table 41: Asia Pacific excluding Japan Market Value (US$ Million) Forecast by Country, 2017 to 2033
Table 42: Asia Pacific excluding Japan Market Volume (MT) Forecast by Country, 2017 to 2033
Table 43: Asia Pacific excluding Japan Market Value (US$ Million) Forecast by Product Type, 2017 to 2033
Table 44: Asia Pacific excluding Japan Market Volume (MT) Forecast by Product Type, 2017 to 2033
Table 45: Asia Pacific excluding Japan Market Value (US$ Million) Forecast by Form, 2017 to 2033
Table 46: Asia Pacific excluding Japan Market Volume (MT) Forecast by Form, 2017 to 2033
Table 47: Asia Pacific excluding Japan Market Value (US$ Million) Forecast by Animal Type, 2017 to 2033
Table 48: Asia Pacific excluding Japan Market Volume (MT) Forecast by Animal Type, 2017 to 2033
Table 49: Japan Market Value (US$ Million) Forecast by Country, 2017 to 2033
Table 50: Japan Market Volume (MT) Forecast by Country, 2017 to 2033
Table 51: Japan Market Value (US$ Million) Forecast by Product Type, 2017 to 2033
Table 52: Japan Market Volume (MT) Forecast by Product Type, 2017 to 2033
Table 53: Japan Market Value (US$ Million) Forecast by Form, 2017 to 2033
Table 54: Japan Market Volume (MT) Forecast by Form, 2017 to 2033
Table 55: Japan Market Value (US$ Million) Forecast by Animal Type, 2017 to 2033
Table 56: Japan Market Volume (MT) Forecast by Animal Type, 2017 to 2033
Table 57: Middle East and Africa Market Value (US$ Million) Forecast by Country, 2017 to 2033
Table 58: Middle East and Africa Market Volume (MT) Forecast by Country, 2017 to 2033
Table 59: Middle East and Africa Market Value (US$ Million) Forecast by Product Type, 2017 to 2033
Table 60: Middle East and Africa Market Volume (MT) Forecast by Product Type, 2017 to 2033
Table 61: Middle East and Africa Market Value (US$ Million) Forecast by Form, 2017 to 2033
Table 62: Middle East and Africa Market Volume (MT) Forecast by Form, 2017 to 2033
Table 63: Middle East and Africa Market Value (US$ Million) Forecast by Animal Type, 2017 to 2033
Table 64: Middle East and Africa Market Volume (MT) Forecast by Animal Type, 2017 to 2033
Figure 1: Global Market Value (US$ Million) by Product Type, 2023 to 2033
Figure 2: Global Market Value (US$ Million) by Form, 2023 to 2033
Figure 3: Global Market Value (US$ Million) by Animal Type, 2023 to 2033
Figure 4: Global Market Value (US$ Million) by Region, 2023 to 2033
Figure 5: Global Market Value (US$ Million) Analysis by Region, 2017 to 2033
Figure 6: Global Market Volume (MT) Analysis by Region, 2017 to 2033
Figure 7: Global Market Value Share (%) and BPS Analysis by Region, 2023 to 2033
Figure 8: Global Market Y-o-Y Growth (%) Projections by Region, 2023 to 2033
Figure 9: Global Market Value (US$ Million) Analysis by Product Type, 2017 to 2033
Figure 10: Global Market Volume (MT) Analysis by Product Type, 2017 to 2033
Figure 11: Global Market Value Share (%) and BPS Analysis by Product Type, 2023 to 2033
Figure 12: Global Market Y-o-Y Growth (%) Projections by Product Type, 2023 to 2033
Figure 13: Global Market Value (US$ Million) Analysis by Form, 2017 to 2033
Figure 14: Global Market Volume (MT) Analysis by Form, 2017 to 2033
Figure 15: Global Market Value Share (%) and BPS Analysis by Form, 2023 to 2033
Figure 16: Global Market Y-o-Y Growth (%) Projections by Form, 2023 to 2033
Figure 17: Global Market Value (US$ Million) Analysis by Animal Type, 2017 to 2033
Figure 18: Global Market Volume (MT) Analysis by Animal Type, 2017 to 2033
Figure 19: Global Market Value Share (%) and BPS Analysis by Animal Type, 2023 to 2033
Figure 20: Global Market Y-o-Y Growth (%) Projections by Animal Type, 2023 to 2033
Figure 21: Global Market Attractiveness by Product Type, 2023 to 2033
Figure 22: Global Market Attractiveness by Form, 2023 to 2033
Figure 23: Global Market Attractiveness by Animal Type, 2023 to 2033
Figure 24: Global Market Attractiveness by Region, 2023 to 2033
Figure 25: North America Market Value (US$ Million) by Product Type, 2023 to 2033
Figure 26: North America Market Value (US$ Million) by Form, 2023 to 2033
Figure 27: North America Market Value (US$ Million) by Animal Type, 2023 to 2033
Figure 28: North America Market Value (US$ Million) by Country, 2023 to 2033
Figure 29: North America Market Value (US$ Million) Analysis by Country, 2017 to 2033
Figure 30: North America Market Volume (MT) Analysis by Country, 2017 to 2033
Figure 31: North America Market Value Share (%) and BPS Analysis by Country, 2023 to 2033
Figure 32: North America Market Y-o-Y Growth (%) Projections by Country, 2023 to 2033
Figure 33: North America Market Value (US$ Million) Analysis by Product Type, 2017 to 2033
Figure 34: North America Market Volume (MT) Analysis by Product Type, 2017 to 2033
Figure 35: North America Market Value Share (%) and BPS Analysis by Product Type, 2023 to 2033
Figure 36: North America Market Y-o-Y Growth (%) Projections by Product Type, 2023 to 2033
Figure 37: North America Market Value (US$ Million) Analysis by Form, 2017 to 2033
Figure 38: North America Market Volume (MT) Analysis by Form, 2017 to 2033
Figure 39: North America Market Value Share (%) and BPS Analysis by Form, 2023 to 2033
Figure 40: North America Market Y-o-Y Growth (%) Projections by Form, 2023 to 2033
Figure 41: North America Market Value (US$ Million) Analysis by Animal Type, 2017 to 2033
Figure 42: North America Market Volume (MT) Analysis by Animal Type, 2017 to 2033
Figure 43: North America Market Value Share (%) and BPS Analysis by Animal Type, 2023 to 2033
Figure 44: North America Market Y-o-Y Growth (%) Projections by Animal Type, 2023 to 2033
Figure 45: North America Market Attractiveness by Product Type, 2023 to 2033
Figure 46: North America Market Attractiveness by Form, 2023 to 2033
Figure 47: North America Market Attractiveness by Animal Type, 2023 to 2033
Figure 48: North America Market Attractiveness by Country, 2023 to 2033
Figure 49: Latin America Market Value (US$ Million) by Product Type, 2023 to 2033
Figure 50: Latin America Market Value (US$ Million) by Form, 2023 to 2033
Figure 51: Latin America Market Value (US$ Million) by Animal Type, 2023 to 2033
Figure 52: Latin America Market Value (US$ Million) by Country, 2023 to 2033
Figure 53: Latin America Market Value (US$ Million) Analysis by Country, 2017 to 2033
Figure 54: Latin America Market Volume (MT) Analysis by Country, 2017 to 2033
Figure 55: Latin America Market Value Share (%) and BPS Analysis by Country, 2023 to 2033
Figure 56: Latin America Market Y-o-Y Growth (%) Projections by Country, 2023 to 2033
Figure 57: Latin America Market Value (US$ Million) Analysis by Product Type, 2017 to 2033
Figure 58: Latin America Market Volume (MT) Analysis by Product Type, 2017 to 2033
Figure 59: Latin America Market Value Share (%) and BPS Analysis by Product Type, 2023 to 2033
Figure 60: Latin America Market Y-o-Y Growth (%) Projections by Product Type, 2023 to 2033
Figure 61: Latin America Market Value (US$ Million) Analysis by Form, 2017 to 2033
Figure 62: Latin America Market Volume (MT) Analysis by Form, 2017 to 2033
Figure 63: Latin America Market Value Share (%) and BPS Analysis by Form, 2023 to 2033
Figure 64: Latin America Market Y-o-Y Growth (%) Projections by Form, 2023 to 2033
Figure 65: Latin America Market Value (US$ Million) Analysis by Animal Type, 2017 to 2033
Figure 66: Latin America Market Volume (MT) Analysis by Animal Type, 2017 to 2033
Figure 67: Latin America Market Value Share (%) and BPS Analysis by Animal Type, 2023 to 2033
Figure 68: Latin America Market Y-o-Y Growth (%) Projections by Animal Type, 2023 to 2033
Figure 69: Latin America Market Attractiveness by Product Type, 2023 to 2033
Figure 70: Latin America Market Attractiveness by Form, 2023 to 2033
Figure 71: Latin America Market Attractiveness by Animal Type, 2023 to 2033
Figure 72: Latin America Market Attractiveness by Country, 2023 to 2033
Figure 73: Western Europe Market Value (US$ Million) by Product Type, 2023 to 2033
Figure 74: Western Europe Market Value (US$ Million) by Form, 2023 to 2033
Figure 75: Western Europe Market Value (US$ Million) by Animal Type, 2023 to 2033
Figure 76: Western Europe Market Value (US$ Million) by Country, 2023 to 2033
Figure 77: Western Europe Market Value (US$ Million) Analysis by Country, 2017 to 2033
Figure 78: Western Europe Market Volume (MT) Analysis by Country, 2017 to 2033
Figure 79: Western Europe Market Value Share (%) and BPS Analysis by Country, 2023 to 2033
Figure 80: Western Europe Market Y-o-Y Growth (%) Projections by Country, 2023 to 2033
Figure 81: Western Europe Market Value (US$ Million) Analysis by Product Type, 2017 to 2033
Figure 82: Western Europe Market Volume (MT) Analysis by Product Type, 2017 to 2033
Figure 83: Western Europe Market Value Share (%) and BPS Analysis by Product Type, 2023 to 2033
Figure 84: Western Europe Market Y-o-Y Growth (%) Projections by Product Type, 2023 to 2033
Figure 85: Western Europe Market Value (US$ Million) Analysis by Form, 2017 to 2033
Figure 86: Western Europe Market Volume (MT) Analysis by Form, 2017 to 2033
Figure 87: Western Europe Market Value Share (%) and BPS Analysis by Form, 2023 to 2033
Figure 88: Western Europe Market Y-o-Y Growth (%) Projections by Form, 2023 to 2033
Figure 89: Western Europe Market Value (US$ Million) Analysis by Animal Type, 2017 to 2033
Figure 90: Western Europe Market Volume (MT) Analysis by Animal Type, 2017 to 2033
Figure 91: Western Europe Market Value Share (%) and BPS Analysis by Animal Type, 2023 to 2033
Figure 92: Western Europe Market Y-o-Y Growth (%) Projections by Animal Type, 2023 to 2033
Figure 93: Western Europe Market Attractiveness by Product Type, 2023 to 2033
Figure 94: Western Europe Market Attractiveness by Form, 2023 to 2033
Figure 95: Western Europe Market Attractiveness by Animal Type, 2023 to 2033
Figure 96: Western Europe Market Attractiveness by Country, 2023 to 2033
Figure 97: Eastern Europe Market Value (US$ Million) by Product Type, 2023 to 2033
Figure 98: Eastern Europe Market Value (US$ Million) by Form, 2023 to 2033
Figure 99: Eastern Europe Market Value (US$ Million) by Animal Type, 2023 to 2033
Figure 100: Eastern Europe Market Value (US$ Million) by Country, 2023 to 2033
Figure 101: Eastern Europe Market Value (US$ Million) Analysis by Country, 2017 to 2033
Figure 102: Eastern Europe Market Volume (MT) Analysis by Country, 2017 to 2033
Figure 103: Eastern Europe Market Value Share (%) and BPS Analysis by Country, 2023 to 2033
Figure 104: Eastern Europe Market Y-o-Y Growth (%) Projections by Country, 2023 to 2033
Figure 105: Eastern Europe Market Value (US$ Million) Analysis by Product Type, 2017 to 2033
Figure 106: Eastern Europe Market Volume (MT) Analysis by Product Type, 2017 to 2033
Figure 107: Eastern Europe Market Value Share (%) and BPS Analysis by Product Type, 2023 to 2033
Figure 108: Eastern Europe Market Y-o-Y Growth (%) Projections by Product Type, 2023 to 2033
Figure 109: Eastern Europe Market Value (US$ Million) Analysis by Form, 2017 to 2033
Figure 110: Eastern Europe Market Volume (MT) Analysis by Form, 2017 to 2033
Figure 111: Eastern Europe Market Value Share (%) and BPS Analysis by Form, 2023 to 2033
Figure 112: Eastern Europe Market Y-o-Y Growth (%) Projections by Form, 2023 to 2033
Figure 113: Eastern Europe Market Value (US$ Million) Analysis by Animal Type, 2017 to 2033
Figure 114: Eastern Europe Market Volume (MT) Analysis by Animal Type, 2017 to 2033
Figure 115: Eastern Europe Market Value Share (%) and BPS Analysis by Animal Type, 2023 to 2033
Figure 116: Eastern Europe Market Y-o-Y Growth (%) Projections by Animal Type, 2023 to 2033
Figure 117: Eastern Europe Market Attractiveness by Product Type, 2023 to 2033
Figure 118: Eastern Europe Market Attractiveness by Form, 2023 to 2033
Figure 119: Eastern Europe Market Attractiveness by Animal Type, 2023 to 2033
Figure 120: Eastern Europe Market Attractiveness by Country, 2023 to 2033
Figure 121: Asia Pacific excluding Japan Market Value (US$ Million) by Product Type, 2023 to 2033
Figure 122: Asia Pacific excluding Japan Market Value (US$ Million) by Form, 2023 to 2033
Figure 123: Asia Pacific excluding Japan Market Value (US$ Million) by Animal Type, 2023 to 2033
Figure 124: Asia Pacific excluding Japan Market Value (US$ Million) by Country, 2023 to 2033
Figure 125: Asia Pacific excluding Japan Market Value (US$ Million) Analysis by Country, 2017 to 2033
Figure 126: Asia Pacific excluding Japan Market Volume (MT) Analysis by Country, 2017 to 2033
Figure 127: Asia Pacific excluding Japan Market Value Share (%) and BPS Analysis by Country, 2023 to 2033
Figure 128: Asia Pacific excluding Japan Market Y-o-Y Growth (%) Projections by Country, 2023 to 2033
Figure 129: Asia Pacific excluding Japan Market Value (US$ Million) Analysis by Product Type, 2017 to 2033
Figure 130: Asia Pacific excluding Japan Market Volume (MT) Analysis by Product Type, 2017 to 2033
Figure 131: Asia Pacific excluding Japan Market Value Share (%) and BPS Analysis by Product Type, 2023 to 2033
Figure 132: Asia Pacific excluding Japan Market Y-o-Y Growth (%) Projections by Product Type, 2023 to 2033
Figure 133: Asia Pacific excluding Japan Market Value (US$ Million) Analysis by Form, 2017 to 2033
Figure 134: Asia Pacific excluding Japan Market Volume (MT) Analysis by Form, 2017 to 2033
Figure 135: Asia Pacific excluding Japan Market Value Share (%) and BPS Analysis by Form, 2023 to 2033
Figure 136: Asia Pacific excluding Japan Market Y-o-Y Growth (%) Projections by Form, 2023 to 2033
Figure 137: Asia Pacific excluding Japan Market Value (US$ Million) Analysis by Animal Type, 2017 to 2033
Figure 138: Asia Pacific excluding Japan Market Volume (MT) Analysis by Animal Type, 2017 to 2033
Figure 139: Asia Pacific excluding Japan Market Value Share (%) and BPS Analysis by Animal Type, 2023 to 2033
Figure 140: Asia Pacific excluding Japan Market Y-o-Y Growth (%) Projections by Animal Type, 2023 to 2033
Figure 141: Asia Pacific excluding Japan Market Attractiveness by Product Type, 2023 to 2033
Figure 142: Asia Pacific excluding Japan Market Attractiveness by Form, 2023 to 2033
Figure 143: Asia Pacific excluding Japan Market Attractiveness by Animal Type, 2023 to 2033
Figure 144: Asia Pacific excluding Japan Market Attractiveness by Country, 2023 to 2033
Figure 145: Japan Market Value (US$ Million) by Product Type, 2023 to 2033
Figure 146: Japan Market Value (US$ Million) by Form, 2023 to 2033
Figure 147: Japan Market Value (US$ Million) by Animal Type, 2023 to 2033
Figure 148: Japan Market Value (US$ Million) by Country, 2023 to 2033
Figure 149: Japan Market Value (US$ Million) Analysis by Country, 2017 to 2033
Figure 150: Japan Market Volume (MT) Analysis by Country, 2017 to 2033
Figure 151: Japan Market Value Share (%) and BPS Analysis by Country, 2023 to 2033
Figure 152: Japan Market Y-o-Y Growth (%) Projections by Country, 2023 to 2033
Figure 153: Japan Market Value (US$ Million) Analysis by Product Type, 2017 to 2033
Figure 154: Japan Market Volume (MT) Analysis by Product Type, 2017 to 2033
Figure 155: Japan Market Value Share (%) and BPS Analysis by Product Type, 2023 to 2033
Figure 156: Japan Market Y-o-Y Growth (%) Projections by Product Type, 2023 to 2033
Figure 157: Japan Market Value (US$ Million) Analysis by Form, 2017 to 2033
Figure 158: Japan Market Volume (MT) Analysis by Form, 2017 to 2033
Figure 159: Japan Market Value Share (%) and BPS Analysis by Form, 2023 to 2033
Figure 160: Japan Market Y-o-Y Growth (%) Projections by Form, 2023 to 2033
Figure 161: Japan Market Value (US$ Million) Analysis by Animal Type, 2017 to 2033
Figure 162: Japan Market Volume (MT) Analysis by Animal Type, 2017 to 2033
Figure 163: Japan Market Value Share (%) and BPS Analysis by Animal Type, 2023 to 2033
Figure 164: Japan Market Y-o-Y Growth (%) Projections by Animal Type, 2023 to 2033
Figure 165: Japan Market Attractiveness by Product Type, 2023 to 2033
Figure 166: Japan Market Attractiveness by Form, 2023 to 2033
Figure 167: Japan Market Attractiveness by Animal Type, 2023 to 2033
Figure 168: Japan Market Attractiveness by Country, 2023 to 2033
Figure 169: Middle East and Africa Market Value (US$ Million) by Product Type, 2023 to 2033
Figure 170: Middle East and Africa Market Value (US$ Million) by Form, 2023 to 2033
Figure 171: Middle East and Africa Market Value (US$ Million) by Animal Type, 2023 to 2033
Figure 172: Middle East and Africa Market Value (US$ Million) by Country, 2023 to 2033
Figure 173: Middle East and Africa Market Value (US$ Million) Analysis by Country, 2017 to 2033
Figure 174: Middle East and Africa Market Volume (MT) Analysis by Country, 2017 to 2033
Figure 175: Middle East and Africa Market Value Share (%) and BPS Analysis by Country, 2023 to 2033
Figure 176: Middle East and Africa Market Y-o-Y Growth (%) Projections by Country, 2023 to 2033
Figure 177: Middle East and Africa Market Value (US$ Million) Analysis by Product Type, 2017 to 2033
Figure 178: Middle East and Africa Market Volume (MT) Analysis by Product Type, 2017 to 2033
Figure 179: Middle East and Africa Market Value Share (%) and BPS Analysis by Product Type, 2023 to 2033
Figure 180: Middle East and Africa Market Y-o-Y Growth (%) Projections by Product Type, 2023 to 2033
Figure 181: Middle East and Africa Market Value (US$ Million) Analysis by Form, 2017 to 2033
Figure 182: Middle East and Africa Market Volume (MT) Analysis by Form, 2017 to 2033
Figure 183: Middle East and Africa Market Value Share (%) and BPS Analysis by Form, 2023 to 2033
Figure 184: Middle East and Africa Market Y-o-Y Growth (%) Projections by Form, 2023 to 2033
Figure 185: Middle East and Africa Market Value (US$ Million) Analysis by Animal Type, 2017 to 2033
Figure 186: Middle East and Africa Market Volume (MT) Analysis by Animal Type, 2017 to 2033
Figure 187: Middle East and Africa Market Value Share (%) and BPS Analysis by Animal Type, 2023 to 2033
Figure 188: Middle East and Africa Market Y-o-Y Growth (%) Projections by Animal Type, 2023 to 2033
Figure 189: Middle East and Africa Market Attractiveness by Product Type, 2023 to 2033
Figure 190: Middle East and Africa Market Attractiveness by Form, 2023 to 2033
Figure 191: Middle East and Africa Market Attractiveness by Animal Type, 2023 to 2033
Figure 192: Middle East and Africa Market Attractiveness by Country, 2023 to 2033
Phytases and proteases lead the Feed Enzymes market due to their efficiency in improving nutrient uptake.
The Feed Enzymes market favors dry formulations for stability, though liquid forms are gaining popularity.
Poultry and swine hold the largest share in the Feed Enzymes market, followed by ruminants and aquaculture.
The global feed enzymes market is projected to grow USD 2.0 billion by 2035
North America leads the Feed Enzymes market, with APAC growing fastest and Europe influenced by strict policies.
The Feed Enzymes market grows on protein demand and antibiotic bans but faces cost-related adoption barriers.
Explore Animal Nutrition Insights
Thank you!
You will receive an email from our Business Development Manager. Please be sure to check your SPAM/JUNK folder too.