Feed Barley Market Outlook and Forecast 2025 to 2035

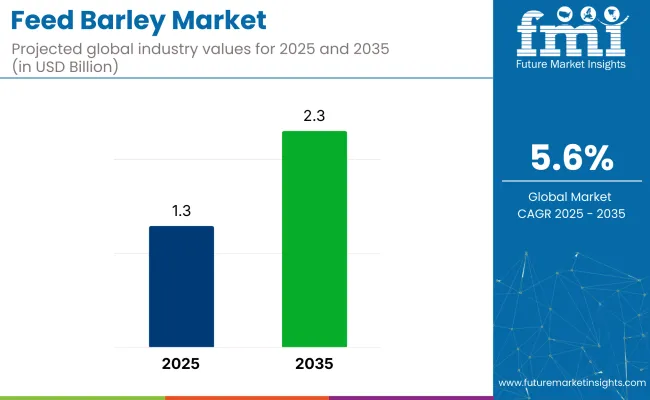
The global feed barley market is projected to grow from USD 1.3 billion in 2025 to USD 2.3 billion by 2035, registering a CAGR of 5.6%. Market growth is being fueled by the rising demand for protein-rich animal products and the adoption of sustainable, cost-effective livestock nutrition strategies.
Quick Stats Of Feed Barley Market

  • Market Value (2025): USD 1.3 billion
  • Forecast Value (2035): USD 2.3 billion
  • Forecast CAGR: 5.6%
  • Barley Type Leader in 2025: Hulled Barley (98% share)
  • Top Nature Segment in 2025: Conventional(89% market share)
  • Key Growth Region: East Asia (Japan is the fastest-growing market with a 6% CAGR)
Metric Value
Industry Size (2025E) USD 1.3 billion
Industry Value (2035F) USD 2.3 billion
CAGR (2025 to 2035) 5.6%

Barley’s high fiber content, digestibility, and favorable energy profile make it a preferred feed grain in ruminant diets. The increasing emphasis on responsible farming practices and efficient feed conversion rates is further supporting the use of feed barley across cattle, poultry, and swine production systems.

The market holds an estimated 86% share within the overall barley used for animal feed, underscoring its primary application. It accounts for around 12% of the global feed grain market, standing alongside corn and wheat. Within the broader compound feed market, feed barley contributes approximately 5%, reflecting its significance in ruminant and monogastric diets.

It represents nearly 2.5% of the agricultural commodities market, highlighting its value in crop trade. However, in the vast food and beverage ingredients market, its share remains modest at below 0.03%, given its non-food classification and specialization in livestock nutrition.

Government regulations impacting the market are primarily linked to feed safety, quality control, and sustainable farming practices. Standards such as the Codex Alimentarius for animal feed, the European Feed Hygiene Regulation (EC) No 183/2005, and various national Good Manufacturing Practices (GMP) ensure that feed barley meets nutritional and safety benchmarks.

Additionally, in countries like China, Germany, and the United States, rising consumer awareness around traceability and animal welfare is driving demand for certified, high-quality feed barley, reinforcing the shift toward regulated and transparent supply chains.

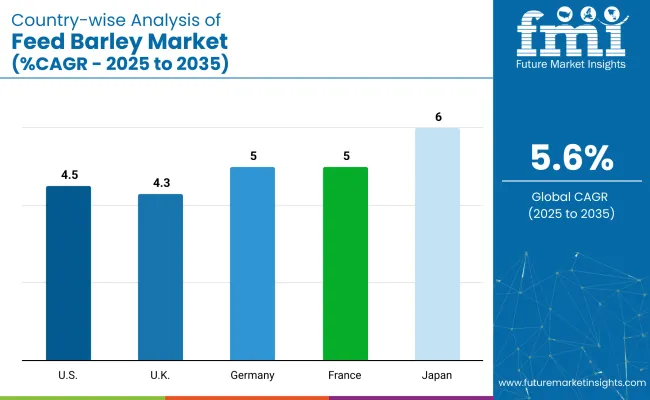
Japan is projected to be the fastest-growing market, expanding at a CAGR of 6% from 2025 to 2035. Livestock feed will dominate the application segment with an 86% share, while hulled barley will lead the type segment with a 98% share. The USA and Germany are also expected to grow steadily, with CAGRs of 4.5% and 5%, respectively.

Feed Barley Market Analysis by Top Investment Segments

The feed barley market is segmented by type, application, nature, and region. By type, the market is bifurcated into hulled barley and naked barley. Based on application, the market is segmented into aquaculture (fish, shrimp, shellfish, others), livestock (poultry, ruminants such as cattle, sheep, goats, swine, equine, others), and pet food (dogs, cats, horses).

By nature, the market is bifurcated into organic and conventional. Regionally, the market is divided into North America, Latin America, Europe, East Asia, South Asia, Oceania, and the Middle East & Africa.

Hulled Barley to Lead the Type Segment with 98% Market Share

The hulled barley is projected to lead the type segment, capturing 98% of the market share by 2025.
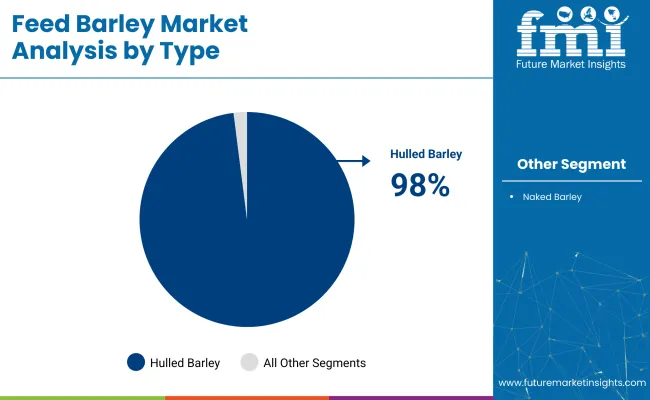
  • It retains the outer husk, offering higher fiber content and slower digestion, ideal for ruminant feed.
  • Its gradual energy release enhances microbial activity in the rumen, improving feed efficiency and animal health.

Livestock to Dominate the Application Segment with 86% Market Share

The livestock is expected to dominate the application category, accounting for 86% of the global market share in 2025.

  • Feed barley is widely used in cattle, sheep, and goat diets due to its high carbohydrate and protein content.
  • It is especially valued for its cost-efficiency and compatibility with ruminant digestive systems.

Conventional to Lead the Nature Segment with 89% Market Share

The conventional is projected to capture 89% of the market share in 2025.
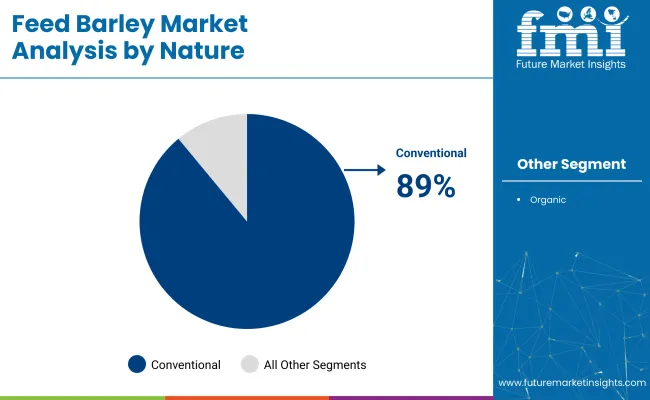
  • Widespread cultivation and affordability make conventional barley the preferred choice.
  • Organic barley, though growing, still faces cost and certification barriers limiting its mass adoption.

Top Feed Barley Market Dynamics

The global feed barley market is witnessing consistent growth driven by increasing demand for sustainable, high-energy livestock nutrition. Feed barley supports animal health and farm profitability, particularly in ruminant operations.

Recent Trends in the Feed Barley Market

  • Integration of precision agriculture and climate-resilient barley varieties is improving yields and feed value.
  • Cross-border trade is expanding due to shortfalls in local barley production in Asia and the Middle East.
  • Customized feed blends incorporating barley are gaining traction in premium animal nutrition programs.

Challenges in the Feed Barley Market

  • Climate sensitivity affects yield and consistency, especially in non-temperate regions.
  • Competition from other grains such as corn and sorghum in poultry and swine feed remains a barrier.
  • Price volatility linked to fertilizer and transportation costs may impact affordability and adoption, especially in developing countries.

Top Countries Manufacturing, Regulating, and Generating Demand for Feed Barley

The feed barley market in Japan is gaining momentum through strong livestock nutrition strategies and a reliance on imported barley to meet domestic feed requirements. the feed barley markets in Germany and France maintain consistent demand due to EU-backed feed safety standards and support for sustainable livestock farming under the Common Agricultural Policy. In contrast, developed economies such as the USA (4.5% CAGR), UK (4.3%), and Japan (6.0%) are expanding at a steady 0.77-1.07x of the global growth rate.

Japan leads in feed barley demand growth, fueled by its reliance on imports and rising meat and dairy consumption. The market benefits from strict quality standards and a preference for high-grade barley in livestock diets. Germany and France follow closely, with robust EU-backed sustainability policies and intensive livestock systems supporting a 5.0% CAGR.

The USA market emphasizes region-specific usage, particularly in cattle feed operations across the northern plains, expanding at a moderate 4.5% CAGR. The UK, while stable, sees the slowest growth at 4.3%, shaped by traceability preferences and cautious post-Brexit investment in feed supply systems.

This report provides an in-depth analysis of more than 40+ countries; five top-performing OECD countries are highlighted below.

In-depth Analysis of the Feed Barley Demand in Japan

The feed barley market in Japan is growing at a CAGR of 6% from 2025 to 2035. Growth is driven by high demand for imported barley to support beef and dairy industries. Domestic production is limited due to land constraints, increasing reliance on exporters like Australia, Canada, and Ukraine. Japanese feed manufacturers prioritize grain quality, traceability, and residue-free standards, driving preference for premium barley imports.

  • High reliance on imports for livestock feed
  • Strong demand in dairy, beef, and swine industries

Growth Outlook for the Feed Barley Market in Germany

The sales of feed barley in Germany areexpanding at a 5% CAGR during the forecast period. EU feed regulations and sustainability mandates support steady growth, especially in cattle and swine sectors. Germany benefits from efficient logistics, large-scale feed operations, and a preference for EU-grown barley varieties.

  • Strong EU compliance in ruminant feed
  • Preference for domestically grown barley

Feed Barley Demand Analysis in France

The French feed barley market is projected to grow at a 5% CAGR during the forecast period. National feed programs aim to reduce reliance on imported soy by increasing local barley usage. France’s cattle and poultry sectors absorb large volumes, supported by incentives for traceable and sustainable grain inputs.

  • Emphasis on feed sovereignty and local grain sourcing
  • Major consumers - dairy, beef, and poultry segments

Demand Trajectory for the Feed Barley in the USA

The USA feed barley market is projected to grow at a 4.5% CAGR from 2025 to 2035, or 0.80x the global rate. Demand is concentrated in the northern plains and Pacific Northwest, where barley is grown as a rotational crop. It is widely used in cattle feed, especially in feedlots and backgrounding operations.

  • Regional demand in Northern US cattle farming
  • Barley used alongside corn and sorghum

Feed Barley Market Trends in the UK

The UK feed barley revenue is projected to grow at a 4.3% CAGR from 2025 to 2035, the slowest among top OECD countries at 0.77x the global pace. Demand is driven by traceability standards and consumer preference for grain-fed livestock. Domestic barley production covers most feed needs, though post-Brexit uncertainty has affected long-term investment.

  • Focus on traceable, non-GMO feed grains
  • Stable demand from beef, lamb, and dairy segments

Leading Feed Barley Suppliers and Manufacturers

The feed barley market is moderately fragmented, with leading players like ADM, New Country Organics, Inc., Stone House Grain, The Scoular Company, and Highland Specialty Grains actively shaping supply and innovation. These companies offer barley for livestock, poultry, aquaculture, and specialty feed applications, with a focus on traceability and regional adaptability.

ADM delivers globally integrated supply chain solutions with emphasis on nutritional consistency and regulatory compliance. New Country Organics, Inc. is known for its certified organic feed barley tailored for small farms and specialty livestock. Stone House Grain focuses on regionally grown, non-GMO grains for sustainable agriculture. The Scoular Company supplies value-added barley ingredients with tailored feed formulations across North America. Highland Specialty Grains specializes in forage and high-protein barley for improved ruminant productivity.

Soufflet Group supports European feed operations with traceable, EU-compliant barley. GrainCorp plays a role in exporting Australian barley to Asia and the Middle East. Cargill, Incorporated combines procurement networks with feed R&D to optimize livestock health and growth. Ardent Mills contributes with its milling expertise and robust supply capabilities. AZMY GROUP LLC and other regional players provide locally adapted, nutrient-rich barley varieties that support national feed agendas.

Recent Feed Barley Industry News

  • In May 2025, Cargill expanded its feed production footprint in Mindanao, Philippines, through a new partnership with Biotech to enhance high-quality livestock nutrition solutions.
  • In September 2024, Scoular completed a USD 20 million expansion of its feed blending facility in Jerome, adding a 120-foot concrete feed mill that boosts production capacity by 35% and increases storage capacity by 40% for local dairy and beef producers.

Feed Barley Market Report Scope

Report Attributes Details
Market Size (2025) USD 1.3 billion
Projected Market Size (2035) USD 2.3 billion
CAGR (2025 to 2035) 5.6%
Base Year for Estimation 2024
Historical Period 2020 to 2024
Projections Period 2025 to 2035
Report Parameter USD billion for value / volume in Metric Tons (MT)
Type Analyzed Hulled Barley and Naked Barley
Application Analyzed Aquaculture (Fish, Shrimp, Shellfish, and others), Livestock (Ruminants, Poultry, Swine, Equine, and others), and Pet Food (Dogs, Cats, Horses)
Nature Analyzed Conventional and Organic
Regions Covered North America, Latin America, Europe, East Asia, South Asia, Oceania, Middle East & Africa
Countries Covered United States, United Kingdom, Germany, France, Japan, China, India, Brazil, South Korea, Australia
Key Players Influencing the Market ADM, New Country Organics, Inc., Stone House Grain, The Scoular Company, Highland Specialty Grains, Soufflet Group, GrainCorp, Cargill Incorporated, Ardent Mills, AZMY GROUP LLC, Other Players
Additional Attributes Dollar sales by equipment type, share by power, regional demand growth, policy influence, automation trends, competitive benchmarking

Top Segments Studied in the Feed Barley Market

By Type:

  • Hulled Barley
  • Naked Barley

By Application:

  • Aquaculture
    • Fish
    • Shrimp
    • Shellfish
    • Others
  • Livestock
    • Poultry
    • Ruminants (Cattle, Sheep, Goats)
    • Swine
    • Equine
    • Others
  • Pet Food
    • Dogs
    • Cats
    • Horses

By Nature:

  • Organic
  • Conventional

By Region:

  • North America
  • Latin America
  • Europe
  • East Asia
  • South Asia
  • Oceania
  • Middle East and Africa

Table of Content

  1. Executive Summary
    • Global Market Outlook
    • Demand-side Trends
    • Supply-side Trends
    • Technology Roadmap Analysis
    • Analysis and Recommendations
  2. Market Overview
    • Market Coverage / Taxonomy
    • Market Definition / Scope / Limitations
  3. Market Background
    • Market Dynamics
      • Drivers
      • Restraints
      • Opportunity
      • Trends
    • Scenario Forecast
      • Demand in Optimistic Scenario
      • Demand in Likely Scenario
      • Demand in Conservative Scenario
    • Opportunity Map Analysis
    • Product Life Cycle Analysis
    • Supply Chain Analysis
      • Supply Side Participants and their Roles
        • Producers
        • Mid-Level Participants (Traders/ Agents/ Brokers)
        • Wholesalers and Distributors
      • Value Added and Value Created at Node in the Supply Chain
      • List of Raw Material Suppliers
      • List of Existing and Potential Buyer’s
    • Investment Feasibility Matrix
    • Value Chain Analysis
      • Profit Margin Analysis
      • Wholesalers and Distributors
      • Retailers
    • PESTLE and Porter’s Analysis
    • Regulatory Landscape
      • By Key Regions
      • By Key Countries
    • Regional Parent Market Outlook
    • Production and Consumption Statistics
    • Import and Export Statistics
  4. Global Market Analysis 2020 to 2024 and Forecast, 2025 to 2035
    • Historical Market Size Value (USD Billion) & Volume (Metric Tons) Analysis, 2020 to 2024
    • Current and Future Market Size Value (USD Billion) & Volume (Metric Tons) Projections, 2025 to 2035
      • Y-o-Y Growth Trend Analysis
      • Absolute $ Opportunity Analysis
  5. Global Market Pricing Analysis 2020 to 2024 and Forecast 2025 to 2035
  6. Global Market Analysis 2020 to 2024 and Forecast 2025 to 2035, By Type
    • Introduction / Key Findings
    • Historical Market Size Value (USD Billion) & Volume (Metric Tons) Analysis By Type, 2020 to 2024
    • Current and Future Market Size Value (USD Billion) & Volume (Metric Tons) Analysis and Forecast By Type, 2025 to 2035
      • Hulled Barley
      • Naked Barley
    • Y-o-Y Growth Trend Analysis By Type, 2020 to 2024
    • Absolute $ Opportunity Analysis By Type, 2025 to 2035
  7. Global Market Analysis 2020 to 2024 and Forecast 2025 to 2035, By Application
    • Introduction / Key Findings
    • Historical Market Size Value (USD Billion) & Volume (Metric Tons) Analysis By Application, 2020 to 2024
    • Current and Future Market Size Value (USD Billion) & Volume (Metric Tons) Analysis and Forecast By Application, 2025 to 2035
      • Aquaculture
        • Fish
        • Shrimp
        • Shellfish
        • Others(Algae-based aquaculture, Sea cucumbers, Ornamental fish, Aquatic plants)
      • Livestock
        • Poultry
        • Ruminants (Cattle, Sheep, Goats)
        • Swine
        • Equine
        • Others
      • Pet Food
        • Dogs
        • Cats
        • Horses
    • Y-o-Y Growth Trend Analysis By Application, 2020 to 2024
    • Absolute $ Opportunity Analysis By Application, 2025 to 2035
  8. Global Market Analysis 2020 to 2024 and Forecast 2025 to 2035, By Nature
    • Introduction / Key Findings
    • Historical Market Size Value (USD Billion) & Volume (Metric Tons) Analysis By Nature, 2020 to 2024
    • Current and Future Market Size Value (USD Billion) & Volume (Metric Tons) Analysis and Forecast By Nature, 2025 to 2035
      • Organic
      • Conventional
    • Y-o-Y Growth Trend Analysis By Nature, 2020 to 2024
    • Absolute $ Opportunity Analysis By Nature, 2025 to 2035
  9. Global Market Analysis 2020 to 2024 and Forecast 2025 to 2035, By Region
    • Introduction
    • Historical Market Size Value (USD Billion) & Volume (Metric Tons) Analysis By Region, 2020 to 2024
    • Current Market Size Value (USD Billion) & Volume (Metric Tons) Analysis and Forecast By Region, 2025 to 2035
      • North America
      • Latin America
      • Western Europe
      • Eastern Europe
      • East Asia
      • South Asia & Pacific
      • Middle East and Africa
    • Market Attractiveness Analysis By Region
  10. North America Market Analysis 2020 to 2024 and Forecast 2025 to 2035, By Country
    • Historical Market Size Value (USD Billion) & Volume (Metric Tons) Trend Analysis By Market Taxonomy, 2020 to 2024
    • Market Size Value (USD Billion) & Volume (Metric Tons) Forecast By Market Taxonomy, 2025 to 2035
      • By Country
        • USA
        • Canada
        • Mexico
      • By Type
      • By Application
      • By Nature
    • Market Attractiveness Analysis
      • By Country
      • By Type
      • By Application
      • By Nature
    • Key Takeaways
  11. Latin America Market Analysis 2020 to 2024 and Forecast 2025 to 2035, By Country
    • Historical Market Size Value (USD Billion) & Volume (Metric Tons) Trend Analysis By Market Taxonomy, 2020 to 2024
    • Market Size Value (USD Billion) & Volume (Metric Tons) Forecast By Market Taxonomy, 2025 to 2035
      • By Country
        • Brazil
        • Argentina
        • Rest of LATAM
      • By Type
      • By Application
      • By Nature
    • Market Attractiveness Analysis
      • By Country
      • By Type
      • By Application
      • By Nature
    • Key Takeaways
  12. Western Europe Market Analysis 2020 to 2024 and Forecast 2025 to 2035, By Country
    • Historical Market Size Value (USD Billion) & Volume (Metric Tons) Trend Analysis By Market Taxonomy, 2020 to 2024
    • Market Size Value (USD Billion) & Volume (Metric Tons) Forecast By Market Taxonomy, 2025 to 2035
      • By Country
        • Germany
        • Italy
        • France
        • UK
        • Spain
        • BENELUX
        • Nordic
        • Rest of W.Europe
      • By Type
      • By Application
      • By Nature
    • Market Attractiveness Analysis
      • By Country
      • By Type
      • By Application
      • By Nature
    • Key Takeaways
  13. Eastern Europe Market Analysis 2020 to 2024 and Forecast 2025 to 2035, By Country
    • Historical Market Size Value (USD Billion) & Volume (Metric Tons) Trend Analysis By Market Taxonomy, 2020 to 2024
    • Market Size Value (USD Billion) & Volume (Metric Tons) Forecast By Market Taxonomy, 2025 to 2035
      • By Country
        • Russia
        • Hungary
        • Poland
        • Balkan & Baltics
        • Rest of E. Europe
      • By Type
      • By Application
      • By Nature
    • Market Attractiveness Analysis
      • By Country
      • By Type
      • By Application
      • By Nature
    • Key Takeaways
  14. East Asia Market Analysis 2020 to 2024 and Forecast 2025 to 2035, By Country
    • Historical Market Size Value (USD Billion) & Volume (Metric Tons) Trend Analysis By Market Taxonomy, 2020 to 2024
    • Market Size Value (USD Billion) & Volume (Metric Tons) Forecast By Market Taxonomy, 2025 to 2035
      • By Country
        • China
        • Japan
        • South Korea
      • By Type
      • By Application
      • By Nature
    • Market Attractiveness Analysis
      • By Country
      • By Type
      • By Application
      • By Nature
    • Key Takeaways
  15. South Asia & Pacific Market Analysis 2020 to 2024 and Forecast 2025 to 2035, By Country
    • Historical Market Size Value (USD Billion) & Volume (Metric Tons) Trend Analysis By Market Taxonomy, 2020 to 2024
    • Market Size Value (USD Billion) & Volume (Metric Tons) Forecast By Market Taxonomy, 2025 to 2035
      • By Country
        • India
        • Australia & New Zealand
        • ASEAN
        • Rest of SAP
      • By Type
      • By Application
      • By Nature
    • Market Attractiveness Analysis
      • By Country
      • By Type
      • By Application
      • By Nature
    • Key Takeaways
  16. Middle East and Africa Market Analysis 2020 to 2024 and Forecast 2025 to 2035, By Country
    • Historical Market Size Value (USD Billion) & Volume (Metric Tons) Trend Analysis By Market Taxonomy, 2020 to 2024
    • Market Size Value (USD Billion) & Volume (Metric Tons) Forecast By Market Taxonomy, 2025 to 2035
      • By Country
        • GCC Countries
        • Northern Africa
        • South Africa
        • Turkiye
        • Rest of MEA
      • By Type
      • By Application
      • By Nature
    • Market Attractiveness Analysis
      • By Country
      • By Type
      • By Application
      • By Nature
    • Key Takeaways
  17. Key Countries Market Analysis
    • USA
      • Pricing Analysis
      • Market Share Analysis, 2024
        • By Type
        • By Application
        • By Nature
    • Canada
      • Pricing Analysis
      • Market Share Analysis, 2024
        • By Type
        • By Application
        • By Nature
    • Brazil
      • Pricing Analysis
      • Market Share Analysis, 2024
        • By Type
        • By Application
        • By Nature
    • Mexico
      • Pricing Analysis
      • Market Share Analysis, 2024
        • By Type
        • By Application
        • By Nature
    • Argentina
      • Pricing Analysis
      • Market Share Analysis, 2024
        • By Type
        • By Application
        • By Nature
  18. Market Structure Analysis
    • Competition Dashboard
    • Competition Benchmarking
    • Market Share Analysis of Top Players
      • By Regional
      • By Type
      • By Application
      • By Nature
  19. Competition Analysis
    • Competition Deep Dive
      • ADM
        • Overview
        • Product Portfolio
        • Profitability by Market Segments (Product/Age /Sales Channel/Region)
        • Sales Footprint
        • Strategy Overview
          • Marketing Strategy
          • Product Strategy
          • Channel Strategy
      • New Country Organics, Inc.
        • Overview
        • Product Portfolio
        • Profitability by Market Segments (Product/Age /Sales Channel/Region)
        • Sales Footprint
        • Strategy Overview
          • Marketing Strategy
          • Product Strategy
          • Channel Strategy
      • Stone House Grain
        • Overview
        • Product Portfolio
        • Profitability by Market Segments (Product/Age /Sales Channel/Region)
        • Sales Footprint
        • Strategy Overview
          • Marketing Strategy
          • Product Strategy
          • Channel Strategy
      • The Scoular Company
        • Overview
        • Product Portfolio
        • Profitability by Market Segments (Product/Age /Sales Channel/Region)
        • Sales Footprint
        • Strategy Overview
          • Marketing Strategy
          • Product Strategy
          • Channel Strategy
      • Highland Specialty Grains
        • Overview
        • Product Portfolio
        • Profitability by Market Segments (Product/Age /Sales Channel/Region)
        • Sales Footprint
        • Strategy Overview
          • Marketing Strategy
          • Product Strategy
          • Channel Strategy
      • Soufflet Group
        • Overview
        • Product Portfolio
        • Profitability by Market Segments (Product/Age /Sales Channel/Region)
        • Sales Footprint
        • Strategy Overview
          • Marketing Strategy
          • Product Strategy
          • Channel Strategy
      • GrainCorp.
        • Overview
        • Product Portfolio
        • Profitability by Market Segments (Product/Age /Sales Channel/Region)
        • Sales Footprint
        • Strategy Overview
          • Marketing Strategy
          • Product Strategy
          • Channel Strategy
      • Cargill, Incorporated
        • Overview
        • Product Portfolio
        • Profitability by Market Segments (Product/Age /Sales Channel/Region)
        • Sales Footprint
        • Strategy Overview
          • Marketing Strategy
          • Product Strategy
          • Channel Strategy
      • Ardent Mills
        • Overview
        • Product Portfolio
        • Profitability by Market Segments (Product/Age /Sales Channel/Region)
        • Sales Footprint
        • Strategy Overview
          • Marketing Strategy
          • Product Strategy
          • Channel Strategy
      • AZMY GROUP LLC
        • Overview
        • Product Portfolio
        • Profitability by Market Segments (Product/Age /Sales Channel/Region)
        • Sales Footprint
        • Strategy Overview
          • Marketing Strategy
          • Product Strategy
          • Channel Strategy
  20. Assumptions & Acronyms Used
  21. Research Methodology

List of Tables

  • Table 1: Global Market Value (USD Billion) Forecast by Region, 2020 to 2035
  • Table 2: Global Market Volume (Metric Tons) Forecast by Region, 2020 to 2035
  • Table 3: Global Market Value (USD Billion) Forecast by Type, 2020 to 2035
  • Table 4: Global Market Volume (Metric Tons) Forecast by Type, 2020 to 2035
  • Table 5: Global Market Value (USD Billion) Forecast by Application, 2020 to 2035
  • Table 6: Global Market Volume (Metric Tons) Forecast by Application, 2020 to 2035
  • Table 7: Global Market Value (USD Billion) Forecast by Nature, 2020 to 2035
  • Table 8: Global Market Volume (Metric Tons) Forecast by Nature, 2020 to 2035
  • Table 9: North America Market Value (USD Billion) Forecast by Country, 2020 to 2035
  • Table 10: North America Market Volume (Metric Tons) Forecast by Country, 2020 to 2035
  • Table 11: North America Market Value (USD Billion) Forecast by Type, 2020 to 2035
  • Table 12: North America Market Volume (Metric Tons) Forecast by Type, 2020 to 2035
  • Table 13: North America Market Value (USD Billion) Forecast by Application, 2020 to 2035
  • Table 14: North America Market Volume (Metric Tons) Forecast by Application, 2020 to 2035
  • Table 15: North America Market Value (USD Billion) Forecast by Nature, 2020 to 2035
  • Table 16: North America Market Volume (Metric Tons) Forecast by Nature, 2020 to 2035
  • Table 17: Latin America Market Value (USD Billion) Forecast by Country, 2020 to 2035
  • Table 18: Latin America Market Volume (Metric Tons) Forecast by Country, 2020 to 2035
  • Table 19: Latin America Market Value (USD Billion) Forecast by Type, 2020 to 2035
  • Table 20: Latin America Market Volume (Metric Tons) Forecast by Type, 2020 to 2035
  • Table 21: Latin America Market Value (USD Billion) Forecast by Application, 2020 to 2035
  • Table 22: Latin America Market Volume (Metric Tons) Forecast by Application, 2020 to 2035
  • Table 23: Latin America Market Value (USD Billion) Forecast by Nature, 2020 to 2035
  • Table 24: Latin America Market Volume (Metric Tons) Forecast by Nature, 2020 to 2035
  • Table 25: Western Europe Market Value (USD Billion) Forecast by Country, 2020 to 2035
  • Table 26: Western Europe Market Volume (Metric Tons) Forecast by Country, 2020 to 2035
  • Table 27: Western Europe Market Value (USD Billion) Forecast by Type, 2020 to 2035
  • Table 28: Western Europe Market Volume (Metric Tons) Forecast by Type, 2020 to 2035
  • Table 29: Western Europe Market Value (USD Billion) Forecast by Application, 2020 to 2035
  • Table 30: Western Europe Market Volume (Metric Tons) Forecast by Application, 2020 to 2035
  • Table 31: Western Europe Market Value (USD Billion) Forecast by Nature, 2020 to 2035
  • Table 32: Western Europe Market Volume (Metric Tons) Forecast by Nature, 2020 to 2035
  • Table 33: Eastern Europe Market Value (USD Billion) Forecast by Country, 2020 to 2035
  • Table 34: Eastern Europe Market Volume (Metric Tons) Forecast by Country, 2020 to 2035
  • Table 35: Eastern Europe Market Value (USD Billion) Forecast by Type, 2020 to 2035
  • Table 36: Eastern Europe Market Volume (Metric Tons) Forecast by Type, 2020 to 2035
  • Table 37: Eastern Europe Market Value (USD Billion) Forecast by Application, 2020 to 2035
  • Table 38: Eastern Europe Market Volume (Metric Tons) Forecast by Application, 2020 to 2035
  • Table 39: Eastern Europe Market Value (USD Billion) Forecast by Nature, 2020 to 2035
  • Table 40: Eastern Europe Market Volume (Metric Tons) Forecast by Nature, 2020 to 2035
  • Table 41: East Asia Market Value (USD Billion) Forecast by Country, 2020 to 2035
  • Table 42: East Asia Market Volume (Metric Tons) Forecast by Country, 2020 to 2035
  • Table 43: East Asia Market Value (USD Billion) Forecast by Type, 2020 to 2035
  • Table 44: East Asia Market Volume (Metric Tons) Forecast by Type, 2020 to 2035
  • Table 45: East Asia Market Value (USD Billion) Forecast by Application, 2020 to 2035
  • Table 46: East Asia Market Volume (Metric Tons) Forecast by Application, 2020 to 2035
  • Table 47: East Asia Market Value (USD Billion) Forecast by Nature, 2020 to 2035
  • Table 48: East Asia Market Volume (Metric Tons) Forecast by Nature, 2020 to 2035
  • Table 49: South Asia & Pacific Market Value (USD Billion) Forecast by Country, 2020 to 2035
  • Table 50: South Asia & Pacific Market Volume (Metric Tons) Forecast by Country, 2020 to 2035
  • Table 51: South Asia & Pacific Market Value (USD Billion) Forecast by Type, 2020 to 2035
  • Table 52: South Asia & Pacific Market Volume (Metric Tons) Forecast by Type, 2020 to 2035
  • Table 53: South Asia & Pacific Market Value (USD Billion) Forecast by Application, 2020 to 2035
  • Table 54: South Asia & Pacific Market Volume (Metric Tons) Forecast by Application, 2020 to 2035
  • Table 55: South Asia & Pacific Market Value (USD Billion) Forecast by Nature, 2020 to 2035
  • Table 56: South Asia & Pacific Market Volume (Metric Tons) Forecast by Nature, 2020 to 2035
  • Table 57: Middle East and Africa Market Value (USD Billion) Forecast by Country, 2020 to 2035
  • Table 58: Middle East and Africa Market Volume (Metric Tons) Forecast by Country, 2020 to 2035
  • Table 59: Middle East and Africa Market Value (USD Billion) Forecast by Type, 2020 to 2035
  • Table 60: Middle East and Africa Market Volume (Metric Tons) Forecast by Type, 2020 to 2035
  • Table 61: Middle East and Africa Market Value (USD Billion) Forecast by Application, 2020 to 2035
  • Table 62: Middle East and Africa Market Volume (Metric Tons) Forecast by Application, 2020 to 2035
  • Table 63: Middle East and Africa Market Value (USD Billion) Forecast by Nature, 2020 to 2035
  • Table 64: Middle East and Africa Market Volume (Metric Tons) Forecast by Nature, 2020 to 2035

List of Figures

  • Figure 1: Global Market Volume (Metric Tons) Forecast 2020 to 2035
  • Figure 2: Global Market Pricing Analysis
  • Figure 3: Global Market Value (USD Billion) Forecast 2020 to 2035
  • Figure 4: Global Market Value Share and BPS Analysis by Type, 2025 and 2035
  • Figure 5: Global Market Y-o-Y Growth Comparison by Type, 2025 to 2035
  • Figure 6: Global Market Attractiveness Analysis by Type
  • Figure 7: Global Market Value Share and BPS Analysis by Application, 2025 and 2035
  • Figure 8: Global Market Y-o-Y Growth Comparison by Application, 2025 to 2035
  • Figure 9: Global Market Attractiveness Analysis by Application
  • Figure 10: Global Market Value Share and BPS Analysis by Nature, 2025 and 2035
  • Figure 11: Global Market Y-o-Y Growth Comparison by Nature, 2025 to 2035
  • Figure 12: Global Market Attractiveness Analysis by Nature
  • Figure 13: Global Market Value (USD Billion) Share and BPS Analysis by Region, 2025 and 2035
  • Figure 14: Global Market Y-o-Y Growth Comparison by Region, 2025 to 2035
  • Figure 15: Global Market Attractiveness Analysis by Region
  • Figure 16: North America Market Incremental $ Opportunity, 2025 to 2035
  • Figure 17: Latin America Market Incremental $ Opportunity, 2025 to 2035
  • Figure 18: Western Europe Market Incremental $ Opportunity, 2025 to 2035
  • Figure 19: Eastern Europe Market Incremental $ Opportunity, 2025 to 2035
  • Figure 20: East Asia Market Incremental $ Opportunity, 2025 to 2035
  • Figure 21: South Asia & Pacific Market Incremental $ Opportunity, 2025 to 2035
  • Figure 22: Middle East and Africa Market Incremental $ Opportunity, 2025 to 2035
  • Figure 23: North America Market Value Share and BPS Analysis by Country, 2025 and 2035
  • Figure 24: North America Market Value Share and BPS Analysis by Type, 2025 and 2035
  • Figure 25: North America Market Y-o-Y Growth Comparison by Type, 2025 to 2035
  • Figure 26: North America Market Attractiveness Analysis by Type
  • Figure 27: North America Market Value Share and BPS Analysis by Application, 2025 and 2035
  • Figure 28: North America Market Y-o-Y Growth Comparison by Application, 2025 to 2035
  • Figure 29: North America Market Attractiveness Analysis by Application
  • Figure 30: North America Market Value Share and BPS Analysis by Nature, 2025 and 2035
  • Figure 31: North America Market Y-o-Y Growth Comparison by Nature, 2025 to 2035
  • Figure 32: North America Market Attractiveness Analysis by Nature
  • Figure 33: Latin America Market Value Share and BPS Analysis by Country, 2025 and 2035
  • Figure 34: Latin America Market Value Share and BPS Analysis by Type, 2025 and 2035
  • Figure 35: Latin America Market Y-o-Y Growth Comparison by Type, 2025 to 2035
  • Figure 36: Latin America Market Attractiveness Analysis by Type
  • Figure 37: Latin America Market Value Share and BPS Analysis by Application, 2025 and 2035
  • Figure 38: Latin America Market Y-o-Y Growth Comparison by Application, 2025 to 2035
  • Figure 39: Latin America Market Attractiveness Analysis by Application
  • Figure 40: Latin America Market Value Share and BPS Analysis by Nature, 2025 and 2035
  • Figure 41: Latin America Market Y-o-Y Growth Comparison by Nature, 2025 to 2035
  • Figure 42: Latin America Market Attractiveness Analysis by Nature
  • Figure 43: Western Europe Market Value Share and BPS Analysis by Country, 2025 and 2035
  • Figure 44: Western Europe Market Value Share and BPS Analysis by Type, 2025 and 2035
  • Figure 45: Western Europe Market Y-o-Y Growth Comparison by Type, 2025 to 2035
  • Figure 46: Western Europe Market Attractiveness Analysis by Type
  • Figure 47: Western Europe Market Value Share and BPS Analysis by Application, 2025 and 2035
  • Figure 48: Western Europe Market Y-o-Y Growth Comparison by Application, 2025 to 2035
  • Figure 49: Western Europe Market Attractiveness Analysis by Application
  • Figure 50: Western Europe Market Value Share and BPS Analysis by Nature, 2025 and 2035
  • Figure 51: Western Europe Market Y-o-Y Growth Comparison by Nature, 2025 to 2035
  • Figure 52: Western Europe Market Attractiveness Analysis by Nature
  • Figure 53: Eastern Europe Market Value Share and BPS Analysis by Country, 2025 and 2035
  • Figure 54: Eastern Europe Market Value Share and BPS Analysis by Type, 2025 and 2035
  • Figure 55: Eastern Europe Market Y-o-Y Growth Comparison by Type, 2025 to 2035
  • Figure 56: Eastern Europe Market Attractiveness Analysis by Type
  • Figure 57: Eastern Europe Market Value Share and BPS Analysis by Application, 2025 and 2035
  • Figure 58: Eastern Europe Market Y-o-Y Growth Comparison by Application, 2025 to 2035
  • Figure 59: Eastern Europe Market Attractiveness Analysis by Application
  • Figure 60: Eastern Europe Market Value Share and BPS Analysis by Nature, 2025 and 2035
  • Figure 61: Eastern Europe Market Y-o-Y Growth Comparison by Nature, 2025 to 2035
  • Figure 62: Eastern Europe Market Attractiveness Analysis by Nature
  • Figure 63: East Asia Market Value Share and BPS Analysis by Country, 2025 and 2035
  • Figure 64: East Asia Market Value Share and BPS Analysis by Type, 2025 and 2035
  • Figure 65: East Asia Market Y-o-Y Growth Comparison by Type, 2025 to 2035
  • Figure 66: East Asia Market Attractiveness Analysis by Type
  • Figure 67: East Asia Market Value Share and BPS Analysis by Application, 2025 and 2035
  • Figure 68: East Asia Market Y-o-Y Growth Comparison by Application, 2025 to 2035
  • Figure 69: East Asia Market Attractiveness Analysis by Application
  • Figure 70: East Asia Market Value Share and BPS Analysis by Nature, 2025 and 2035
  • Figure 71: East Asia Market Y-o-Y Growth Comparison by Nature, 2025 to 2035
  • Figure 72: East Asia Market Attractiveness Analysis by Nature
  • Figure 73: South Asia & Pacific Market Value Share and BPS Analysis by Country, 2025 and 2035
  • Figure 74: South Asia & Pacific Market Value Share and BPS Analysis by Type, 2025 and 2035
  • Figure 75: South Asia & Pacific Market Y-o-Y Growth Comparison by Type, 2025 to 2035
  • Figure 76: South Asia & Pacific Market Attractiveness Analysis by Type
  • Figure 77: South Asia & Pacific Market Value Share and BPS Analysis by Application, 2025 and 2035
  • Figure 78: South Asia & Pacific Market Y-o-Y Growth Comparison by Application, 2025 to 2035
  • Figure 79: South Asia & Pacific Market Attractiveness Analysis by Application
  • Figure 80: South Asia & Pacific Market Value Share and BPS Analysis by Nature, 2025 and 2035
  • Figure 81: South Asia & Pacific Market Y-o-Y Growth Comparison by Nature, 2025 to 2035
  • Figure 82: South Asia & Pacific Market Attractiveness Analysis by Nature
  • Figure 83: Middle East and Africa Market Value Share and BPS Analysis by Country, 2025 and 2035
  • Figure 84: Middle East and Africa Market Value Share and BPS Analysis by Type, 2025 and 2035
  • Figure 85: Middle East and Africa Market Y-o-Y Growth Comparison by Type, 2025 to 2035
  • Figure 86: Middle East and Africa Market Attractiveness Analysis by Type
  • Figure 87: Middle East and Africa Market Value Share and BPS Analysis by Application, 2025 and 2035
  • Figure 88: Middle East and Africa Market Y-o-Y Growth Comparison by Application, 2025 to 2035
  • Figure 89: Middle East and Africa Market Attractiveness Analysis by Application
  • Figure 90: Middle East and Africa Market Value Share and BPS Analysis by Nature, 2025 and 2035
  • Figure 91: Middle East and Africa Market Y-o-Y Growth Comparison by Nature, 2025 to 2035
  • Figure 92: Middle East and Africa Market Attractiveness Analysis by Nature
  • Figure 93: Global Market - Tier Structure Analysis
  • Figure 94: Global Market - Company Share Analysis

Frequently Asked Questions

What is the projected size of the feed barley market in 2025?

The market is valued at USD 1.3 billion in 2025.

What is the outlook on feed barley demand by 2035?

The market is forecasted to reach USD 2.3 billion by 2035, reflecting a CAGR of 5.6%.

Which segment leads the feed barley market by type in 2025?

Hulled barley will lead the type segment, accounting for 98% of the global market share in 2025.

What is the top application sector for the feed barley market in 2025?

Livestock feed will dominate the application segment with an 86% share in 2025.

Which country is projected to have the fastest-growing feed barley market?

Japan is projected to grow at the fastest rate, with a CAGR of 6% from 2025 to 2035.

Explore Similar Insights

Future Market Insights

Feed Barley Market