Feed Pigment Market
Market Insights on Feed Pigment covering sales outlook, demand forecast & up-to-date key trends
Feed Pigments Market By Product Type (Carotenoids, Curcumin, Caramel, Spirulina), Source (Natural and Synthetic), Livestock (Swine, Poultry, Ruminants, Aquatic animals) & Region - Forecast 2022 - 2032
Feed Pigments Market Snapshot
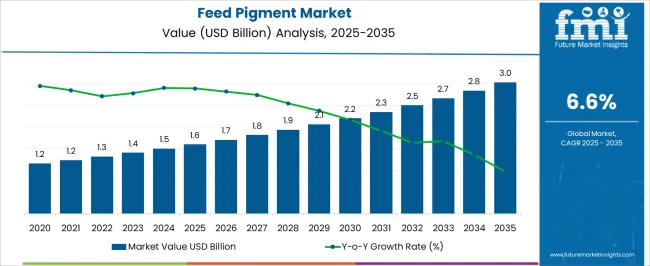
[350 Pages Report] The overall feed pigment market is expected to grow from USD 1,217.4 million in 2022 to USD 1,771.4 million by 2032, at a CAGR of 6.2% from 2022 to 2032.
Feed Pigments Market Size Value in 2022 |
USD 1,217.4 Mn |
Feed Pigments Market Forecast Value in 2032 |
USD 1,771.4 Mn |
Global Growth Rate (2022 to 2032) |
6.2% |
Forecast Period |
2022-2032 |
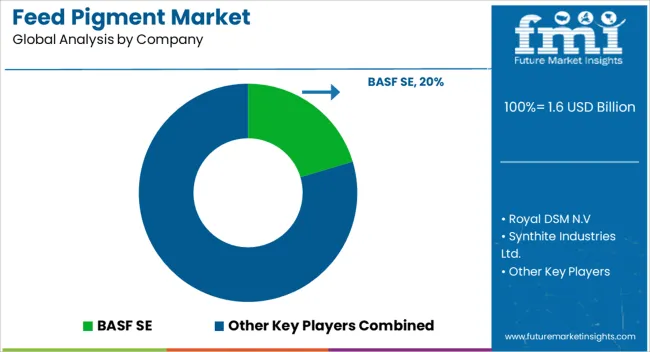
Furthermore, BASF SE, Royal DSM N.V., Novus International Inc., Nutrex NV, Kemin Industries Inc., Behn Meyer Group, Synthite Industries Ltd, Larvicides MarKalsec Inc. are identified as the biggest feed pigment brands.
In 2021, the US feed pigment market grew by 6.6% year on year, bucking initial skepticism about how the market would perform during a global pandemic. On the basis of livestock, the market for feed pigment is divided into five categories: Swine, Poultry, Ruminants, Aquatic animals, and others. The revenue totaled is USD 1,144.2 Bn for 2021 across the globe, according to the Annual Market Analysis conducted by Future Market Insights.
Let us know your requirement to get
100% FREE customization
How The Market Progressed Till June 2022?
Market Statistics |
Details |
H1,2021 (A) |
6.1% |
H1,2022 Projected (P) |
6.2% |
H1,2022 Outlook (O) |
6.8% |
BPS Change : H1,2022 (O) - H1,2022 (P) |
(+) 62 ↑ |
BPS Change : H1,2022 (O) - H1,2021 (A) |
(+) 68.2 ↑ |
FMI provides an evaluation and comparison of the market growth rates and future development possibilities on a half-yearly basis for the global market. Under the subjective influence of macro and industry factors, some demographic and innovation factors have a significant influence on the market.
There have been a number of recent changes in this market, including:
- In 2022, BASF SE launched Lucantin Pink CWD that can be used for coloring fish, trout, and crustaceans to give them an interesting pink color.
- In 2021 Kemin Industries Inc. introduced KEMIN ORO GLO® 20 Dry, which allows for uniform color distribution throughout the meal for more consistent egg coloration. Distribution of colour throughout the feed for a more consistent egg pigmentation
In the first half of 2021, the global market for Feed Pigment grew by 6.1 percent. Though not equally distributed throughout all regions, this growth is stronger in developing markets, where it reached 6.8%. Thus, during H1 2022, there will be a 68.2 BPS point difference between predicted and projected growth.
The primary causes of this variation in growth rate are ascribed to the market's slow or rapid uptake during the first half of the projected period as a result of improving end-user demand in important economies and their expanding populations.
China and India in particular are both experiencing a growth in their consumption patterns, which is driving up demand for the Feed Pigment market. Numerous other market segments should also perform well and have bright development potential in the second half of the projected period.
Despite these promising developments, the business is still expected to face significant obstacles, such as shifting customer preferences, strict trade restrictions, and a lack of security in the supply of raw materials and other manufacturing inputs.
Key Market Drivers For Feed Pigments
The increased demand for lean meat, rising health consciousness among consumers about the consumption of nutritious food, expanding urbanization, and rising disposable income are the primary drivers driving the growth of the feed pigment industry. Furthermore, the rising demand for healthy and safe livestock, combined with the developing meat sector, is anticipated to accelerate the market forward.
Carotenoids' animal health benefits, rising meat consumption, modernization of the hog, poultry, and aquaculture industries, and a growing demand for pellet feed are all likely to propel the global feed pigment market forward.
Major Trends To Look Out For
High-quality feed pigments aid in the refinement of animal products' commercial value, and rising meat consumption are two factors that are expected to raise demand for feed pigments over the projected period, propelling the worldwide feed pigments market.
Acknowledgment of astaxanthin feed pigment between feed producers, feed pigments' operation as hormonal precursors and colorants antioxidants to protect animals from various improving overall animal health are some of the significant factors expected to drive the global feed pigment markets' revenue growth.
Innovation And Marketing Beneficial Components For Emerging Demands
Manufacturers may be able to generate additional money by developing novel strategies to boost manufacturing capacity when the consumption of feed products grows rapidly. Major market participants, particularly in the United States, are engaged in the research and development of new feed pigment production procedures.
Another major aspect projected to fuel the target market's growth is increased awareness of the aquaculture and poultry industries. Furthermore, feed pigments have a variety of health benefits, including increased palatability and organoleptic advances, which are projected to drive market expansion in the near future if marketed to the target audience well.
Find your sweet spots for generating winning opportunities in this market.
Talk to AnalystRestraints And Barriers Holding Back The Market Expansion
Market growth is being stifled by issues such as raw material price instability, global overcapacity, and environmental concerns. Furthermore, the availability of cheaper substitutes is expected to slow growth during the forecast period. The feed pigment market is projected to benefit from a shift in consumer preference toward pellet feed use. Throughout the projection period, high manufacturing and administration expenses for synthetic pigment processing are projected to stifle global market growth.
Country-Wise Analysis
The USA accounted for 35% of the total sales in 2021 with a CAGR of 6.6% for 2021. This dominance can be linked to increasing research and development initiatives, increased knowledge of the benefits of animal nutrition, and farmer acceptance of feed pigments in this region and across North America.
The market in Germany is seeing considerable growth of roughly 5.6%. In 2021, Germany and France were the two largest country marketplaces in the European area. This industry is growing as people become more aware of the benefits of feed pigments. Additionally, adding feed pigments is a cost-effective solution that has resulted in improved meat product sales in the European market.
With total revenue contribution of Asia-Pacific region is ~32%, China has the greatest market share. Due to the rising population, better consumer lifestyles, and China being one of the largest feed pigment producers in the Asia Pacific region, the market is expected to grow significantly over the forecast period.
Furthermore, due to an increasing preference among persons for safe and nutritious feeds, increased aquaculture and poultry enterprises, and increased meat product consumption in this region, the market is expected to grow at a healthy rate of 6.2% over the forecast period.

A unified Market Research Subscription Platform, built for today's disparate research needs.
Category wise analysis
Why Is The Poultry Livestock Segment Key To Revenue Generation For The Feed Pigment Market?
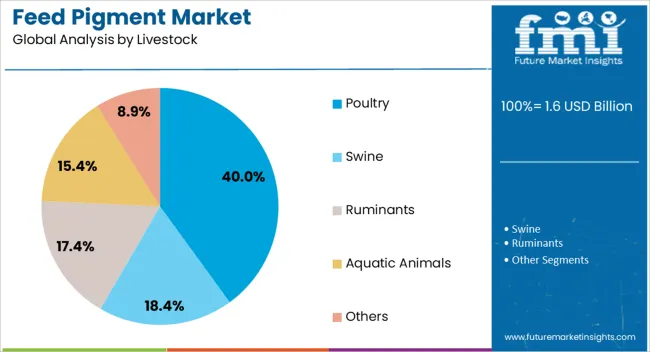
The Poultry segment had the highest share in 2021. Because of the reasons that contribute to the increased consumption of chicken products, meat producers must place a greater emphasis on the quality of additives provided to these birds. This segment's demand is being fuelled by these causes.
How Is The Natural Feed Pigments Segment Projected To Be The Fastest Growing?
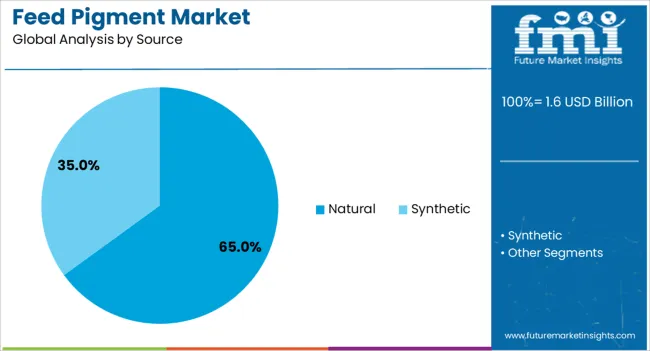
In terms of value and revenue, the natural feed pigments sector has the biggest market share. The elements that contribute to consumers' rising disdain of chemical substances. The extraction of these compounds from vegetable sources, stabilization, and combination with suitable carriers to improve their natural properties are all part of the manufacturing process.
Why Is Carotenoid Segment Important For The Market?
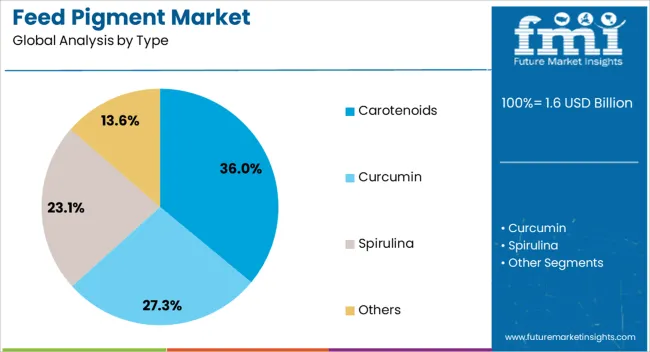
The carotenoid segment has significant share and is expected to grow at the fastest rate of 5.8% over the next several years based on the product type. Carotenoids are nutrients added to animal feed to support animal health and improve product quality. The demand for carotenoids is increasing as new forms of concentrated carotenoids are created to assist feedstuff formulators in providing sufficient carotenoids to animals at any given moment.
Impact of COVID-19 on the Market
COVID-19 has had an economic and industrial impact on a number of countries as a result of lockdowns, travel bans, and business closures. Food and beverage are one of the key industries experiencing supply chain and manufacturing disruptions as a result of workplace closures.
Supplier power and market competition increase when companies in the feed pigment industry store up on raw resources. Consumers are anticipated to gravitate toward plant-based alternatives as cattle disease frequency rises and COVID-19 behavioral components become more prevalent. In addition, trade restrictions, supply chain disruptions, and restaurant and store lockdowns are projected to stifle industry growth in the coming months.
Scope Of Report
Attribute |
Details |
Feed Pigments Market Size Value in 2022 |
USD 1,217.4 Mn |
Feed Pigments Market Forecast Value in 2032 |
USD 1,771.4 Mn |
Global Growth Rate (2022 to 2032) |
6.2% |
Forecast Period |
2022-2032 |
Historical Data Available for |
2017-2021 |
Market Analysis |
USD Mn for Value & MT for Volume |
Key Regions Covered |
|
Key Countries Covered |
|
Key Segments Covered |
|
Key Companies Profiled |
|
Pricing |
Available upon Request |
Segmentation
By Product Type:
- Carotenoids
- â-carotene
- Lutein
- Lycopene
- Astaxanthin
- Zeaxanthin
- Canthaxanthin
- Others
- Curcumin
- Caramel
- Spirulina
- Others
By Source:
- Natural
- Synthetic
By Livestock:
- Swine
- Poultry
- Ruminants
- Aquatic animals
- Others
Frequently Asked Questions
How much is the current worth of the feed pigment market?
Currently feed pigment market is worth more than USD 1,217.4 Mn.
At what CAGR is the market expected to grow?
Feed pigment based products consumption is expected to grow at a CAGR of around 6.2% during the period 2022-2032.
How was the performance in the last five years?
In terms of revenue, the feed pigment market grew at a CAGR of around 5.6% during 2017-2022.
What is the demand outlook forecast for feed pigment?
The global feed pigment market was forecasted to surpass USD 1,771.4 Mn by the end of 2032.
Who are the top 5 players operating in the market?
BASF SE, Royal DSM N.V., Novus International Inc., Nutrex NV, and Kemin Industries Inc.are expected to be the top players driving the market growth.
How are market players reacting to the new developments in the market?
Market players are focusing on new product launches, strong distribution channels, and merger-acquisition strategies to remain a prominent player in the global market.
Which are the major countries driving demand for the feed pigment market?
United States, Canada, China, Brazil, the U.K., and India are the major countries driving demand for feed pigment.
What outlook does Europe provide?
Europe holds around 34% of the total feed pigment market’s revenue share.
At what rate will the U.S. feed pigment market grow?
The U.S. feed pigment market is projected to grow at a CAGR of around 6.6% over the next ten years.
At what level does the report reflect pricing analysis?
The report presents a detailed cost analysis of the feed pigment market based on livestock i.e. Swine, Poultry, Ruminants, Aquatic Animals, and Others.
Table of Content
1. Market Overview 1.1. Market Coverage / Taxonomy 1.2. Market Definition / Scope / Limitations 2. The Massive Impact of the Crisis 2.1. Global Market Forecast Scenario Comparison of Annual Growth Rates for short Term (2022-2026) and Long Term (2027-2032) 2.1.1. Optimistic Scenario 2.1.1.1. China 2.1.1.2. US 2.1.1.3. India 2.1.1.4. Euro Zone 2.1.1.5. Asia Pacific 2.1.1.6. Rest of the World 2.1.2. Likely Scenario 2.1.2.1. China 2.1.2.2. US 2.1.2.3. India 2.1.2.4. Euro Zone 2.1.2.5. Asia Pacific 2.1.2.6. Rest of the World 2.1.3. Pessimistic Scenario 2.1.3.1. China 2.1.3.2. US 2.1.3.3. India 2.1.3.4. Euro Zone 2.1.3.5. Asia Pacific 2.1.3.6. Rest of the World 2.2. Key Factors Impacting the Market Note: Market Assessment shall be Provided for Likely Scenario 3. Market Dynamics 3.1. Drivers 3.1.1. Supply Side Drivers 3.1.2. Demand Side drivers 3.1.3. Economic Side Drivers 3.2. Restraints 3.3. Opportunity 3.4. Market trends By Region 3.5. Product Launches 3.6. Product Claims & Nutritional Information Scan by Buyers 3.7. Macro-Economic Factors 3.8. Forecast Factors - Relevance & Impact 3.9. Consumers Survey Analysis 4. Key Regulations 4.1. Packaging & Labelling Regulations 4.2. Certifications and Certifying Agency Overview 4.3. Import/Export Policies 5. Global Market Demand Analysis 2017-2021 and Forecast, 2022-2032 5.1. Historical Market Volume (Metric Tons) Analysis, 2017-2021 5.2. Current and Future Market Volume (Metric Tons) Projections, 2022-2032 5.3. Y-o-Y Growth Trend Analysis 6. Global Market - Pricing Analysis 6.1. Regional Pricing Analysis (USD/Metric Tons) By Source (2017,2022,2032) 6.1.1. Natural 6.1.2. Synthetic 6.2. Pricing Break-up (2017,2022,2032) 6.2.1. Producer Level Pricing 6.2.2. Distributor Level Pricing 6.2.3. Retailer Level Pricing 6.3. Global Average Pricing Analysis Benchmark 7. Global Market Demand (Size in USD Mn) Analysis 2017-2021 and Forecast, 2022-2032 7.1. Historical Market Value (USD Mn) Analysis, 2017-2021 7.2. Current and Future Market Value (USD Mn) Projections, 2022-2032 7.2.1. Y-o-Y Growth Trend Analysis 7.2.2. Absolute $ Opportunity Analysis 8. Global Market Analysis 2017-2021 and Forecast 2022-2032, By Product Type 8.1. Introduction / Key Findings 8.2. Historical Market Size (USD Mn) and Volume Analysis By Product Type, 2017 - 2021 8.3. Current and Future Market Size (USD Mn) and Volume Analysis and Forecast By Product Type, 2022-2032 8.3.1. Carotenoids 8.3.1.1. â-carotene 8.3.1.2. Lutein 8.3.1.3. Lycopene 8.3.1.4. Astaxanthin 8.3.1.5. Zeaxanthin 8.3.1.6. Canthaxanthin 8.3.1.7. Others 8.3.2. Curcumin 8.3.3. Caramel 8.3.4. Spirulina 8.3.5. Others 8.4. Market Attractiveness Analysis By Product Type 9. Global Market Analysis 2017-2021 and Forecast 2022-2032, by Source 9.1. Introduction / Key Findings 9.2. Historical Market Size (USD Mn) and Volume Analysis By Source, 2017 - 2021 9.3. Current and Future Market Size (USD Mn) and Volume Analysis and Forecast By Source, 2022-2032 9.3.1. Natural 9.3.2. Synthetic 9.4. Market Attractiveness Analysis by Source 10. Global Market Analysis 2017-2021 and Forecast 2022-2032, By Livestock 10.1. Introduction / Key Findings 10.2. Historical Market Size (USD Mn) and Volume Analysis By Livestock, 2017 - 2021 10.3. Current and Future Market Size (USD Mn) and Volume Analysis and Forecast By Livestock, 2022-2032 10.3.1. Swine 10.3.2. Poultry 10.3.3. Ruminants 10.3.4. Aquatic animals 10.3.5. Others 10.4. Market Attractiveness Analysis by Livestock 11. Global Market Analysis 2017-2021 and Forecast 2022-2032, By Region 11.1. Introduction 11.2. Historical Market Size (USD Mn) and Volume Analysis By Region, 2017 - 2021 11.3. Current Market Size (USD Mn) and Volume Analysis and Forecast By Region, 2022-2032 11.3.1. North America 11.3.2. Latin America 11.3.3. Europe 11.3.4. East Asia 11.3.5. South Asia 11.3.6. Oceania 11.3.7. MEA 11.4. Market Attractiveness Analysis By Region 12. North America Market Analysis 2017-2021 and Forecast 2022-2032 12.1. Introduction 12.2. Pricing Analysis 12.3. Historical Market Size (USD Mn) and Volume Trend Analysis By Market Taxonomy, 2017 - 2021 12.4. Market Size (USD Mn) and Volume Forecast By Market Taxonomy, 2021 - 2031 12.4.1. By Country 12.4.1.1. U.S. 12.4.1.2. Canada 12.4.2. By Product Type 12.4.3. By Source 12.4.4. By Livestock 12.5. Market Attractiveness Analysis 12.5.1. By Product Type 12.5.2. By Source 12.5.3. By Livestock 12.6. Market Trends 12.7. Key Market Participants - Intensity Mapping 12.8. Drivers and Restraints - Impact Analysis 13. Latin America Market Analysis 2017-2021 and Forecast 2022-2032 13.1. Introduction 13.2. Pricing Analysis 13.3. Historical Market Size (USD Mn) and Volume Trend Analysis By Market Taxonomy, 2017 - 2021 13.4. Market Size (USD Mn) and Volume Forecast By Market Taxonomy, 2021 - 2031 13.4.1. By Country 13.4.1.1. Brazil 13.4.1.2. Mexico 13.4.1.3. Rest of Latin America 13.4.2. By Product Type 13.4.3. By Source 13.4.4. By Livestock 13.5. Market Attractiveness Analysis 13.5.1. By Product Type 13.5.2. By Source 13.5.3. By Livestock 13.6. Market Trends 13.7. Key Market Participants - Intensity Mapping 13.8. Drivers and Restraints - Impact Analysis 14. Europe Market Analysis 2017-2021 and Forecast 2022-2032 14.1. Introduction 14.2. Pricing Analysis 14.3. Historical Market Size (USD Mn) and Volume Trend Analysis By Market Taxonomy, 2017 - 2021 14.4. Market Size (USD Mn) and Volume Forecast By Market Taxonomy, 2021 - 2031 14.4.1. By Country 14.4.1.1. German 14.4.1.2. Italy 14.4.1.3. France 14.4.1.4. U.K 14.4.1.5. Spain 14.4.1.6. BENELUX 14.4.1.7. Nordic 14.4.1.8. Russia 14.4.1.9. Poland 14.4.1.10. Rest of Western Europe 14.4.2. By Product Type 14.4.3. By Source 14.4.4. By Livestock 14.5. Market Attractiveness Analysis 14.5.1. By Product Type 14.5.2. By Source 14.5.3. By Livestock 14.6. Market Trends 14.7. Key Market Participants - Intensity Mapping 14.8. Drivers and Restraints - Impact Analysis 15. East Asia Market Analysis 2017-2021 and Forecast 2022-2032 15.1. Introduction 15.2. Pricing Analysis 15.3. Historical Market Size (USD Mn) and Volume Trend Analysis By Market Taxonomy, 2017 - 2021 15.4. Market Size (USD Mn) and Volume Forecast By Market Taxonomy, 2021 - 2031 15.4.1. By Country 15.4.1.1. Chin 15.4.1.2. Japan 15.4.1.3. South Korea 15.4.2. By Product Type 15.4.3. By Source 15.4.4. By Livestock 15.5. Market Attractiveness Analysis 15.5.1. By Product Type 15.5.2. By Source 15.5.3. By Livestock 15.6. Market Trends 15.7. Key Market Participants - Intensity Mapping 15.8. Drivers and Restraints - Impact Analysis 16. South Asia Market Analysis 2017-2021 and Forecast 2022-2032 16.1. Introduction 16.2. Pricing Analysis 16.3. Historical Market Size (USD Mn) and Volume Trend Analysis By Market Taxonomy, 2017 - 2021 16.4. Market Size (USD Mn) and Volume Forecast By Market Taxonomy, 2021 - 2031 16.4.1. By Country 16.4.1.1. India 16.4.1.2. Thailand 16.4.1.3. Indonesia 16.4.1.4. Malaysia 16.4.1.5. Singapore 16.4.1.6. Rest of South Asia 16.4.2. By Product Type 16.4.3. By Source 16.4.4. By Livestock 16.5. Market Attractiveness Analysis 16.5.1. By Product Type 16.5.2. By Source 16.5.3. By Livestock 16.6. Market Trends 16.7. Key Market Participants - Intensity Mapping 16.8. Drivers and Restraints - Impact Analysis 17. Oceania Market Analysis 2017-2021 and Forecast 2022-2032 17.1. Introduction 17.2. Pricing Analysis 17.3. Historical Market Size (USD Mn) and Volume Trend Analysis By Market Taxonomy, 2017 - 2021 17.4. Market Size (USD Mn) and Volume Forecast By Market Taxonomy, 2021 - 2031 17.4.1. By Country 17.4.1.1. Australia 17.4.1.2. New Zealand 17.4.2. By Product Type 17.4.3. By Source 17.4.4. By Livestock 17.5. Market Attractiveness Analysis 17.5.1. By Product Type 17.5.2. By Source 17.5.3. By Livestock 17.6. Market Trends 17.7. Key Market Participants - Intensity Mapping 17.8. Drivers and Restraints - Impact Analysis 18. Middle East and Africa Market Analysis 2017-2021 and Forecast 2022-2032 18.1. Introduction 18.2. Pricing Analysis 18.3. Historical Market Size (USD Mn) and Volume Trend Analysis By Market Taxonomy, 2017 - 2021 18.4. Market Size (USD Mn) and Volume Forecast By Market Taxonomy, 2021 - 2031 18.4.1. By Country 18.4.1.1. GCC Countries, 18.4.1.2. South Africa 18.4.1.3. Rest of MEA 18.4.2. By Product Type 18.4.3. By Source 18.4.4. By Livestock 18.5. Market Attractiveness Analysis 18.5.1. By Product Type 18.5.2. By Source 18.5.3. By Livestock 18.6. Market Trends 18.7. Key Market Participants - Intensity Mapping 18.8. Drivers and Restraints - Impact Analysis 19. Key Countries Market Analysis 2017–2021 and Forecast 2022–2032 19.1. U.S. 19.1.1. Pricing Analysis (2017, 2022, 2032) 19.1.2. Market Value and Volume Analysis 2017–2021 and Forecast 2022–2032 19.1.2.1. By Product Type 19.1.2.2. By Source 19.1.2.3. By Livestock 19.2. Canada 19.2.1. Pricing Analysis (2017, 2022, 2032) 19.2.2. Market Value and Volume Analysis 2017–2021 and Forecast 2022–2032 19.2.2.1. By Product Type 19.2.2.2. By Source 19.2.2.3. By Livestock 19.3. Brazil 19.3.1. Pricing Analysis (2017, 2022, 2032) 19.3.2. Market Value and Volume Analysis 2017–2021 and Forecast 2022–2032 19.3.2.1. By Product Type 19.3.2.2. By Source 19.3.2.3. By Livestock 19.4. Argentina 19.4.1. Pricing Analysis (2017, 2022, 2032) 19.4.2. Market Value and Volume Analysis 2017–2021 and Forecast 2022–2032 19.4.2.1. By Product Type 19.4.2.2. By Source 19.4.2.3. By Livestock 19.5. Chile 19.5.1. Pricing Analysis (2017, 2022, 2032) 19.5.2. Market Value and Volume Analysis 2017–2021 and Forecast 2022–2032 19.5.2.1. By Product Type 19.5.2.2. By Source 19.5.2.3. By Livestock 19.6. Mexico 19.6.1. Pricing Analysis (2017, 2022, 2032) 19.6.2. Market Value and Volume Analysis 2017–2021 and Forecast 2022–2032 19.6.2.1. By Product Type 19.6.2.2. By Source 19.6.2.3. By Livestock 19.7. Germany 19.7.1. Pricing Analysis (2017, 2022, 2032) 19.7.2. Market Value and Volume Analysis 2017–2021 and Forecast 2022–2032 19.7.2.1. By Product Type 19.7.2.2. By Source 19.7.2.3. By Livestock 19.8. Italy 19.8.1. Pricing Analysis (2017, 2022, 2032) 19.8.2. Market Value and Volume Analysis 2017–2021 and Forecast 2022–2032 19.8.2.1. By Product Type 19.8.2.2. By Source 19.8.2.3. By Livestock 19.9. France 19.9.1. Pricing Analysis (2017, 2022, 2032) 19.9.2. Market Value and Volume Analysis 2017–2021 and Forecast 2022–2032 19.9.2.1. By Product Type 19.9.2.2. By Source 19.9.2.3. By Livestock 19.10. U.K. 19.10.1. Pricing Analysis (2017, 2022, 2032) 19.10.2. Market Value and Volume Analysis 2017–2021 and Forecast 2022–2032 19.10.2.1. By Product Type 19.10.2.2. By Source 19.10.2.3. By Livestock 19.11. Spain 19.11.1. Pricing Analysis (2017, 2022, 2032) 19.11.2. Market Value and Volume Analysis 2017–2021 and Forecast 2022–2032 19.11.2.1. By Product Type 19.11.2.2. By Source 19.11.2.3. By Livestock 19.12. BENELUX 19.12.1. Pricing Analysis (2017, 2022, 2032) 19.12.2. Market Value and Volume Analysis 2017–2021 and Forecast 2022–2032 19.12.2.1. By Product Type 19.12.2.2. By Source 19.12.2.3. By Livestock 19.13. Nordic 19.13.1. Pricing Analysis (2017, 2022, 2032) 19.13.2. Market Value and Volume Analysis 2017–2021 and Forecast 2022–2032 19.13.2.1. By Product Type 19.13.2.2. By Source 19.13.2.3. By Livestock 19.14. Russia 19.14.1. Pricing Analysis (2017, 2022, 2032) 19.14.2. Market Value and Volume Analysis 2017–2021 and Forecast 2022–2032 19.14.2.1. By Product Type 19.14.2.2. By Source 19.14.2.3. By Livestock 19.15. Poland 19.15.1. Pricing Analysis (2017, 2022, 2032) 19.15.2. Market Value and Volume Analysis 2017–2021 and Forecast 2022–2032 19.15.2.1. By Product Type 19.15.2.2. By Source 19.15.2.3. By Livestock 19.15.2.4. 19.16. China 19.16.1. Pricing Analysis (2017, 2022, 2032) 19.16.2. Market Value and Volume Analysis 2017–2021 and Forecast 2022–2032 19.16.2.1. By Product Type 19.16.2.2. By Source 19.16.2.3. By Livestock 19.17. Japan 19.17.1. Pricing Analysis (2017, 2022, 2032) 19.17.2. Market Value and Volume Analysis 2017–2021 and Forecast 2022–2032 19.17.2.1. By Product Type 19.17.2.2. By Source 19.17.2.3. By Livestock 19.18. South Korea 19.18.1. Pricing Analysis (2017, 2022, 2032) 19.18.2. Market Value and Volume Analysis 2017–2021 and Forecast 2022–2032 19.18.2.1. By Product Type 19.18.2.2. By Source 19.18.2.3. By Livestock 19.19. India 19.19.1. Pricing Analysis (2017, 2022, 2032) 19.19.2. Market Value and Volume Analysis 2017–2021 and Forecast 2022–2032 19.19.2.1. By Product Type 19.19.2.2. By Source 19.19.2.3. By Livestock 19.20. Thailand 19.20.1. Pricing Analysis (2017, 2022, 2032) 19.20.2. Market Value and Volume Analysis 2017–2021 and Forecast 2022–2032 19.20.2.1. By Product Type 19.20.2.2. By Source 19.20.2.3. By Livestock 19.21. Indonesia 19.21.1. Pricing Analysis (2017, 2022, 2032) 19.21.2. Market Value and Volume Analysis 2017–2021 and Forecast 2022–2032 19.21.2.1. By Product Type 19.21.2.2. By Source 19.21.2.3. By Livestock 19.22. Malaysia 19.22.1. Pricing Analysis (2017, 2022, 2032) 19.22.2. Market Value and Volume Analysis 2017–2021 and Forecast 2022–2032 19.22.2.1. By Product Type 19.22.2.2. By Source 19.22.2.3. By Livestock 19.23. Singapore 19.23.1. Pricing Analysis (2017, 2022, 2032) 19.23.2. Market Value and Volume Analysis 2017–2021 and Forecast 2022–2032 19.23.2.1. By Product Type 19.23.2.2. By Source 19.23.2.3. By Livestock 19.24. GCC Countries 19.24.1. Pricing Analysis (2017, 2022, 2032) 19.24.2. Market Value and Volume Analysis 2017–2021 and Forecast 2022–2032 19.24.2.1. By Product Type 19.24.2.2. By Source 19.24.2.3. By Livestock 19.25. South Africa 19.25.1. Pricing Analysis (2017, 2022, 2032) 19.25.2. Market Value and Volume Analysis 2017–2021 and Forecast 2022–2032 19.25.2.1. By Product Type 19.25.2.2. By Source 19.25.2.3. By Livestock 20. Market Structure Analysis 20.1. Market Analysis by Tier of Companies 20.2. Company Share Analysis of Top Players 20.2.1. By Product Type 20.3. Market Presence Analysis 20.3.1. By Regional Footprint of Players 20.3.2. Product Footprint by Players 20.3.3. Channel Footprint by Players 21. Competition Analysis 21.1. Competition Dashboard 21.2. Competition Deep Dive (Tentative List) 21.2.1.1. BASF SE 21.2.1.2. Overview 21.2.1.3. Product Portfolio 21.2.1.4. Profitability by Market Segments (Product/Channel/Region) 21.2.1.5. Sales Footprint 21.2.1.6. Strategy Overview 21.2.1.6.1. Marketing Strategy 21.2.1.6.2. Product Strategy 21.2.2. Royal DSM NV 21.2.2.1. Overview 21.2.2.2. Product Portfolio 21.2.2.3. Profitability by Market Segments (Product/Channel/Region) 21.2.2.4. Sales Footprint 21.2.2.5. Strategy Overview 21.2.2.5.1. Marketing Strategy 21.2.2.5.2. Product Strategy 21.2.3. Kemin Industries, Inc 21.2.3.1. Overview 21.2.3.2. Product Portfolio 21.2.3.3. Profitability by Market Segments (Product/Channel/Region) 21.2.3.4. Sales Footprint 21.2.3.5. Strategy Overview 21.2.3.5.1. Marketing Strategy 21.2.3.5.2. Product Strategy 21.2.4. International, Inc. 21.2.4.1. Overview 21.2.4.2. Product Portfolio 21.2.4.3. Profitability by Market Segments (Product/Channel/Region) 21.2.4.4. Sales Footprint 21.2.4.5. Strategy Overview 21.2.4.5.1. Marketing Strategy 21.2.4.5.2. Product Strategy 21.2.5. Guangzhou Leader Bio-Technology Co., Ltd. 21.2.5.1. Overview 21.2.5.2. Product Portfolio 21.2.5.3. Profitability by Market Segments (Product/Channel/Region) 21.2.5.4. Sales Footprint 21.2.5.5. Strategy Overview 21.2.5.5.1. Marketing Strategy 21.2.5.5.2. Product Strategy 21.2.6. D.D. Williamson & Co., Inc. 21.2.6.1. Overview 21.2.6.2. Product Portfolio 21.2.6.3. Profitability by Market Segments (Product/Channel/Region) 21.2.6.4. Sales Footprint 21.2.6.5. Strategy Overview 21.2.6.5.1. Marketing Strategy 21.2.6.5.2. Product Strategy 21.2.7. Nutrex NV 21.2.7.1. Overview 21.2.7.2. Product Portfolio 21.2.7.3. Profitability by Market Segments (Product/Channel/Region) 21.2.7.4. Sales Footprint 21.2.7.5. Strategy Overview 21.2.7.5.1. Marketing Strategy 21.2.7.5.2. Product Strategy 21.2.8. Behn Meyer Group 21.2.8.1. Overview 21.2.8.2. Product Portfolio 21.2.8.3. Profitability by Market Segments (Product/Channel/Region) 21.2.8.4. Sales Footprint 21.2.8.5. Strategy Overview 21.2.8.5.1. Marketing Strategy 21.2.8.5.2. Product Strategy 21.2.9. Vitafor NV 21.2.9.1. Overview 21.2.9.2. Product Portfolio 21.2.9.3. Profitability by Market Segments (Product/Channel/Region) 21.2.9.4. Sales Footprint 21.2.9.5. Strategy Overview 21.2.9.5.1. Marketing Strategy 21.2.9.5.2. Product Strategy 21.2.10. Innovad AD 21.2.10.1. Overview 21.2.10.2. Product Portfolio 21.2.10.3. Profitability by Market Segments (Product/Channel/Region) 21.2.10.4. Sales Footprint 21.2.10.5. Strategy Overview 21.2.10.5.1. Marketing Strategy 21.2.10.5.2. Product Strategy 21.2.11. Other Players (On Additional Requests) 21.2.11.1. Overview 21.2.11.2. Product Portfolio 21.2.11.3. Profitability by Market Segments (Product/Channel/Region) 21.2.11.4. Sales Footprint 21.2.11.5. Strategy Overview 21.2.11.5.1. Marketing Strategy 21.2.11.5.2. Product Strategy 22. Value Chain Analysis 22.1. Operating margins at each node of supply chain 22.2. List of Active Market Participants 22.2.1. Product Manufacturers 22.2.2. Key Brands 23. Assumptions and Acronyms Used 24. Research Methodology
Let us know your requirement to get
100% FREE customization
List of Tables
Table 1: Global Market Value (USD Mn) and Forecast by Region, 2017-2021 Table 2: Global Market Value (USD Mn) and Forecast by Region, 2022-2032 Table 3: Global Market Volume (Metric Tons) and Forecast by Region, 2017-2021 Table 4: Global Market Volume (Metric Tons) and Forecast by Region, 2022-2032 Table 5: Global Market Value (USD Mn) and Forecast by Source, 2017-2021 Table 6: Global Market Value (USD Mn) and Forecast by Source, 2022-2032 Table 7: Global Market Volume (Metric Tons) and Forecast by Source, 2017-2021 Table 8: Global Market Volume (Metric Tons) and Forecast by Source, 2022-2032 Table 9: Global Market Value (USD Mn) and Forecast by Livestock, 2017-2021 Table 10: Global Market Value (USD Mn) and Forecast by Livestock, 2022-2032 Table 11: Global Market Volume (Metric Tons) and Forecast by Livestock, 2017-2021 Table 12: Global Market Volume (Metric Tons) and Forecast by Livestock, 2022-2032 Table 13: Global Market Value (USD Mn) and Forecast by Product Type, 2017-2021 Table 14: Global Market Value (USD Mn) and Forecast by Product Type, 2022-2032 Table 15: Global Market Volume (Metric Tons) and Forecast by Product Type, 2017-2021 Table 16: Global Market Volume (Metric Tons) and Forecast by Product Type, 2022-2032 Table 17: North America Market Value (USD Mn) and Forecast by Region, 2017-2021 Table 18: North America Market Value (USD Mn) and Forecast by Region, 2022-2032 Table 19: North America Market Volume (Metric Tons) and Forecast by Region, 2017-2021 Table 20: North America Market Volume (Metric Tons) and Forecast by Region, 2022-2032 Table 21: North America Market Value (USD Mn) and Forecast by Source, 2017-2021 Table 22: North America Market Value (USD Mn) and Forecast by Source, 2022-2032 Table 23: North America Market Volume (Metric Tons) and Forecast by Source, 2017-2021 Table 24: North America Market Volume (Metric Tons) and Forecast by Source, 2022-2032 Table 25: North America Market Value (USD Mn) and Forecast by Livestock, 2017-2021 Table 26: North America Market Value (USD Mn) and Forecast by Livestock, 2022-2032 Table 27: North America Market Volume (Metric Tons) and Forecast by Livestock, 2017-2021 Table 28: North America Market Volume (Metric Tons) and Forecast by Livestock, 2022-2032 Table 29: North America Market Value (USD Mn) and Forecast by Product Type, 2017-2021 Table 30: North America Market Value (USD Mn) and Forecast by Product Type, 2022-2032 Table 31: North America Market Volume (Metric Tons) and Forecast by Product Type, 2017-2021 Table 32: North America Market Volume (Metric Tons) and Forecast by Product Type, 2022-2032 Table 33: Latin America Market Value (USD Mn) and Forecast by Region, 2017-2021 Table 34: Latin America Market Value (USD Mn) and Forecast by Region, 2022-2032 Table 35: Latin America Market Volume (Metric Tons) and Forecast by Region, 2017-2021 Table 36: Latin America Market Volume (Metric Tons) and Forecast by Region, 2022-2032 Table 37: Latin America Market Value (USD Mn) and Forecast by Source, 2017-2021 Table 38: Latin America Market Value (USD Mn) and Forecast by Source, 2022-2032 Table 39: Latin America Market Volume (Metric Tons) and Forecast by Source, 2017-2021 Table 40: Latin America Market Volume (Metric Tons) and Forecast by Source, 2022-2032 Table 41: Latin America Market Value (USD Mn) and Forecast by Livestock, 2017-2021 Table 42: Latin America Market Value (USD Mn) and Forecast by Livestock, 2022-2032 Table 43: Latin America Market Volume (Metric Tons) and Forecast by Livestock, 2017-2021 Table 44: Latin America Market Volume (Metric Tons) and Forecast by Livestock, 2022-2032 Table 45: Latin America Market Value (USD Mn) and Forecast by Product Type, 2017-2021 Table 46: Latin America Market Value (USD Mn) and Forecast by Product Type, 2022-2032 Table 47: Latin America Market Volume (Metric Tons) and Forecast by Product Type, 2017-2021 Table 48: Latin America Market Volume (Metric Tons) and Forecast by Product Type, 2022-2032 Table 49: Europe Market Value (USD Mn) and Forecast by Region, 2017-2021 Table 50: Europe Market Value (USD Mn) and Forecast by Region, 2022-2032 Table 51: Europe Market Volume (Metric Tons) and Forecast by Region, 2017-2021 Table 52: Europe Market Volume (Metric Tons) and Forecast by Region, 2022-2032 Table 53: Europe Market Value (USD Mn) and Forecast by Source, 2017-2021 Table 54: Europe Market Value (USD Mn) and Forecast by Source, 2022-2032 Table 55: Europe Market Volume (Metric Tons) and Forecast by Source, 2017-2021 Table 56: Europe Market Volume (Metric Tons) and Forecast by Source, 2022-2032 Table 57: Europe Market Value (USD Mn) and Forecast by Livestock, 2017-2021 Table 58: Europe Market Value (USD Mn) and Forecast by Livestock, 2022-2032 Table 59: Europe Market Volume (Metric Tons) and Forecast by Livestock, 2017-2021
Find your sweet spots for generating winning opportunities in this market.
Talk to AnalystList of Charts
Figure 1: Global Market Value (USD Mn) and Volume (MT) Forecast, 2022-2032 Figure 2: Global Market Absolute $ Opportunity (USD Mn), 2022-2032 Figure 3: Global Market Value (USD Mn) and % Growth by Region, 2022&2032 Figure 4: Global Market Y-o-Y Growth Rate by Region, 2022-2032 Figure 5: Global Market Value (USD Mn) and % Growth by Source, 2022&2032 Figure 6: Global Market Y-o-Y Growth Rate by Source, 2022-2032 Figure 7: Global Market Value (USD Mn) and % Growth by Livestock, 2022&2032 Figure 8: Global Market Y-o-Y Growth Rate by Livestock, 2022-2032 Figure 9: Global Market Value (USD Mn) and % Growth by Product Type, 2022&2032 Figure 10: Global Market Y-o-Y Growth Rate by Product Type, 2022-2032 Figure 11: Global Market Attractiveness Analysis by Region, 2022-2032 Figure 12: Global Market Attractiveness Analysis by Source, 2022-2032 Figure 13: Global Market Attractiveness Analysis by Livestock, 2022-2032 Figure 14: Global Market Attractiveness Analysis by Product Type, 2022-2032 Figure 15: North America Market Value (USD Mn) and Volume (MT) Forecast, 2022-2032 Figure 16: North America Market Absolute $ Opportunity (USD Mn), 2022-2032 Figure 17: North America Market Value (USD Mn) and % Growth by Region, 2022&2032 Figure 18: North America Market Y-o-Y Growth Rate by Region, 2022-2032 Figure 19: North America Market Value (USD Mn) and % Growth by Source, 2022&2032 Figure 20: North America Market Y-o-Y Growth Rate by Source, 2022-2032 Figure 21: North America Market Value (USD Mn) and % Growth by Livestock, 2022&2032 Figure 22: North America Market Y-o-Y Growth Rate by Livestock, 2022-2032 Figure 23: North America Market Value (USD Mn) and % Growth by Product Type, 2022&2032 Figure 24: North America Market Y-o-Y Growth Rate by Product Type, 2022-2032 Figure 25: North America Market Attractiveness Analysis by Region, 2022-2032 Figure 26: North America Market Attractiveness Analysis by Source, 2022-2032 Figure 27: North America Market Attractiveness Analysis by Livestock, 2022-2032 Figure 28: North America Market Attractiveness Analysis by Product Type, 2022-2032 Figure 29: Latin America Market Value (USD Mn) and Volume (MT) Forecast, 2022-2032 Figure 30: Latin America Market Absolute $ Opportunity (USD Mn), 2022-2032 Figure 31: Latin America Market Value (USD Mn) and % Growth by Region, 2022&2032 Figure 32: Latin America Market Y-o-Y Growth Rate by Region, 2022-2032 Figure 33: Latin America Market Value (USD Mn) and % Growth by Source, 2022&2032 Figure 34: Latin America Market Y-o-Y Growth Rate by Source, 2022-2032 Figure 35: Latin America Market Value (USD Mn) and % Growth by Livestock, 2022&2032 Figure 36: Latin America Market Y-o-Y Growth Rate by Livestock, 2022-2032 Figure 37: Latin America Market Value (USD Mn) and % Growth by Product Type, 2022&2032 Figure 38: Latin America Market Y-o-Y Growth Rate by Product Type, 2022-2032 Figure 39: Latin America Market Attractiveness Analysis by Region, 2022-2032 Figure 40: Latin America Market Attractiveness Analysis by Source, 2022-2032 Figure 41: Latin America Market Attractiveness Analysis by Livestock, 2022-2032 Figure 42: Latin America Market Attractiveness Analysis by Product Type, 2022-2032 Figure 43: Europe Market Value (USD Mn) and Volume (MT) Forecast, 2022-2032 Figure 44: Europe Market Absolute $ Opportunity (USD Mn), 2022-2032 Figure 45: Europe Market Value (USD Mn) and % Growth by Region, 2022&2032 Figure 46: Europe Market Y-o-Y Growth Rate by Region, 2022-2032 Figure 47: Europe Market Value (USD Mn) and % Growth by Source, 2022&2032 Figure 48: Europe Market Y-o-Y Growth Rate by Source, 2022-2032 Figure 49: Europe Market Value (USD Mn) and % Growth by Livestock, 2022&2032 Figure 50: Europe Market Y-o-Y Growth Rate by Livestock, 2022-2032 Figure 51: Europe Market Value (USD Mn) and % Growth by Product Type, 2022&2032 Figure 52: Europe Market Y-o-Y Growth Rate by Product Type, 2022-2032 Figure 53: Europe Market Attractiveness Analysis by Region, 2022-2032 Figure 54: Europe Market Attractiveness Analysis by Source, 2022-2032 Figure 55: Europe Market Attractiveness Analysis by Livestock, 2022-2032 Figure 56: Europe Market Attractiveness Analysis by Product Type, 2022-2032 Figure 57: East Asia Market Value (USD Mn) and Volume (MT) Forecast, 2022-2032 Figure 58: East Asia Market Absolute $ Opportunity (USD Mn), 2022-2032 Figure 59: East Asia Market Value (USD Mn) and % Growth by Region, 2022&2032 Figure 60: East Asia Market Y-o-Y Growth Rate by Region, 2022-2032 Figure 61: East Asia Market Value (USD Mn) and % Growth by Source, 2022&2032 Figure 62: East Asia Market Y-o-Y Growth Rate by Source, 2022-2032 Figure 63: East Asia Market Value (USD Mn) and % Growth by Livestock, 2022&2032 Figure 64: East Asia Market Y-o-Y Growth Rate by Livestock, 2022-2032 Figure 65: East Asia Market Value (USD Mn) and % Growth by Product Type, 2022&2032 Figure 66: East Asia Market Y-o-Y Growth Rate by Product Type, 2022-2032 Figure 67: East Asia Market Attractiveness Analysis by Region, 2022-2032 Figure 68: East Asia Market Attractiveness Analysis by Source, 2022-2032 Figure 69: East Asia Market Attractiveness Analysis by Livestock, 2022-2032 Figure 70: East Asia Market Attractiveness Analysis by Product Type, 2022-2032 Figure 71: South Asia Market Value (USD Mn) and Volume (MT) Forecast, 2022-2032 Figure 72: South Asia Market Absolute $ Opportunity (USD Mn), 2022-2032 Figure 73: South Asia Market Value (USD Mn) and % Growth by Region, 2022&2032 Figure 74: South Asia Market Y-o-Y Growth Rate by Region, 2022-2032 Figure 75: South Asia Market Value (USD Mn) and % Growth by Source, 2022&2032 Figure 76: South Asia Market Y-o-Y Growth Rate by Source, 2022-2032 Figure 77: South Asia Market Value (USD Mn) and % Growth by Livestock, 2022&2032 Figure 78: South Asia Market Y-o-Y Growth Rate by Livestock, 2022-2032 Figure 79: South Asia Market Value (USD Mn) and % Growth by Product Type, 2022&2032 Figure 80: South Asia Market Y-o-Y Growth Rate by Product Type, 2022-2032 Figure 81: South Asia Market Attractiveness Analysis by Region, 2022-2032 Figure 82: South Asia Market Attractiveness Analysis by Source, 2022-2032 Figure 83: South Asia Market Attractiveness Analysis by Livestock, 2022-2032 Figure 84: South Asia Market Attractiveness Analysis by Product Type, 2022-2032 Figure 85: Oceania Market Value (USD Mn) and Volume (MT) Forecast, 2022-2032 Figure 86: Oceania Market Absolute $ Opportunity (USD Mn), 2022-2032 Figure 87: Oceania Market Value (USD Mn) and % Growth by Region, 2022&2032 Figure 88: Oceania Market Y-o-Y Growth Rate by Region, 2022-2032 Figure 89: Oceania Market Value (USD Mn) and % Growth by Source, 2022&2032 Figure 90: Oceania Market Y-o-Y Growth Rate by Source, 2022-2032 Figure 91: Oceania Market Value (USD Mn) and % Growth by Livestock, 2022&2032 Figure 92: Oceania Market Y-o-Y Growth Rate by Livestock, 2022-2032 Figure 93: Oceania Market Value (USD Mn) and % Growth by Product Type, 2022&2032 Figure 94: Oceania Market Y-o-Y Growth Rate by Product Type, 2022-2032 Figure 95: Oceania Market Attractiveness Analysis by Region, 2022-2032 Figure 96: Oceania Market Attractiveness Analysis by Source, 2022-2032 Figure 97: Oceania Market Attractiveness Analysis by Livestock, 2022-2032 Figure 98: Oceania Market Attractiveness Analysis by Product Type, 2022-2032 Figure 99: Middle East & Africa Market Value (USD Mn) and Volume (MT) Forecast, 2022-2032 Figure 100: Middle East & Africa Market Absolute $ Opportunity (USD Mn), 2022-2032 Figure 101: Middle East & Africa Market Value (USD Mn) and % Growth by Region, 2022&2032 Figure 102: Middle East & Africa Market Y-o-Y Growth Rate by Region, 2022-2032 Figure 103: Middle East & Africa Market Value (USD Mn) and % Growth by Source, 2022&2032 Figure 104: Middle East & Africa Market Y-o-Y Growth Rate by Source, 2022-2032 Figure 105: Middle East & Africa Market Value (USD Mn) and % Growth by Livestock, 2022&2032 Figure 106: Middle East & Africa Market Y-o-Y Growth Rate by Livestock, 2022-2032 Figure 107: Middle East & Africa Market Value (USD Mn) and % Growth by Product Type, 2022&2032 Figure 108: Middle East & Africa Market Y-o-Y Growth Rate by Product Type, 2022-2032 Figure 109: Middle East & Africa Market Attractiveness Analysis by Region, 2022-2032 Figure 110: Middle East & Africa Market Attractiveness Analysis by Source, 2022-2032 Figure 111: Middle East & Africa Market Attractiveness Analysis by Livestock, 2022-2032 Figure 112: Middle East & Africa Market Attractiveness Analysis by Product Type, 2022-2032
Need specific information?
Request CustomizationExplore Food and Beverage Insights
View Reports