This site uses cookies, including third-party cookies, that help us to provide and improve our services.

Privacy Policy
- Global Locations -
Headquarters
Future Market Insights, Inc.
Christiana Corporate, 200 Continental Drive, Suite 401, Newark, Delaware - 19713, United States
T: +1-845-579-5705
MEA
Market Access DMCC

1602-6 Jumeirah Bay X2 Tower, Plot No: JLT-PH2-X2A,

Jumeirah Lakes Towers, Dubai,

United Arab Emirates

Americas
Future Market Insights
616 Corporate Way, Suite 2-9018,
Valley Cottage, NY 10989,
United States
T: +1-347-918-3531
Europe
Future Market Insights
3rd Floor, 207 Regent Street,
London W1B 3HH
United Kingdom
T: + 44 (0) 20 8123 9659
D: +44 (0) 20 3287 4268
APAC
Future Market Insights
Office No. 401-A, 4th Floor,
VANTAGE 9, S.No. 36/1/1,
Baner, Pune 411045 India

Feed Grade Oils Market

Feed Grade Oils Consumption rising amid growing energy requirements within Animal Feed Products

Feed Grade Oils Market by Application, Product Type & Region - Forecast 2022 – 2032

Feed Grade Oils Market Snapshot (2022-2032)

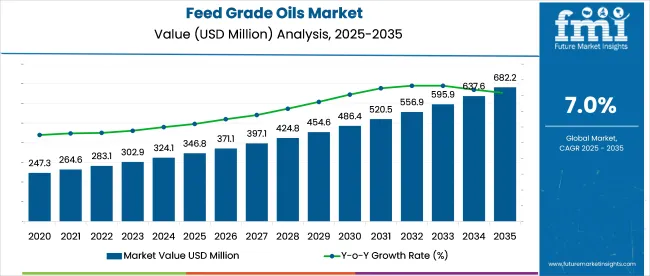
[300 Pages Report] The global feed grade oils market is expected to accumulate US$ 290 Million in value by 2022-end. During the forecast period ranging from 2022 to 2032, a CAGR worth 5.7% has been projected for the market, with an expected closing value worth US$ 554.7 Million. During the 2016-2021 historical period, the industry grew at a value CAGR worth 5.8%.

“Mounting popularity of energy levels in food in developed countries like United States & Germany and growing demand for maintenance of the animals' growth development boost the demand for feed grade oils.

Data Points

Key Statistics

Growth Rate (2016-2021)

5.8% CAGR

Projected Growth Rate (2022-2032)

6.7% CAGR

Expected Market Value (2022)

US$ 290.0 Million

Anticipated Forecast Value (2032)

US$ 554.7 Million

Feed grade oils can be formed from vegetable and animal oil blends. Feed grade oils were conventionally used primarily in swine and poultry diets. However, feed-grade oils have recently been used to significantly boost the content of ruminant diets in the form of starch.

Feed-grade oils aid in the maintenance of the animals' growth development. In recent years, there has been an upsurge in the use of oils in feed, which has prompted the use of acidulated soap stock, a common source of vegetable oils. Feed grade oils aid in reducing bloat and providing energy to the animals.

Besides this, when grain prices are high, feed grade oils are widely used because they are less expensive and represent an affordable solution for increasing the energy content in the animal diet while also boosting feed palatability. Depending on the requirements, feed grade oils go through various processing techniques such as neutralization reaction, absorbents such as bleaching earth are used to remove bleaching contaminants and pigments, and steam injection technique is used to remove deodorization of volatile components. As a result, feed grade oil can be obtained in a range of methods.

Customize this Report

Let us know your requirement to get
100% FREE customization

What are the Factors Propelling the Global Feed Grade Oils Market?

Feed grade oils are in high demand due to their cost effectiveness of energy and high nutritional content. Aside from its energy levels, feed grade oil aids in the masking of dust caused by the granular component of the feed. As a result, it helps to bind the feed particles together, reducing respiratory health issues in animals.

In the feed ration, approximately 1% of the feed grade oil is used. As a result, the feed grade oils market is gaining traction in the feed industry. Feed grade oils are also used as dispersing agents, which helps to reduce the incidence of the bloat by reducing dustiness in the feed.

Aside from the aforementioned applications, feed grade oils also strengthen animal palatability, improve animal health, and prevent machinery wear. As a result, the market for feed grade oils will witness improved growth prospects.

What are the Factors Hampering the Global Feed Grade Oils Market?

Although the feed grade oil market has numerous end-uses, there are numerous obstacles that likely pose a challenge to market growth. Feed grade oils are also susceptible to oxidation, which can result in rancidity. Rancidity has an unpleasant odor and affects the palatability of the feed. As a result, the energy and nutritional value of the feed may be affected. As a result, these influences may restrain the growth of the feed grade oils market.

The amount of feed grade oils added should be made with caution, as a huge portion may cause digestive upset and reduce the animal's feed intake due to an excess of oil in the ration.

Nandini Roy Choudhury
Principal Consultant
LinkedIn
Talk to Analyst

Find your sweet spots for generating winning opportunities in this market.

Talk to Analyst

Why is North America Emerging as an Opportunistic Feed Grade Oils Market?

North America holds the majority of the global feed grade oil market. The North American region includes the United States, Canada, and Mexico, and it is assumed to be a dominant market for feed grade oils during the forecast period due to its widespread use in livestock agronomic practices.

The global feed grade oil market is majorly driven by burgeoning meat consumption due to rising disposable income and population. Americans consumed a record 122.75 pounds of poultry per capita in 2017. Chicken consumption has risen by 540 percent since 1910, from around 10.1 pounds per capita in 1910 to 65.2 pounds in 2018.

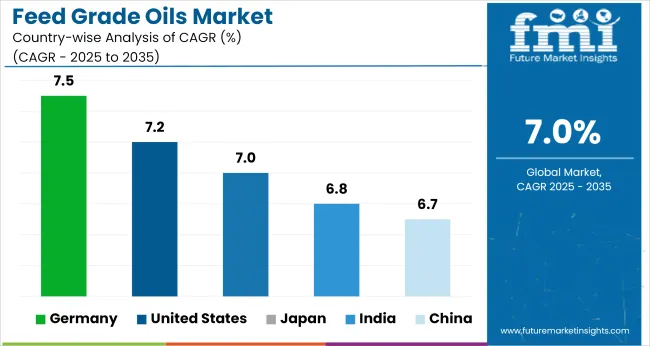
According to the recent Packaged Facts report Global Meat & Poultry Trends, consumption of meat in the United States is expected to rise by 1% per year through 2023. As per Future Market Insights, North America accounts for 23.4% of the feed grade oils market in 2022 and will continue to govern growth in the coming years.

Why is the Demand for Feed Grade Oils burgeoning in Europe?

Growing Use of Fish Oil and Palm Oil in Europe Drive the Growth of the Market

Europe accounts for a sizable portion of the feed grade oil market. Certain feed grade products, such as fish oil  and palm oil, make a significant contribution to the robust growth of the European feed grade oils market. The market for food-grade lubricants is expanding due to high demand from countries such as Germany, the United Kingdom, and France.

In Europe, sales of food and beverages increased by 10.5%, from EUR 110,271 million in 2018 to EUR 120,387 million in 2019, with the applicability of these feed grade oils attributed to increased nutritional content in food. This factor is spurring demand for feed grade oils. According to Future Market Insights, Europe is expected to hold 42.3% of the Feed Grade oils market in 2022 and will continue to lead the growth rate during the forecast.

The livestock agricultural sector is a significant land user in Europe, shaping rural landscapes. Feed grade oils are critical in assisting farmers in achieving the strategy's goal of further reducing antibiotic use and promoting one health cooperation in Europe. In light of the ongoing COVID-19 pandemic, the Health and Food Safety Commissioner emphasized the importance of strengthening the interconnections between human and animal health surveillance systems and agencies. These factors play significant roles in the expansion of the European Feed grade oils market.

MarketNage
Become a MarketNgage Insider

A unified Market Research Subscription Platform, built for today's disparate research needs.

Will the Asia Pacific emerge as an Attractive Feed Grade Oils Market?

Increasing Number of Poultry Farms in the Region to Provide Opportunity for The Growth of the Region

The Asia Pacific is anticipated to exhibit a significant growth rate in the feed grade oils market over the forecast period owing to the increasing demand for animal feed due to the increasing global population. Also, the rising awareness about the benefits of using feed grade oil in animal feed is anticipated to propel the market in these regions during the forecast period.

The Asia Pacific region is the largest market for the feed grade oil due to the rise in number of aquatic and poultry animal farm within the region. The rise in disposable income and increasing population size within the region are driving forces expected to fuel the growth of the global feed grade oil market over the foreseeable period.

How Start-ups Are Adding Value to the Global Feed Grade Oils Market?

The swelling dispersion of start-ups in the Feed Grade Oils market has upsurged the product quality and expanded global sales. Besides, to gain a competitive edge, new start-ups are working on novel developments and releasing innovative products such as:

  • Urja Feeds, founded in 2018, is a dependable and well-known Manufacturer of a wide range of Poultry Feed, Chicken Mbm, Chicken Tallow, and other products. It recently introduced Super Fat Feed Grade Poultry Oil.
  • Kanta Enterprises Private Limited is a private limited company that was founded on March 18, 2005. It recently released Food Grade 100 percent Pure Lemongrass Oil.

Market Competition

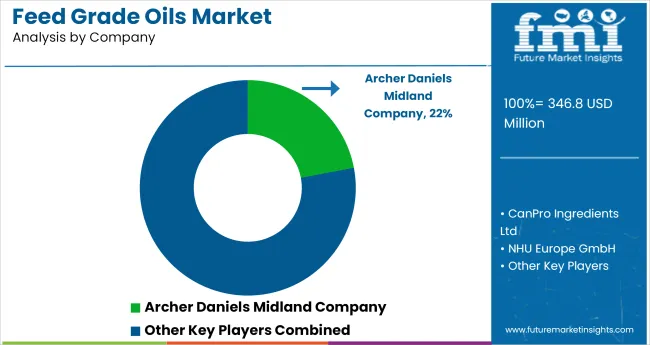
Some key players in the feed grade oils market are CanPro Ingredients Ltd, NHU Europe GmbH, Xiamen Kingdomway Group Company, Double S Liquid Feed Services, Inc., DAR PRO Ingredients, Renkert Oil, Inc., Archer Daniels Midland Company, Valley Proteins, Inc. Key development in the Feed Grade Oils market is as follows:

  • RenkertOil launched Renoil White Oils in April 2022. Renoil White Oils have a viscosity range of 60 to 500 SUS at 100° F and are a mixture of saturated paraffinic and naphthenic hydrocarbons.
  • Darling Ingredients, a global manufacturer of sustainable natural ingredients and specialty solutions, has entered into a definitive agreement to acquire 100% of Valley Proteins for approximately $1.1 billion in cash in January 2022.

Report Scope

Report Attribute

Details

Growth Rate

CAGR of 7.2% from 2022 to 2032

Market Value in 2022

US$ 558.6 Million

Market Value in 2032

US$ 1,119.6 Million

Base Year for Estimation

2021

Historical Period

2016-2021

Forecast Period

2022-2032

Quantitative Units

Revenue in US$ Million and CAGR from 2022-2032

Report Coverage

Revenue Forecast, Volume Forecast,

Company Ranking,

Competitive Landscape, Growth Factors, Trends, and

Pricing Analysis

Segments Covered

  • Application
  • Product Type
  • Region

Regions Covered

  • North America
  • Latin America
  • Europe
  • Asia Pacific
  • Middle East and Africa

Key Countries Profiled

  • U.S
  • Canada
  • Brazil
  • Mexico
  • Germany
  • U.K
  • France
  • Spain
  • Italy
  • China
  • Japan
  • South Korea
  • Malaysia
  • Singapore
  • Australia
  • New Zealand
  • GCC
  • South Africa
  • Israel

Key Companies Profiled

  • CanPro Ingredients Ltd
  • NHU Europe GmbH
  • Xiamen Kingdomway Group Company
  • Double S Liquid Feed Services, Inc.
  • DAR PRO Ingredients
  • Renkert Oil, Inc.
  • Archer Daniels Midland Company
  • Valley Proteins, Inc.

Customization

Available upon Request

Key Segments Covered in the Feed Grade Oils Industry Survey

Feed Grade Oils Market by Application:

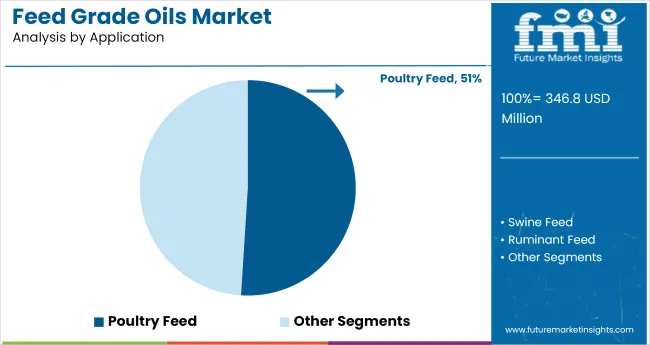
  • Poultry Feed Grade Oils
  • Swine Feed Grade Oils
  • Ruminants Feed Grade Oils

Feed Grade Oils Market by Product Type:

  • Feed Grade Oils containing Vitamin D
  • Feed Grade Oils containing Vitamin E
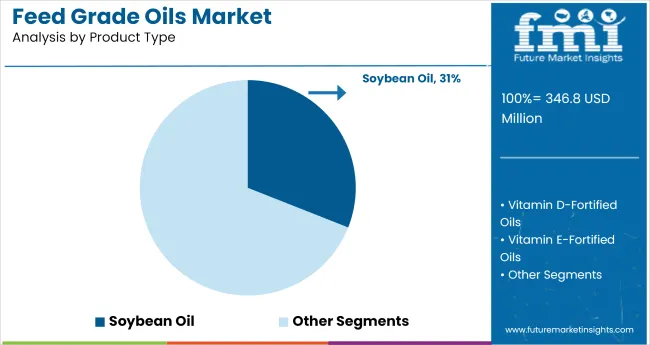
  • Feed Grade Oils containing Soybean
  • Feed Grade Oils containing Palm Oil
  • Feed Grade Oils containing Canola Oil
  • Feed Grade Oils containing Fish Oil
  • Feed Grade Oils containing Other Products

Feed Grade Oils Market by Region:

  • North America Feed Grade Oils Market
  • Latin America Feed Grade Oils Market
  • Europe Feed Grade Oils Market
  • Asia Pacific Feed Grade Oils Market
  • Middle East & Africa Feed Grade Oils Market

Frequently Asked Questions

FMI projects the global feed grade oils market to expand at a 6.7% value CAGR by 2032.

North America is expected to be the most opportunistic with a 34.5% share of the total feed grade oils market.

CanPro Ingredients Ltd, NHU Europe GmbH, Xiamen Kingdomway Group Company are some prominent feed grade oils market manufacturers.

Table of Content

1. Executive Summary

    1.1. Global Market Outlook

    1.2. Demand-side Trends

    1.3. Supply-side Trends

    1.4. Technology Roadmap Analysis

    1.5. Analysis and Recommendations

2. Market Overview

    2.1. Market Coverage / Taxonomy

    2.2. Market Definition / Scope / Limitations

3. Market Background

    3.1. Market Dynamics

        3.1.1. Drivers

        3.1.2. Restraints

        3.1.3. Opportunity

        3.1.4. Trends

    3.2. Scenario Forecast

        3.2.1. Demand in Optimistic Scenario

        3.2.2. Demand in Likely Scenario

        3.2.3. Demand in Conservative Scenario

    3.3. Opportunity Map Analysis

    3.4. Product Life Cycle Analysis

    3.5. Supply Chain Analysis

        3.5.1. Supply Side Participants and their Roles

            3.5.1.1. Producers

            3.5.1.2. Mid-Level Participants (Traders/ Agents/ Brokers)

            3.5.1.3. Wholesalers and Distributors

        3.5.2. Value Added and Value Created at Node in the Supply Chain

        3.5.3. List of Raw Material Suppliers

        3.5.4. List of Existing and Potential Buyer’s

    3.6. Investment Feasibility Matrix

    3.7. Value Chain Analysis

        3.7.1. Profit Margin Analysis

        3.7.2. Wholesalers and Distributors

        3.7.3. Retailers

    3.8. PESTLE and Porter’s Analysis

    3.9. Regulatory Landscape

        3.9.1. By Key Regions

        3.9.2. By Key Countries

    3.10. Regional Parent Market Outlook

    3.11. Production and Consumption Statistics

    3.12. Import and Export Statistics

4. Global Feed Grade Oils Market Analysis 2016-2021 and Forecast, 2022-2032

    4.1. Historical Market Size Value (US$ Mn) & Volume (Tons) Analysis, 2016-2021

    4.2. Current and Future Market Size Value (US$ Mn) & Volume (Tons) Projections, 2022-2032

        4.2.1. Y-o-Y Growth Trend Analysis

        4.2.2. Absolute $ Opportunity Analysis

5. Global Feed Grade Oils Market Analysis 2016-2021 and Forecast 2022-2032, By Application

    5.1. Introduction / Key Findings

    5.2. Historical Market Size Value (US$ Mn) & Volume (Tons) Analysis By Application, 2016-2021

    5.3. Current and Future Market Size Value (US$ Mn) & Volume (Tons) Analysis and Forecast By Application, 2022-2032

        5.3.1. Poultry

        5.3.2. Swine

        5.3.3. Ruminants

    5.4. Y-o-Y Growth Trend Analysis By Application, 2016-2021

    5.5. Absolute $ Opportunity Analysis By Application, 2022-2032

6. Global Feed Grade Oils Market Analysis 2016-2021 and Forecast 2022-2032, By Product types

    6.1. Introduction / Key Findings

    6.2. Historical Market Size Value (US$ Mn) & Volume (Tons) Analysis By Product types, 2016-2021

    6.3. Current and Future Market Size Value (US$ Mn) & Volume (Tons) Analysis and Forecast By Product types, 2022-2032

        6.3.1. Vitamin D

        6.3.2. Vitamin E

        6.3.3. Soybean

        6.3.4. Palm Oil

        6.3.5. Canola Oil

        6.3.6. Fish Oil

    6.4. Y-o-Y Growth Trend Analysis By Product types, 2016-2021

    6.5. Absolute $ Opportunity Analysis By Product types, 2022-2032

7. Global Feed Grade Oils Market Analysis 2016-2021 and Forecast 2022-2032, By Region

    7.1. Introduction

    7.2. Historical Market Size Value (US$ Mn) & Volume (Tons) Analysis By Region, 2016-2021

    7.3. Current Market Size Value (US$ Mn) & Volume (Tons) Analysis and Forecast By Region, 2022-2032

        7.3.1. North America

        7.3.2. Latin America

        7.3.3. Europe

        7.3.4. Asia Pacific

        7.3.5. MEA

    7.4. Market Attractiveness Analysis By Region

8. North America Feed Grade Oils Market Analysis 2016-2021 and Forecast 2022-2032, By Country

    8.1. Historical Market Size Value (US$ Mn) & Volume (Tons) Trend Analysis By Market Taxonomy, 2016-2021

    8.2. Market Size Value (US$ Mn) & Volume (Tons) Forecast By Market Taxonomy, 2022-2032

        8.2.1. By Country

            8.2.1.1. U.S.

            8.2.1.2. Canada

        8.2.2. By Application

        8.2.3. By Product types

    8.3. Market Attractiveness Analysis

        8.3.1. By Country

        8.3.2. By Application

        8.3.3. By Product types

    8.4. Key Takeaways

9. Latin America Feed Grade Oils Market Analysis 2016-2021 and Forecast 2022-2032, By Country

    9.1. Historical Market Size Value (US$ Mn) & Volume (Tons) Trend Analysis By Market Taxonomy, 2016-2021

    9.2. Market Size Value (US$ Mn) & Volume (Tons) Forecast By Market Taxonomy, 2022-2032

        9.2.1. By Country

            9.2.1.1. Brazil

            9.2.1.2. Mexico

            9.2.1.3. Rest of Latin America

        9.2.2. By Application

        9.2.3. By Product types

    9.3. Market Attractiveness Analysis

        9.3.1. By Country

        9.3.2. By Application

        9.3.3. By Product types

    9.4. Key Takeaways

10. Europe Feed Grade Oils Market Analysis 2016-2021 and Forecast 2022-2032, By Country

    10.1. Historical Market Size Value (US$ Mn) & Volume (Tons) Trend Analysis By Market Taxonomy, 2016-2021

    10.2. Market Size Value (US$ Mn) & Volume (Tons) Forecast By Market Taxonomy, 2022-2032

        10.2.1. By Country

            10.2.1.1. Germany

            10.2.1.2. U.K.

            10.2.1.3. France

            10.2.1.4. Spain

            10.2.1.5. Italy

            10.2.1.6. Rest of Europe

        10.2.2. By Application

        10.2.3. By Product types

    10.3. Market Attractiveness Analysis

        10.3.1. By Country

        10.3.2. By Application

        10.3.3. By Product types

    10.4. Key Takeaways

11. Asia Pacific Feed Grade Oils Market Analysis 2016-2021 and Forecast 2022-2032, By Country

    11.1. Historical Market Size Value (US$ Mn) & Volume (Tons) Trend Analysis By Market Taxonomy, 2016-2021

    11.2. Market Size Value (US$ Mn) & Volume (Tons) Forecast By Market Taxonomy, 2022-2032

        11.2.1. By Country

            11.2.1.1. China

            11.2.1.2. Japan

            11.2.1.3. South Korea

            11.2.1.4. Malaysia

            11.2.1.5. Singapore

            11.2.1.6. Australia

            11.2.1.7. New Zealand

            11.2.1.8. Rest of APAC

        11.2.2. By Application

        11.2.3. By Product types

    11.3. Market Attractiveness Analysis

        11.3.1. By Country

        11.3.2. By Application

        11.3.3. By Product types

    11.4. Key Takeaways

12. MEA Feed Grade Oils Market Analysis 2016-2021 and Forecast 2022-2032, By Country

    12.1. Historical Market Size Value (US$ Mn) & Volume (Tons) Trend Analysis By Market Taxonomy, 2016-2021

    12.2. Market Size Value (US$ Mn) & Volume (Tons) Forecast By Market Taxonomy, 2022-2032

        12.2.1. By Country

            12.2.1.1. GCC Countries

            12.2.1.2. South Africa

            12.2.1.3. Israel

            12.2.1.4. Rest of MEA

        12.2.2. By Application

        12.2.3. By Product types

    12.3. Market Attractiveness Analysis

        12.3.1. By Country

        12.3.2. By Application

        12.3.3. By Product types

    12.4. Key Takeaways

13. Key Countries Feed Grade Oils Market Analysis

    13.1. U.S.

        13.1.1. Pricing Analysis

        13.1.2. Market Share Analysis, 2021

            13.1.2.1. By Application

            13.1.2.2. By Product types

    13.2. Canada

        13.2.1. Pricing Analysis

        13.2.2. Market Share Analysis, 2021

            13.2.2.1. By Application

            13.2.2.2. By Product types

    13.3. Brazil

        13.3.1. Pricing Analysis

        13.3.2. Market Share Analysis, 2021

            13.3.2.1. By Application

            13.3.2.2. By Product types

    13.4. Mexico

        13.4.1. Pricing Analysis

        13.4.2. Market Share Analysis, 2021

            13.4.2.1. By Application

            13.4.2.2. By Product types

    13.5. Germany

        13.5.1. Pricing Analysis

        13.5.2. Market Share Analysis, 2021

            13.5.2.1. By Application

            13.5.2.2. By Product types

    13.6. U.K.

        13.6.1. Pricing Analysis

        13.6.2. Market Share Analysis, 2021

            13.6.2.1. By Application

            13.6.2.2. By Product types

    13.7. France

        13.7.1. Pricing Analysis

        13.7.2. Market Share Analysis, 2021

            13.7.2.1. By Application

            13.7.2.2. By Product types

    13.8. Spain

        13.8.1. Pricing Analysis

        13.8.2. Market Share Analysis, 2021

            13.8.2.1. By Application

            13.8.2.2. By Product types

    13.9. Italy

        13.9.1. Pricing Analysis

        13.9.2. Market Share Analysis, 2021

            13.9.2.1. By Application

            13.9.2.2. By Product types

    13.10. China

        13.10.1. Pricing Analysis

        13.10.2. Market Share Analysis, 2021

            13.10.2.1. By Application

            13.10.2.2. By Product types

    13.11. Japan

        13.11.1. Pricing Analysis

        13.11.2. Market Share Analysis, 2021

            13.11.2.1. By Application

            13.11.2.2. By Product types

    13.12. South Korea

        13.12.1. Pricing Analysis

        13.12.2. Market Share Analysis, 2021

            13.12.2.1. By Application

            13.12.2.2. By Product types

    13.13. Malaysia

        13.13.1. Pricing Analysis

        13.13.2. Market Share Analysis, 2021

            13.13.2.1. By Application

            13.13.2.2. By Product types

    13.14. Singapore

        13.14.1. Pricing Analysis

        13.14.2. Market Share Analysis, 2021

            13.14.2.1. By Application

            13.14.2.2. By Product types

    13.15. Australia

        13.15.1. Pricing Analysis

        13.15.2. Market Share Analysis, 2021

            13.15.2.1. By Application

            13.15.2.2. By Product types

    13.16. New Zealand

        13.16.1. Pricing Analysis

        13.16.2. Market Share Analysis, 2021

            13.16.2.1. By Application

            13.16.2.2. By Product types

    13.17. GCC Countries

        13.17.1. Pricing Analysis

        13.17.2. Market Share Analysis, 2021

            13.17.2.1. By Application

            13.17.2.2. By Product types

    13.18. South Africa

        13.18.1. Pricing Analysis

        13.18.2. Market Share Analysis, 2021

            13.18.2.1. By Application

            13.18.2.2. By Product types

    13.19. Israel

        13.19.1. Pricing Analysis

        13.19.2. Market Share Analysis, 2021

            13.19.2.1. By Application

            13.19.2.2. By Product types

14. Market Structure Analysis

    14.1. Competition Dashboard

    14.2. Competition Benchmarking

    14.3. Market Share Analysis of Top Players

        14.3.1. By Regional

        14.3.2. By Application

        14.3.3. By Product types

15. Competition Analysis

    15.1. Competition Deep Dive

        15.1.1. CanPro Ingredients Ltd

            15.1.1.1. Overview

            15.1.1.2. Product Portfolio

            15.1.1.3. Profitability by Market Segments

            15.1.1.4. Sales Footprint

            15.1.1.5. Strategy Overview

                15.1.1.5.1. Marketing Strategy

                15.1.1.5.2. Product Strategy

                15.1.1.5.3. Channel Strategy

        15.1.2. NHU Europe GmbH

            15.1.2.1. Overview

            15.1.2.2. Product Portfolio

            15.1.2.3. Profitability by Market Segments

            15.1.2.4. Sales Footprint

            15.1.2.5. Strategy Overview

                15.1.2.5.1. Marketing Strategy

                15.1.2.5.2. Product Strategy

                15.1.2.5.3. Channel Strategy

        15.1.3. Xiamen Kingdomway Group Company

            15.1.3.1. Overview

            15.1.3.2. Product Portfolio

            15.1.3.3. Profitability by Market Segments

            15.1.3.4. Sales Footprint

            15.1.3.5. Strategy Overview

                15.1.3.5.1. Marketing Strategy

                15.1.3.5.2. Product Strategy

                15.1.3.5.3. Channel Strategy

        15.1.4. Double S Liquid Feed Services, Inc.

            15.1.4.1. Overview

            15.1.4.2. Product Portfolio

            15.1.4.3. Profitability by Market Segments

            15.1.4.4. Sales Footprint

            15.1.4.5. Strategy Overview

                15.1.4.5.1. Marketing Strategy

                15.1.4.5.2. Product Strategy

                15.1.4.5.3. Channel Strategy

        15.1.5. DAR PRO Ingredients

            15.1.5.1. Overview

            15.1.5.2. Product Portfolio

            15.1.5.3. Profitability by Market Segments

            15.1.5.4. Sales Footprint

            15.1.5.5. Strategy Overview

                15.1.5.5.1. Marketing Strategy

                15.1.5.5.2. Product Strategy

                15.1.5.5.3. Channel Strategy

        15.1.6. Renkert Oil, Inc.

            15.1.6.1. Overview

            15.1.6.2. Product Portfolio

            15.1.6.3. Profitability by Market Segments

            15.1.6.4. Sales Footprint

            15.1.6.5. Strategy Overview

                15.1.6.5.1. Marketing Strategy

                15.1.6.5.2. Product Strategy

                15.1.6.5.3. Channel Strategy

        15.1.7. Archer Daniels Midland Company

            15.1.7.1. Overview

            15.1.7.2. Product Portfolio

            15.1.7.3. Profitability by Market Segments

            15.1.7.4. Sales Footprint

            15.1.7.5. Strategy Overview

                15.1.7.5.1. Marketing Strategy

                15.1.7.5.2. Product Strategy

                15.1.7.5.3. Channel Strategy

        15.1.8. Valley Proteins, Inc.

            15.1.8.1. Overview

            15.1.8.2. Product Portfolio

            15.1.8.3. Profitability by Market Segments

            15.1.8.4. Sales Footprint

            15.1.8.5. Strategy Overview

                15.1.8.5.1. Marketing Strategy

                15.1.8.5.2. Product Strategy

                15.1.8.5.3. Channel Strategy

16. Assumptions & Acronyms Used

17. Research Methodolog
Customize this Report

Let us know your requirement to get
100% FREE customization

List of Tables

Table 1: Global Feed Grade Oils Market Value (US$ Mn) Forecast by Region, 2016-2032

Table 2: Global Feed Grade Oils Market Volume (Tons) Forecast by Region, 2016-2032

Table 3: Global Feed Grade Oils Market Value (US$ Mn) Forecast by Application, 2016-2032

Table 4: Global Feed Grade Oils Market Volume (Tons) Forecast by Application, 2016-2032

Table 5: Global Feed Grade Oils Market Value (US$ Mn) Forecast by Product types, 2016-2032

Table 6: Global Feed Grade Oils Market Volume (Tons) Forecast by Product types, 2016-2032

Table 7: North America Feed Grade Oils Market Value (US$ Mn) Forecast by Country, 2016-2032

Table 8: North America Feed Grade Oils Market Volume (Tons) Forecast by Country, 2016-2032

Table 9: North America Feed Grade Oils Market Value (US$ Mn) Forecast by Application, 2016-2032

Table 10: North America Feed Grade Oils Market Volume (Tons) Forecast by Application, 2016-2032

Table 11: North America Feed Grade Oils Market Value (US$ Mn) Forecast by Product types, 2016-2032

Table 12: North America Feed Grade Oils Market Volume (Tons) Forecast by Product types, 2016-2032

Table 13: Latin America Feed Grade Oils Market Value (US$ Mn) Forecast by Country, 2016-2032

Table 14: Latin America Feed Grade Oils Market Volume (Tons) Forecast by Country, 2016-2032

Table 15: Latin America Feed Grade Oils Market Value (US$ Mn) Forecast by Application, 2016-2032

Table 16: Latin America Feed Grade Oils Market Volume (Tons) Forecast by Application, 2016-2032

Table 17: Latin America Feed Grade Oils Market Value (US$ Mn) Forecast by Product types, 2016-2032

Table 18: Latin America Feed Grade Oils Market Volume (Tons) Forecast by Product types, 2016-2032

Table 19: Europe Feed Grade Oils Market Value (US$ Mn) Forecast by Country, 2016-2032

Table 20: Europe Feed Grade Oils Market Volume (Tons) Forecast by Country, 2016-2032

Table 21: Europe Feed Grade Oils Market Value (US$ Mn) Forecast by Application, 2016-2032

Table 22: Europe Feed Grade Oils Market Volume (Tons) Forecast by Application, 2016-2032

Table 23: Europe Feed Grade Oils Market Value (US$ Mn) Forecast by Product types, 2016-2032

Table 24: Europe Feed Grade Oils Market Volume (Tons) Forecast by Product types, 2016-2032

Table 25: Asia Pacific Feed Grade Oils Market Value (US$ Mn) Forecast by Country, 2016-2032

Table 26: Asia Pacific Feed Grade Oils Market Volume (Tons) Forecast by Country, 2016-2032

Table 27: Asia Pacific Feed Grade Oils Market Value (US$ Mn) Forecast by Application, 2016-2032

Table 28: Asia Pacific Feed Grade Oils Market Volume (Tons) Forecast by Application, 2016-2032

Table 29: Asia Pacific Feed Grade Oils Market Value (US$ Mn) Forecast by Product types, 2016-2032

Table 30: Asia Pacific Feed Grade Oils Market Volume (Tons) Forecast by Product types, 2016-2032

Table 31: MEA Feed Grade Oils Market Value (US$ Mn) Forecast by Country, 2016-2032

Table 32: MEA Feed Grade Oils Market Volume (Tons) Forecast by Country, 2016-2032

Table 33: MEA Feed Grade Oils Market Value (US$ Mn) Forecast by Application, 2016-2032

Table 34: MEA Feed Grade Oils Market Volume (Tons) Forecast by Application, 2016-2032

Table 35: MEA Feed Grade Oils Market Value (US$ Mn) Forecast by Product types, 2016-2032

Table 36: MEA Feed Grade Oils Market Volume (Tons) Forecast by Product types, 2016-2032
Nandini Roy Choudhury
Principal Consultant
LinkedIn
Talk to Analyst

Find your sweet spots for generating winning opportunities in this market.

Talk to Analyst

List of Charts

Figure 1: Global Feed Grade Oils Market Value (US$ Mn) by Application, 2022-2032

Figure 2: Global Feed Grade Oils Market Value (US$ Mn) by Product types, 2022-2032

Figure 3: Global Feed Grade Oils Market Value (US$ Mn) by Region, 2022-2032

Figure 4: Global Feed Grade Oils Market Value (US$ Mn) Analysis by Region, 2016-2032

Figure 5: Global Feed Grade Oils Market Volume (Tons) Analysis by Region, 2016-2032

Figure 6: Global Feed Grade Oils Market Value Share (%) and BPS Analysis by Region, 2022-2032

Figure 7: Global Feed Grade Oils Market Y-o-Y Growth (%) Projections by Region, 2022-2032

Figure 8: Global Feed Grade Oils Market Value (US$ Mn) Analysis by Application, 2016-2032

Figure 9: Global Feed Grade Oils Market Volume (Tons) Analysis by Application, 2016-2032

Figure 10: Global Feed Grade Oils Market Value Share (%) and BPS Analysis by Application, 2022-2032

Figure 11: Global Feed Grade Oils Market Y-o-Y Growth (%) Projections by Application, 2022-2032

Figure 12: Global Feed Grade Oils Market Value (US$ Mn) Analysis by Product types, 2016-2032

Figure 13: Global Feed Grade Oils Market Volume (Tons) Analysis by Product types, 2016-2032

Figure 14: Global Feed Grade Oils Market Value Share (%) and BPS Analysis by Product types, 2022-2032

Figure 15: Global Feed Grade Oils Market Y-o-Y Growth (%) Projections by Product types, 2022-2032

Figure 16: Global Feed Grade Oils Market Attractiveness by Application, 2022-2032

Figure 17: Global Feed Grade Oils Market Attractiveness by Product types, 2022-2032

Figure 18: Global Feed Grade Oils Market Attractiveness by Region, 2022-2032

Figure 19: North America Feed Grade Oils Market Value (US$ Mn) by Application, 2022-2032

Figure 20: North America Feed Grade Oils Market Value (US$ Mn) by Product types, 2022-2032

Figure 21: North America Feed Grade Oils Market Value (US$ Mn) by Country, 2022-2032

Figure 22: North America Feed Grade Oils Market Value (US$ Mn) Analysis by Country, 2016-2032

Figure 23: North America Feed Grade Oils Market Volume (Tons) Analysis by Country, 2016-2032

Figure 24: North America Feed Grade Oils Market Value Share (%) and BPS Analysis by Country, 2022-2032

Figure 25: North America Feed Grade Oils Market Y-o-Y Growth (%) Projections by Country, 2022-2032

Figure 26: North America Feed Grade Oils Market Value (US$ Mn) Analysis by Application, 2016-2032

Figure 27: North America Feed Grade Oils Market Volume (Tons) Analysis by Application, 2016-2032

Figure 28: North America Feed Grade Oils Market Value Share (%) and BPS Analysis by Application, 2022-2032

Figure 29: North America Feed Grade Oils Market Y-o-Y Growth (%) Projections by Application, 2022-2032

Figure 30: North America Feed Grade Oils Market Value (US$ Mn) Analysis by Product types, 2016-2032

Figure 31: North America Feed Grade Oils Market Volume (Tons) Analysis by Product types, 2016-2032

Figure 32: North America Feed Grade Oils Market Value Share (%) and BPS Analysis by Product types, 2022-2032

Figure 33: North America Feed Grade Oils Market Y-o-Y Growth (%) Projections by Product types, 2022-2032

Figure 34: North America Feed Grade Oils Market Attractiveness by Application, 2022-2032

Figure 35: North America Feed Grade Oils Market Attractiveness by Product types, 2022-2032

Figure 36: North America Feed Grade Oils Market Attractiveness by Country, 2022-2032

Figure 37: Latin America Feed Grade Oils Market Value (US$ Mn) by Application, 2022-2032

Figure 38: Latin America Feed Grade Oils Market Value (US$ Mn) by Product types, 2022-2032

Figure 39: Latin America Feed Grade Oils Market Value (US$ Mn) by Country, 2022-2032

Figure 40: Latin America Feed Grade Oils Market Value (US$ Mn) Analysis by Country, 2016-2032

Figure 41: Latin America Feed Grade Oils Market Volume (Tons) Analysis by Country, 2016-2032

Figure 42: Latin America Feed Grade Oils Market Value Share (%) and BPS Analysis by Country, 2022-2032

Figure 43: Latin America Feed Grade Oils Market Y-o-Y Growth (%) Projections by Country, 2022-2032

Figure 44: Latin America Feed Grade Oils Market Value (US$ Mn) Analysis by Application, 2016-2032

Figure 45: Latin America Feed Grade Oils Market Volume (Tons) Analysis by Application, 2016-2032

Figure 46: Latin America Feed Grade Oils Market Value Share (%) and BPS Analysis by Application, 2022-2032

Figure 47: Latin America Feed Grade Oils Market Y-o-Y Growth (%) Projections by Application, 2022-2032

Figure 48: Latin America Feed Grade Oils Market Value (US$ Mn) Analysis by Product types, 2016-2032

Figure 49: Latin America Feed Grade Oils Market Volume (Tons) Analysis by Product types, 2016-2032

Figure 50: Latin America Feed Grade Oils Market Value Share (%) and BPS Analysis by Product types, 2022-2032

Figure 51: Latin America Feed Grade Oils Market Y-o-Y Growth (%) Projections by Product types, 2022-2032

Figure 52: Latin America Feed Grade Oils Market Attractiveness by Application, 2022-2032

Figure 53: Latin America Feed Grade Oils Market Attractiveness by Product types, 2022-2032

Figure 54: Latin America Feed Grade Oils Market Attractiveness by Country, 2022-2032

Figure 55: Europe Feed Grade Oils Market Value (US$ Mn) by Application, 2022-2032

Figure 56: Europe Feed Grade Oils Market Value (US$ Mn) by Product types, 2022-2032

Figure 57: Europe Feed Grade Oils Market Value (US$ Mn) by Country, 2022-2032

Figure 58: Europe Feed Grade Oils Market Value (US$ Mn) Analysis by Country, 2016-2032

Figure 59: Europe Feed Grade Oils Market Volume (Tons) Analysis by Country, 2016-2032

Figure 60: Europe Feed Grade Oils Market Value Share (%) and BPS Analysis by Country, 2022-2032

Figure 61: Europe Feed Grade Oils Market Y-o-Y Growth (%) Projections by Country, 2022-2032

Figure 62: Europe Feed Grade Oils Market Value (US$ Mn) Analysis by Application, 2016-2032

Figure 63: Europe Feed Grade Oils Market Volume (Tons) Analysis by Application, 2016-2032

Figure 64: Europe Feed Grade Oils Market Value Share (%) and BPS Analysis by Application, 2022-2032

Figure 65: Europe Feed Grade Oils Market Y-o-Y Growth (%) Projections by Application, 2022-2032

Figure 66: Europe Feed Grade Oils Market Value (US$ Mn) Analysis by Product types, 2016-2032

Figure 67: Europe Feed Grade Oils Market Volume (Tons) Analysis by Product types, 2016-2032

Figure 68: Europe Feed Grade Oils Market Value Share (%) and BPS Analysis by Product types, 2022-2032

Figure 69: Europe Feed Grade Oils Market Y-o-Y Growth (%) Projections by Product types, 2022-2032

Figure 70: Europe Feed Grade Oils Market Attractiveness by Application, 2022-2032

Figure 71: Europe Feed Grade Oils Market Attractiveness by Product types, 2022-2032

Figure 72: Europe Feed Grade Oils Market Attractiveness by Country, 2022-2032

Figure 73: Asia Pacific Feed Grade Oils Market Value (US$ Mn) by Application, 2022-2032

Figure 74: Asia Pacific Feed Grade Oils Market Value (US$ Mn) by Product types, 2022-2032

Figure 75: Asia Pacific Feed Grade Oils Market Value (US$ Mn) by Country, 2022-2032

Figure 76: Asia Pacific Feed Grade Oils Market Value (US$ Mn) Analysis by Country, 2016-2032

Figure 77: Asia Pacific Feed Grade Oils Market Volume (Tons) Analysis by Country, 2016-2032

Figure 78: Asia Pacific Feed Grade Oils Market Value Share (%) and BPS Analysis by Country, 2022-2032

Figure 79: Asia Pacific Feed Grade Oils Market Y-o-Y Growth (%) Projections by Country, 2022-2032

Figure 80: Asia Pacific Feed Grade Oils Market Value (US$ Mn) Analysis by Application, 2016-2032

Figure 81: Asia Pacific Feed Grade Oils Market Volume (Tons) Analysis by Application, 2016-2032

Figure 82: Asia Pacific Feed Grade Oils Market Value Share (%) and BPS Analysis by Application, 2022-2032

Figure 83: Asia Pacific Feed Grade Oils Market Y-o-Y Growth (%) Projections by Application, 2022-2032

Figure 84: Asia Pacific Feed Grade Oils Market Value (US$ Mn) Analysis by Product types, 2016-2032

Figure 85: Asia Pacific Feed Grade Oils Market Volume (Tons) Analysis by Product types, 2016-2032

Figure 86: Asia Pacific Feed Grade Oils Market Value Share (%) and BPS Analysis by Product types, 2022-2032

Figure 87: Asia Pacific Feed Grade Oils Market Y-o-Y Growth (%) Projections by Product types, 2022-2032

Figure 88: Asia Pacific Feed Grade Oils Market Attractiveness by Application, 2022-2032

Figure 89: Asia Pacific Feed Grade Oils Market Attractiveness by Product types, 2022-2032

Figure 90: Asia Pacific Feed Grade Oils Market Attractiveness by Country, 2022-2032

Figure 91: MEA Feed Grade Oils Market Value (US$ Mn) by Application, 2022-2032

Figure 92: MEA Feed Grade Oils Market Value (US$ Mn) by Product types, 2022-2032

Figure 93: MEA Feed Grade Oils Market Value (US$ Mn) by Country, 2022-2032

Figure 94: MEA Feed Grade Oils Market Value (US$ Mn) Analysis by Country, 2016-2032

Figure 95: MEA Feed Grade Oils Market Volume (Tons) Analysis by Country, 2016-2032

Figure 96: MEA Feed Grade Oils Market Value Share (%) and BPS Analysis by Country, 2022-2032

Figure 97: MEA Feed Grade Oils Market Y-o-Y Growth (%) Projections by Country, 2022-2032

Figure 98: MEA Feed Grade Oils Market Value (US$ Mn) Analysis by Application, 2016-2032

Figure 99: MEA Feed Grade Oils Market Volume (Tons) Analysis by Application, 2016-2032

Figure 100: MEA Feed Grade Oils Market Value Share (%) and BPS Analysis by Application, 2022-2032

Figure 101: MEA Feed Grade Oils Market Y-o-Y Growth (%) Projections by Application, 2022-2032

Figure 102: MEA Feed Grade Oils Market Value (US$ Mn) Analysis by Product types, 2016-2032

Figure 103: MEA Feed Grade Oils Market Volume (Tons) Analysis by Product types, 2016-2032

Figure 104: MEA Feed Grade Oils Market Value Share (%) and BPS Analysis by Product types, 2022-2032

Figure 105: MEA Feed Grade Oils Market Y-o-Y Growth (%) Projections by Product types, 2022-2032

Figure 106: MEA Feed Grade Oils Market Attractiveness by Application, 2022-2032

Figure 107: MEA Feed Grade Oils Market Attractiveness by Product types, 2022-2032

Figure 108: MEA Feed Grade Oils Market Attractiveness by Country, 2022-2032

Need specific information?

Request Customization

Explore Food and Beverage Insights

View Reports

Recommendations

Food and Beverage

Food Grade Paraffin Market

Published : December 2020

Food and Beverage

Food Grade Nylon Market

Published : December 2020

Food and Beverage

Food Grade Activated Carbon Market

Published : November 2020

Food and Beverage

Food Grade Antifoams Market

Published : June 2020

Google translate

Feed Grade Oils Market