Feed Acidifier Market Forecast and Outlook 2025 to 2035

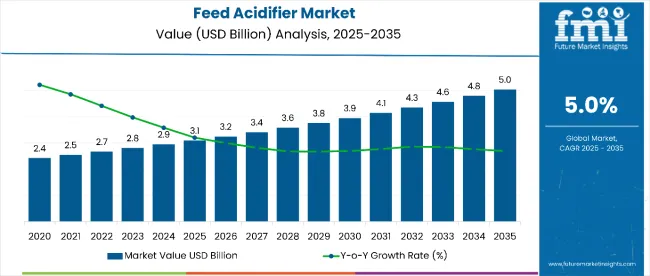
The feed acidifier market is estimated to be valued at USD 3.1 billion in 2025. It is projected to reach USD 5.0 billion by 2035, registering a compound annual growth rate (CAGR) of 5% over the forecast period.
Quick Stats for Feed Acidifier Market

  • Feed Acidifier Market Value (2025): USD 3.1 billion
  • Feed Acidifier Market Forecast Value (2035): USD 5.0 billion
  • Feed Acidifier Market Forecast CAGR: 5%
  • Leading Segment in Feed Acidifier Market in 2025: Propionic Acid (35% market share)
  • Key Growth Regions in Feed Acidifier Market: Asia-Pacific, North America, Europe
  • Top Key Players in Feed Acidifier Market: BASF SE, Corbion NV, Yara International ASA, Biomin Holding GmbH, Kemin Industries Inc., Nutrex NV, Peterlabs Holdings Berhad, Pancosma SA, Novus International Inc., Addcon Group GmbH, Jefo Nutrition Inc., Impextraco NV

Feed Acidifier Market

Metric Value
Estimated Size (2025E) USD 3.1 billion
Projected Value (2035F) USD 5.0 billion
CAGR (2025 to 2035) 5%

The market is projected to add an absolute dollar opportunity of USD 1.90 billion over the forecast period, reflecting a 1.52 times growth at a CAGR of 5%. Growth is expected to be shaped by rising demand for antibiotic-free feed additives, the expansion of livestock and poultry production, and the increasing preference for organic acids to improve gut health and nutrient absorption in farm animals.

By 2030, the market is likely to reach approximately USD 3.9 billion, accounting for USD 0.80 billion in incremental value over the first half of the decade. The remaining USD 1.10 billion is expected in the second half, suggesting a moderately back-loaded growth pattern driven by the adoption of innovative acidifier formulations and the expansion of livestock production in Asia-Pacific and Latin America.

Companies such as BASF SE, Corbion NV, and Kemin Industries Inc. are strengthening their market positions through innovation in coating technologies, improved formulations, and eco-friendly feed solutions. Strategic expansions, partnerships, and the development of high-performance, safe, and easy-to-use feed acidifiers are enhancing their competitive advantage. Regulatory compliance and product efficacy continue to anchor growth across multiple livestock segments globally.

The feed acidifier market is a subset of the global animal nutrition market, which is valued at approximately USD 70 billion, holding around 4.4% share. It also falls under the livestock feed additives market, representing about 15% of the total feed additives segment. Within the broader animal feed industry, feed acidifiers account for roughly 3% of overall feed formulation sales. Additionally, in the organic livestock solutions market, the segment represents approximately 12% share, reflecting its growing adoption in antibiotic-free and sustainable animal feed practices across major producing countries.

The market is being driven by growing demand for gut health improvement, antibiotic-free livestock production, and enhanced nutrient absorption. Innovations include coated acidifier powders, liquid formulations, and patented technologies such as SoftAcid® that reduce corrosion and improve handling safety. Recent developments include capacity expansion, digital farm integration, and precision livestock nutrition. Regional trends in Asia-Pacific, North America, and Europe indicate the adoption of advanced feed formulations and stricter regulatory compliance. At the same time, manufacturers focus on sustainability, high-performance formulations, and increased efficacy in swine, poultry, and dairy feed applications.

Why is the Feed Acidifier Market Growing?

Feed acidifiers are increasingly adopted due to their ability to improve gut health, nutrient absorption, and feed efficiency in livestock and poultry. Their role in maintaining optimal pH levels and enhancing enzymatic digestion makes them a preferred alternative to antibiotics in animal nutrition, aligning with global trends toward antibiotic-free production.

Rising demand for sustainable and high-performance livestock feed, coupled with expanding poultry, swine, and dairy production in the Asia-Pacific, North America, and Latin America, is driving growth. Innovations in coated and liquid acidifier formulations, along with precision nutrition solutions, are further boosting adoption by feed manufacturers.

Stringent regulations on antibiotic use, increasing consumer awareness of food safety, and the need for higher productivity in animal farming are sustaining market expansion. With manufacturers focusing on efficacy, safety, and regulatory compliance, the feed acidifier market is well-positioned for continued growth across global livestock and poultry sectors.

Segmental Analysis

The market is segmented by acid type, form, product type, livestock, and region. By acid type, the market is divided into propionic acid, formic acid, lactic acid, citric acid, malic acid, sorbic acid, and others (fumaric acid, butyric acid, benzoic acid). Based on form, the market is bifurcated into dry and liquid. By product type, the market is bifurcated into blended and single. In terms of livestock, the market is divided into poultry, swine, ruminants, aquaculture, pets, and others (equine). Regionally, the market is classified into North America, Europe, Asia-Pacific, Latin America, Japan and the Middle East & Africa.
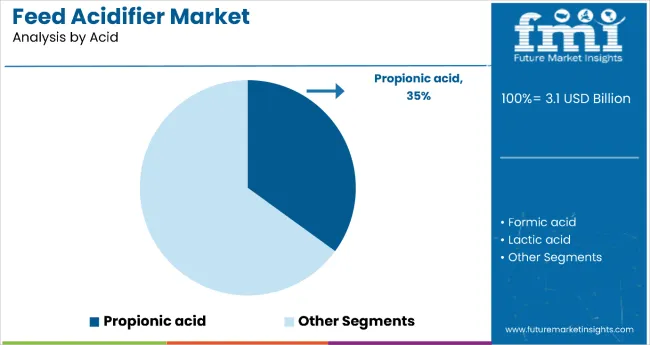
By Acid Type, Propionic Acid Segment Accounts for 35% of the Market Share

Feed Acidifier Market By Acid

The propionic acid segment holds a dominant position with 35% market share in the acid type category due to its efficacy in inhibiting mold, improving gut microflora, and enhancing nutrient absorption in poultry and swine. Its role as a natural preservative in feed extends shelf life and reduces spoilage, making it preferred by feed manufacturers targeting high-quality production.

Propionic acid formulations are versatile, suitable for both powder and liquid feed, and can be blended with other organic acids to enhance antimicrobial activity. Manufacturers are investing in advanced coating technologies to improve handling safety and reduce corrosiveness. Rising awareness about antibiotic-free livestock production further reinforces the adoption of propionic acid-based acidifiers across global feed markets.
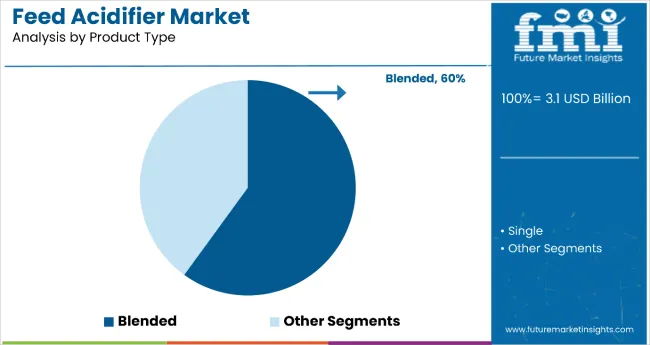
By Product Type, Blended Segment Accounts for 60% of the Market Share

Feed Acidifier Market By Product

Blended feed acidifiers dominate the product type segment with 60% market share, reflecting their versatility in combining multiple acids to achieve synergistic effects on gut health and feed efficiency. These formulations allow precise pH regulation, improved digestion, and enhanced microbial control for poultry, swine, and dairy feeds.

Blended acidifiers provide feed producers the flexibility to formulate tailored solutions for different livestock requirements, improving overall performance and productivity. Manufacturers are increasingly focusing on developing high-purity, coated blended products that reduce dust, improve handling, and maintain efficacy during feed processing. The blended segment’s dominance is supported by rising demand for multifunctional, high-performance feed additives that meet regulatory compliance and promote sustainable livestock farming practices.

What are the Drivers, Restraints, and Key Trends of the Feed Acidifier Market?

In 2025, global feed acidifier consumption is projected to grow substantially, with Asia-Pacific accounting for approximately 40% of the market. Key applications include gut health improvement, antibiotic-free feed enhancement, nutrient absorption optimization, and feed preservation. Manufacturers are introducing advanced blended formulations and coated acidifiers that improve handling safety, reduce corrosiveness, and maintain efficacy during feed processing. Rising adoption of digital farm monitoring, precision livestock nutrition, and sustainable feed practices is driving demand. Regulatory compliance, particularly regarding antibiotic reduction in livestock, is influencing formulation strategies and increasing adoption in poultry, swine, and dairy production.

Health and Performance Trends Drive Feed Acidifier Adoption

Feed acidifiers are increasingly preferred due to their ability to regulate gut microflora, enhance enzymatic digestion, and improve feed efficiency. Studies have shown that acidifier inclusion can improve nutrient digestibility by up to 15% compared to conventional feed. Blended and coated acidifiers are being deployed to achieve optimal pH balance, reduce pathogenic bacterial growth, and enhance immune responses in livestock. These benefits have resulted in higher adoption rates among industrial feed manufacturers, particularly in regions such as Asia-Pacific and Latin America, where intensive livestock and poultry production is expanding rapidly.

Supply Chain Challenges, Cost Factors, and Processing Constraints Limit Expansion

Market growth is restrained by raw material cost volatility, specialized handling requirements, and formulation complexities. Organic acids such as propionic and formic acid require careful storage and transport, increasing logistical costs by 12-18%. Coated and blended formulations necessitate advanced production facilities with precise dosing and quality control, extending development cycles by 4-6 weeks. Price sensitivity in developing economies, combined with regulatory compliance pressures, limits large-scale adoption despite rising awareness of health and productivity benefits. These constraints underscore the importance of innovation and supply chain optimization in maintaining market growth.
Feed Acidifier Market Analysis by Top Countries

Feed Acidifier Market By Country

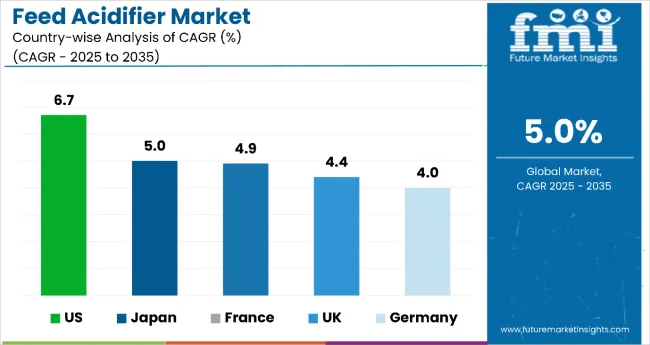
Countries CAGR (2025 to 2035)
USA 6.7%
Japan 5.0%
France 4.9%
UK 4.4%
Germany 4.0%

The feed acidifier market shows varying growth rates across major economies, with the USA leading at a CAGR of 6.7%, followed by Japan at 5%, France at 4.9%, the UK at 4.4%, and Germany at 4%. Higher growth in the USA is supported by large-scale poultry and swine production, technological adoption in feed formulations, and strict antibiotic-free mandates. Japan’s moderate growth reflects steady demand in precision livestock nutrition, while regulatory compliance, sustainable feed practices, and functional acidifier innovations drive European countries such as France, the UK, and Germany.

The report covers an in-depth analysis of 40+ countries; five top-performing OECD countries are highlighted below.

Market Expansion in the Feed Acidifier Market in the United States

The feed acidifier market in the USA is projected to grow at a CAGR of 6.7% from 2025 to 2035, driven by demand for antibiotic-free feed additives and gut-health-promoting solutions. Producers are increasingly adopting blended and coated acidifiers to improve nutrient absorption, feed efficiency, and livestock performance in poultry and swine. Technological advancements in feed processing, coupled with heightened awareness of animal nutrition, are boosting adoption. Expansion in the Midwest and Southeast regions is particularly notable due to high livestock density.

  • Leading adoption in poultry and swine sectors across the Midwest and Southeast regions
  • 42% of feed formulations include propionic acid-based acidifiers
  • $1.1 billion invested in feed acidifier innovation and processing facilities

Future Growth Outlook in Feed Acidifier Market in Japan

Demand for feed acidifier in Japan is expected to expand at a CAGR of 5% from 2025 to 2035, supported by precision nutrition programs and high-quality livestock feed demand. Urban and industrial poultry and swine farms in regions like Hokkaido, Kyushu, and Chubu are increasingly using blended acidifiers to enhance gut health, feed digestibility, and nutrient utilization. Growth is further aided by government initiatives promoting antibiotic-free feed and sustainable farming practices. Coated formulations are preferred to improve handling safety and maintain efficacy during feed processing.

  • 33% of applications focused on blended acidifier formulations
  • Government regulations promote reduced antibiotic usage in animal feed
  • High adoption of coated acidifiers to improve safety and handling

Market Development in the Feed Acidifier Market in France

Revenue from feed acidifier in France is estimated to rise at a CAGR of 4.9% from 2025 to 2035, driven by stringent EU regulations on antibiotic-free feed and sustainable livestock production. Key growth regions include Brittany, Normandy, and Auvergne, where dairy and poultry feed demand is high. Adoption of propionic acid-based and blended acidifiers enhances feed quality, digestion, and gut microbiota management. Partnerships between feed manufacturers and livestock cooperatives support broader distribution and formulation innovation. Coated acidifiers are increasingly preferred for safe handling and storage in industrial feed operations.

  • 29% of feed formulations use propionic acid
  • Increasing preference for coated acidifiers for handling safety
  • Collaboration between feed manufacturers and livestock cooperatives enhances adoption

Growth Assessment for Feed Acidifier Market in the United Kingdom

Sales of feed acidifier in the UK are anticipated to increase at a CAGR of 4.4% from 2025 to 2035. Adoption is driven by functional feed additives for poultry and swine, regulatory compliance with EU-origin feed standards, and rising demand for antibiotic-free livestock nutrition. Key regions include England, Scotland, and Wales, where industrial feed production is concentrated. Blended acidifiers dominate due to enhanced efficacy, safety, and digestibility. Despite limited domestic production, the import of advanced formulations supports growth and strengthens feed quality and livestock performance.

  • 31% of feed formulations include blended acidifiers
  • High adoption in poultry feed applications in England and Scotland
  • Regulatory compliance with EU-origin feed standards drives product development

Innovation-led Growth Outlook of Feed Acidifier Market in Germany

The feed acidifier market in Germany is poised to strengthen at a CAGR of 4% from 2025 to 2035, driven by high livestock density, regulatory mandates, and the adoption of sustainable feed solutions. Growth is concentrated in the poultry and swine sectors across Bavaria, Lower Saxony, and North Rhine-Westphalia. Propionic acid-based and blended acidifiers are preferred for gut health improvement, nutrient absorption, and feed preservation. Coated acidifiers enhance handling safety and reduce corrosiveness, making them suitable for industrial feed applications. Research and innovation in feed formulations are further supporting market expansion.
  • 28% of formulations utilize propionic acid-based acidifiers
  • Strong focus on poultry and swine feed efficiency
  • Innovations in coated acidifier products support safe handling and storage

Competitive Landscape of Feed Acidifier Market

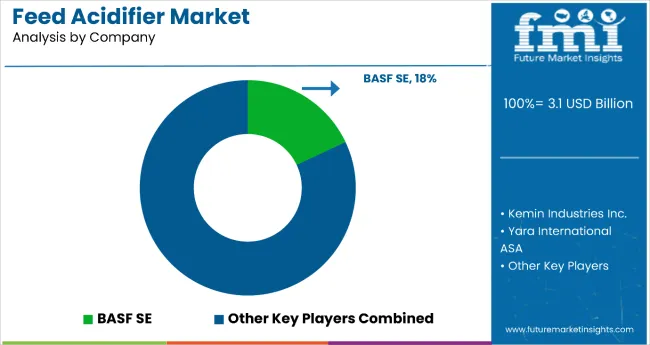
Feed Acidifier Market By Company

The feed acidifier market is moderately consolidated, comprising global chemical and feed additive giants, specialized animal nutrition companies, and regional manufacturers with varying degrees of formulation expertise and application technology. BASF SE, Corbion NV, and Kemin Industries Inc. lead the global feed acidifier segment, offering proprietary organic acids, blended formulations, and coated acidifiers for poultry, swine, and ruminant applications. Their competitive advantage lies in established distribution networks, extensive R&D capabilities, and experience in compliance with international feed safety standards, enabling reliable supply across large-scale commercial operations.

Companies such as Yara International ASA, Biomin Holding GmbH, and Pancosma SA differentiate themselves through specialty acidifier solutions, including propionic, formic, and lactic acid-based products designed for improved gut health, nutrient absorption, and feed preservation. These players leverage application-specific expertise and coating technologies to reduce corrosiveness, optimize handling, and enhance efficacy in complex feed formulations. Regional players such as Nutrex NV, Jefo Nutrition Inc., and Addcon Group GmbH emphasize localized solutions, blending feed acidifiers with other performance additives and providing technical support to small- and medium-scale livestock producers.

Entry barriers in the feed acidifier market remain significant due to the need for advanced formulation technologies, precise dosing capabilities, regulatory compliance across multiple jurisdictions, and supply chain integration for raw acids and coated products. Competitiveness increasingly depends on formulation innovation, product safety, handling efficiency, and the ability to offer customized acidifier solutions for diverse livestock species and production systems. Continuous investment in R&D, pilot-scale trials, and collaborations with feed manufacturers are essential for maintaining market leadership and expanding adoption in emerging regions.

Scope of Report

Item Value
Quantitative Units USD 3.1 Billion
Acid Type Propionic acid, Formic acid, Lactic acid, Citric acid, Malic acid, Sorbic acid, Others (Fumaric Acid, Butyric Acid, Benzoic Ac id)
Form Dry and Liquid
Product Type Blended and Single
Livestock Poultry, Swine, Ruminants, Aquaculture, Pets, Others (Equine)
Regions Covered North America, Europe, Asia-Pacific, Latin America, Japan, Middle East & Africa
Country Covered United States, Canada, United Kingdom, Germany, France, China, Japan, South Korea, Brazil, Australia and 40+ countries
Key Companies Profiled BASF SE, Corbion NV, Yara International ASA, Biomin Holding GmbH, Kemin Industries Inc., Nutrex NV, Peterlabs Holdings Berhad, Pancosma SA, Novus International Inc., Addcon Group GmbH, Jefo Nutrition Inc., Impextraco NV
Additional Attributes Dollar sales by application and purity grade, regional demand trends, competitive landscape, consumer preferences for natural versus synthetic alternatives, integration with sustainable sourcing practices, innovations in extraction technology and quality standardization for diverse industrial applications

Key Segments

By Acid Type:

  • Propionic acid
  • Formic acid
  • Lactic acid
  • Citric acid
  • Malic acid
  • Sorbic acid
  • Others (fumaric acid, butyric acid, benzoic acid etc.)

By Form:

  • Dry
  • Liquid

By Product Type:

  • Blended
  • Single

By Livestock:

  • Poultry
  • Swine
  • Ruminants
  • Aquaculture
  • Pets
  • Others (Equine etc.)

By Region:

  • North America
  • Latin America
  • Western Europe
  • Eastern Europe
  • East Asia
  • South Asia & Pacific
  • Middle East and Africa

Table of Content

  1. Executive Summary
    • Global Market Outlook
    • Demand-side Trends
    • Supply-side Trends
    • Technology Roadmap Analysis
    • Analysis and Recommendations
  2. Market Overview
    • Market Coverage / Taxonomy
    • Market Definition / Scope / Limitations
  3. Market Background
    • Market Dynamics
      • Drivers
      • Restraints
      • Opportunity
      • Trends
    • Scenario Forecast
      • Demand in Optimistic Scenario
      • Demand in Likely Scenario
      • Demand in Conservative Scenario
    • Opportunity Map Analysis
    • Product Life Cycle Analysis
    • Supply Chain Analysis
      • Supply Side Participants and their Roles
        • Producers
        • Mid-Level Participants (Traders/ Agents/ Brokers)
        • Wholesalers and Distributors
      • Value Added and Value Created at Node in the Supply Chain
      • List of Raw Material Suppliers
      • List of Existing and Potential Buyer’s
    • Investment Feasibility Matrix
    • Value Chain Analysis
      • Profit Margin Analysis
      • Wholesalers and Distributors
      • Retailers
    • PESTLE and Porter’s Analysis
    • Regulatory Landscape
      • By Key Regions
      • By Key Countries
    • Regional Parent Market Outlook
    • Production and Consumption Statistics
    • Import and Export Statistics
  4. Global Market Analysis 2020 to 2024 and Forecast, 2025 to 2035
    • Historical Market Size Value (USD Billion) & Volume (Metric Tons) Analysis, 2020 to 2024
    • Current and Future Market Size Value (USD Billion) & Volume (Metric Tons) Projections, 2025 to 2035
      • Y-o-Y Growth Trend Analysis
      • Absolute $ Opportunity Analysis
  5. Global Market Pricing Analysis 2020 to 2024 and Forecast 2025 to 2035
  6. Global Market Analysis 2020 to 2024 and Forecast 2025 to 2035, By Acid Type
    • Introduction / Key Findings
    • Historical Market Size Value (USD Billion) & Volume (Metric Tons) Analysis By Acid Type, 2020 to 2024
    • Current and Future Market Size Value (USD Billion) & Volume (Metric Tons) Analysis and Forecast By Acid Type, 2025 to 2035
      • Propionic acid
      • Formic acid
      • Lactic acid
      • Citric acid
      • Malic acid
      • Sorbic acid
      • Others (Fumaric Acid, Butyric Acid, Benzoic Acid)
    • Y-o-Y Growth Trend Analysis By Acid Type, 2020 to 2024
    • Absolute $ Opportunity Analysis By Acid Type, 2025 to 2035
  7. Global Market Analysis 2020 to 2024 and Forecast 2025 to 2035, By Form
    • Introduction / Key Findings
    • Historical Market Size Value (USD Billion) & Volume (Metric Tons) Analysis By Form, 2020 to 2024
    • Current and Future Market Size Value (USD Billion) & Volume (Metric Tons) Analysis and Forecast By Form, 2025 to 2035
      • Dry
      • Liquid
    • Y-o-Y Growth Trend Analysis By Form, 2020 to 2024
    • Absolute $ Opportunity Analysis By Form, 2025 to 2035
  8. Global Market Analysis 2020 to 2024 and Forecast 2025 to 2035, By Product Type
    • Introduction / Key Findings
    • Historical Market Size Value (USD Billion) & Volume (Metric Tons) Analysis By Product Type, 2020 to 2024
    • Current and Future Market Size Value (USD Billion) & Volume (Metric Tons) Analysis and Forecast By Product Type, 2025 to 2035
      • Blended
      • Single
    • Y-o-Y Growth Trend Analysis By Product Type, 2020 to 2024
    • Absolute $ Opportunity Analysis By Product Type, 2025 to 2035
  9. Global Market Analysis 2020 to 2024 and Forecast 2025 to 2035, By Livestock
    • Introduction / Key Findings
    • Historical Market Size Value (USD Billion) & Volume (Metric Tons) Analysis By Livestock, 2020 to 2024
    • Current and Future Market Size Value (USD Billion) & Volume (Metric Tons) Analysis and Forecast By Livestock, 2025 to 2035
      • Poultry
      • Swine
      • Ruminants
      • Aquaculture
      • Pets
      • Others (Equine)
    • Y-o-Y Growth Trend Analysis By Livestock, 2020 to 2024
    • Absolute $ Opportunity Analysis By Livestock, 2025 to 2035
  10. Global Market Analysis 2020 to 2024 and Forecast 2025 to 2035, By Region
    • Introduction
    • Historical Market Size Value (USD Billion) & Volume (Metric Tons) Analysis By Region, 2020 to 2024
    • Current Market Size Value (USD Billion) & Volume (Metric Tons) Analysis and Forecast By Region, 2025 to 2035
      • North America
      • Latin America
      • Western Europe
      • Eastern Europe
      • East Asia
      • South Asia & Pacific
      • Middle East and Africa
    • Market Attractiveness Analysis By Region
  11. North America Market Analysis 2020 to 2024 and Forecast 2025 to 2035, By Country
    • Historical Market Size Value (USD Billion) & Volume (Metric Tons) Trend Analysis By Market Taxonomy, 2020 to 2024
    • Market Size Value (USD Billion) & Volume (Metric Tons) Forecast By Market Taxonomy, 2025 to 2035
      • By Country
        • USA
        • Canada
        • Mexico
      • By Acid Type
      • By Form
      • By Product Type
      • By Livestock
    • Market Attractiveness Analysis
      • By Country
      • By Acid Type
      • By Form
      • By Product Type
      • By Livestock
    • Key Takeaways
  12. Latin America Market Analysis 2020 to 2024 and Forecast 2025 to 2035, By Country
    • Historical Market Size Value (USD Billion) & Volume (Metric Tons) Trend Analysis By Market Taxonomy, 2020 to 2024
    • Market Size Value (USD Billion) & Volume (Metric Tons) Forecast By Market Taxonomy, 2025 to 2035
      • By Country
        • Brazil
        • Argentina
        • Rest of LATAM
      • By Acid Type
      • By Form
      • By Product Type
      • By Livestock
    • Market Attractiveness Analysis
      • By Country
      • By Acid Type
      • By Form
      • By Product Type
      • By Livestock
    • Key Takeaways
  13. Western Europe Market Analysis 2020 to 2024 and Forecast 2025 to 2035, By Country
    • Historical Market Size Value (USD Billion) & Volume (Metric Tons) Trend Analysis By Market Taxonomy, 2020 to 2024
    • Market Size Value (USD Billion) & Volume (Metric Tons) Forecast By Market Taxonomy, 2025 to 2035
      • By Country
        • Germany
        • Italy
        • France
        • UK
        • Spain
        • BENELUX
        • Nordic
        • Rest of W.Europe
      • By Acid Type
      • By Form
      • By Product Type
      • By Livestock
    • Market Attractiveness Analysis
      • By Country
      • By Acid Type
      • By Form
      • By Product Type
      • By Livestock
    • Key Takeaways
  14. Eastern Europe Market Analysis 2020 to 2024 and Forecast 2025 to 2035, By Country
    • Historical Market Size Value (USD Billion) & Volume (Metric Tons) Trend Analysis By Market Taxonomy, 2020 to 2024
    • Market Size Value (USD Billion) & Volume (Metric Tons) Forecast By Market Taxonomy, 2025 to 2035
      • By Country
        • Russia
        • Hungary
        • Poland
        • Balkan & Baltics
        • Rest of E. Europe
      • By Acid Type
      • By Form
      • By Product Type
      • By Livestock
    • Market Attractiveness Analysis
      • By Country
      • By Acid Type
      • By Form
      • By Product Type
      • By Livestock
    • Key Takeaways
  15. East Asia Market Analysis 2020 to 2024 and Forecast 2025 to 2035, By Country
    • Historical Market Size Value (USD Billion) & Volume (Metric Tons) Trend Analysis By Market Taxonomy, 2020 to 2024
    • Market Size Value (USD Billion) & Volume (Metric Tons) Forecast By Market Taxonomy, 2025 to 2035
      • By Country
        • China
        • Japan
        • South Korea
      • By Acid Type
      • By Form
      • By Product Type
      • By Livestock
    • Market Attractiveness Analysis
      • By Country
      • By Acid Type
      • By Form
      • By Product Type
      • By Livestock
    • Key Takeaways
  16. South Asia & Pacific Market Analysis 2020 to 2024 and Forecast 2025 to 2035, By Country
    • Historical Market Size Value (USD Billion) & Volume (Metric Tons) Trend Analysis By Market Taxonomy, 2020 to 2024
    • Market Size Value (USD Billion) & Volume (Metric Tons) Forecast By Market Taxonomy, 2025 to 2035
      • By Country
        • India
        • Australia & New Zealand
        • ASEAN
        • Rest of SAP
      • By Acid Type
      • By Form
      • By Product Type
      • By Livestock
    • Market Attractiveness Analysis
      • By Country
      • By Acid Type
      • By Form
      • By Product Type
      • By Livestock
    • Key Takeaways
  17. Middle East and Africa Market Analysis 2020 to 2024 and Forecast 2025 to 2035, By Country
    • Historical Market Size Value (USD Billion) & Volume (Metric Tons) Trend Analysis By Market Taxonomy, 2020 to 2024
    • Market Size Value (USD Billion) & Volume (Metric Tons) Forecast By Market Taxonomy, 2025 to 2035
      • By Country
        • GCC Countries
        • Northern Africa
        • South Africa
        • Turkiye
        • Rest of MEA
      • By Acid Type
      • By Form
      • By Product Type
      • By Livestock
    • Market Attractiveness Analysis
      • By Country
      • By Acid Type
      • By Form
      • By Product Type
      • By Livestock
    • Key Takeaways
  18. Key Countries Market Analysis
    • USA
      • Pricing Analysis
      • Market Share Analysis, 2024
        • By Acid Type
        • By Form
        • By Product Type
        • By Livestock
    • Canada
      • Pricing Analysis
      • Market Share Analysis, 2024
        • By Acid Type
        • By Form
        • By Product Type
        • By Livestock
    • Brazil
      • Pricing Analysis
      • Market Share Analysis, 2024
        • By Acid Type
        • By Form
        • By Product Type
        • By Livestock
    • Mexico
      • Pricing Analysis
      • Market Share Analysis, 2024
        • By Acid Type
        • By Form
        • By Product Type
        • By Livestock
    • Argentina
      • Pricing Analysis
      • Market Share Analysis, 2024
        • By Acid Type
        • By Form
        • By Product Type
        • By Livestock
  19. Market Structure Analysis
    • Competition Dashboard
    • Competition Benchmarking
    • Market Share Analysis of Top Players
      • By Regional
      • By Acid Type
      • By Form
      • By Product Type
      • By Livestock
  20. Competition Analysis
    • Competition Deep Dive
      • BASF SE
        • Overview
        • Product Portfolio
        • Profitability by Market Segments (Product/Age /Sales Channel/Region)
        • Sales Footprint
        • Strategy Overview
          • Marketing Strategy
          • Product Strategy
          • Channel Strategy
      • Corbion NV
        • Overview
        • Product Portfolio
        • Profitability by Market Segments (Product/Age /Sales Channel/Region)
        • Sales Footprint
        • Strategy Overview
          • Marketing Strategy
          • Product Strategy
          • Channel Strategy
      • Yara International ASA
        • Overview
        • Product Portfolio
        • Profitability by Market Segments (Product/Age /Sales Channel/Region)
        • Sales Footprint
        • Strategy Overview
          • Marketing Strategy
          • Product Strategy
          • Channel Strategy
      • Biomin Holding GmbH
        • Overview
        • Product Portfolio
        • Profitability by Market Segments (Product/Age /Sales Channel/Region)
        • Sales Footprint
        • Strategy Overview
          • Marketing Strategy
          • Product Strategy
          • Channel Strategy
      • Kemin Industries Inc.
        • Overview
        • Product Portfolio
        • Profitability by Market Segments (Product/Age /Sales Channel/Region)
        • Sales Footprint
        • Strategy Overview
          • Marketing Strategy
          • Product Strategy
          • Channel Strategy
      • Nutrex NV.
        • Overview
        • Product Portfolio
        • Profitability by Market Segments (Product/Age /Sales Channel/Region)
        • Sales Footprint
        • Strategy Overview
          • Marketing Strategy
          • Product Strategy
          • Channel Strategy
      • Peterlabs Holdings Berhad
        • Overview
        • Product Portfolio
        • Profitability by Market Segments (Product/Age /Sales Channel/Region)
        • Sales Footprint
        • Strategy Overview
          • Marketing Strategy
          • Product Strategy
          • Channel Strategy
      • Pancosma SA
        • Overview
        • Product Portfolio
        • Profitability by Market Segments (Product/Age /Sales Channel/Region)
        • Sales Footprint
        • Strategy Overview
          • Marketing Strategy
          • Product Strategy
          • Channel Strategy
      • Novus International Inc.
        • Overview
        • Product Portfolio
        • Profitability by Market Segments (Product/Age /Sales Channel/Region)
        • Sales Footprint
        • Strategy Overview
          • Marketing Strategy
          • Product Strategy
          • Channel Strategy
      • Addcon Group GmbH
        • Overview
        • Product Portfolio
        • Profitability by Market Segments (Product/Age /Sales Channel/Region)
        • Sales Footprint
        • Strategy Overview
          • Marketing Strategy
          • Product Strategy
          • Channel Strategy
      • Jefo Nutrition Inc.
        • Overview
        • Product Portfolio
        • Profitability by Market Segments (Product/Age /Sales Channel/Region)
        • Sales Footprint
        • Strategy Overview
          • Marketing Strategy
          • Product Strategy
          • Channel Strategy
      • Impextraco NV
        • Overview
        • Product Portfolio
        • Profitability by Market Segments (Product/Age /Sales Channel/Region)
        • Sales Footprint
        • Strategy Overview
          • Marketing Strategy
          • Product Strategy
          • Channel Strategy
  21. Assumptions & Acronyms Used
  22. Research Methodology

List of Tables

  • Table 1: Global Market Value (USD Billion) Forecast by Region, 2020-2035
  • Table 2: Global Market Volume (Metric Tons) Forecast by Region, 2020-2035
  • Table 3: Global Market Value (USD Billion) Forecast by Acid Type, 2020-2035
  • Table 4: Global Market Volume (Metric Tons) Forecast by Acid Type, 2020-2035
  • Table 5: Global Market Value (USD Billion) Forecast by Form, 2020-2035
  • Table 6: Global Market Volume (Metric Tons) Forecast by Form, 2020-2035
  • Table 7: Global Market Value (USD Billion) Forecast by Product Type, 2020-2035
  • Table 8: Global Market Volume (Metric Tons) Forecast by Product Type, 2020-2035
  • Table 9: Global Market Value (USD Billion) Forecast by Livestock, 2020-2035
  • Table 10: Global Market Volume (Metric Tons) Forecast by Livestock, 2020-2035
  • Table 11: North America Market Value (USD Billion) Forecast by Country, 2020-2035
  • Table 12: North America Market Volume (Metric Tons) Forecast by Country, 2020-2035
  • Table 13: North America Market Value (USD Billion) Forecast by Acid Type, 2020-2035
  • Table 14: North America Market Volume (Metric Tons) Forecast by Acid Type, 2020-2035
  • Table 15: North America Market Value (USD Billion) Forecast by Form, 2020-2035
  • Table 16: North America Market Volume (Metric Tons) Forecast by Form, 2020-2035
  • Table 17: North America Market Value (USD Billion) Forecast by Product Type, 2020-2035
  • Table 18: North America Market Volume (Metric Tons) Forecast by Product Type, 2020-2035
  • Table 19: North America Market Value (USD Billion) Forecast by Livestock, 2020-2035
  • Table 20: North America Market Volume (Metric Tons) Forecast by Livestock, 2020-2035
  • Table 21: Latin America Market Value (USD Billion) Forecast by Country, 2020-2035
  • Table 22: Latin America Market Volume (Metric Tons) Forecast by Country, 2020-2035
  • Table 23: Latin America Market Value (USD Billion) Forecast by Acid Type, 2020-2035
  • Table 24: Latin America Market Volume (Metric Tons) Forecast by Acid Type, 2020-2035
  • Table 25: Latin America Market Value (USD Billion) Forecast by Form, 2020-2035
  • Table 26: Latin America Market Volume (Metric Tons) Forecast by Form, 2020-2035
  • Table 27: Latin America Market Value (USD Billion) Forecast by Product Type, 2020-2035
  • Table 28: Latin America Market Volume (Metric Tons) Forecast by Product Type, 2020-2035
  • Table 29: Latin America Market Value (USD Billion) Forecast by Livestock, 2020-2035
  • Table 30: Latin America Market Volume (Metric Tons) Forecast by Livestock, 2020-2035
  • Table 31: Western Europe Market Value (USD Billion) Forecast by Country, 2020-2035
  • Table 32: Western Europe Market Volume (Metric Tons) Forecast by Country, 2020-2035
  • Table 33: Western Europe Market Value (USD Billion) Forecast by Acid Type, 2020-2035
  • Table 34: Western Europe Market Volume (Metric Tons) Forecast by Acid Type, 2020-2035
  • Table 35: Western Europe Market Value (USD Billion) Forecast by Form, 2020-2035
  • Table 36: Western Europe Market Volume (Metric Tons) Forecast by Form, 2020-2035
  • Table 37: Western Europe Market Value (USD Billion) Forecast by Product Type, 2020-2035
  • Table 38: Western Europe Market Volume (Metric Tons) Forecast by Product Type, 2020-2035
  • Table 39: Western Europe Market Value (USD Billion) Forecast by Livestock, 2020-2035
  • Table 40: Western Europe Market Volume (Metric Tons) Forecast by Livestock, 2020-2035
  • Table 41: Eastern Europe Market Value (USD Billion) Forecast by Country, 2020-2035
  • Table 42: Eastern Europe Market Volume (Metric Tons) Forecast by Country, 2020-2035
  • Table 43: Eastern Europe Market Value (USD Billion) Forecast by Acid Type, 2020-2035
  • Table 44: Eastern Europe Market Volume (Metric Tons) Forecast by Acid Type, 2020-2035
  • Table 45: Eastern Europe Market Value (USD Billion) Forecast by Form, 2020-2035
  • Table 46: Eastern Europe Market Volume (Metric Tons) Forecast by Form, 2020-2035
  • Table 47: Eastern Europe Market Value (USD Billion) Forecast by Product Type, 2020-2035
  • Table 48: Eastern Europe Market Volume (Metric Tons) Forecast by Product Type, 2020-2035
  • Table 49: Eastern Europe Market Value (USD Billion) Forecast by Livestock, 2020-2035
  • Table 50: Eastern Europe Market Volume (Metric Tons) Forecast by Livestock, 2020-2035
  • Table 51: East Asia Market Value (USD Billion) Forecast by Country, 2020-2035
  • Table 52: East Asia Market Volume (Metric Tons) Forecast by Country, 2020-2035
  • Table 53: East Asia Market Value (USD Billion) Forecast by Acid Type, 2020-2035
  • Table 54: East Asia Market Volume (Metric Tons) Forecast by Acid Type, 2020-2035
  • Table 55: East Asia Market Value (USD Billion) Forecast by Form, 2020-2035
  • Table 56: East Asia Market Volume (Metric Tons) Forecast by Form, 2020-2035
  • Table 57: East Asia Market Value (USD Billion) Forecast by Product Type, 2020-2035
  • Table 58: East Asia Market Volume (Metric Tons) Forecast by Product Type, 2020-2035
  • Table 59: East Asia Market Value (USD Billion) Forecast by Livestock, 2020-2035
  • Table 60: East Asia Market Volume (Metric Tons) Forecast by Livestock, 2020-2035
  • Table 61: South Asia & Pacific Market Value (USD Billion) Forecast by Country, 2020-2035
  • Table 62: South Asia & Pacific Market Volume (Metric Tons) Forecast by Country, 2020-2035
  • Table 63: South Asia & Pacific Market Value (USD Billion) Forecast by Acid Type, 2020-2035
  • Table 64: South Asia & Pacific Market Volume (Metric Tons) Forecast by Acid Type, 2020-2035
  • Table 65: South Asia & Pacific Market Value (USD Billion) Forecast by Form, 2020-2035
  • Table 66: South Asia & Pacific Market Volume (Metric Tons) Forecast by Form, 2020-2035
  • Table 67: South Asia & Pacific Market Value (USD Billion) Forecast by Product Type, 2020-2035
  • Table 68: South Asia & Pacific Market Volume (Metric Tons) Forecast by Product Type, 2020-2035
  • Table 69: South Asia & Pacific Market Value (USD Billion) Forecast by Livestock, 2020-2035
  • Table 70: South Asia & Pacific Market Volume (Metric Tons) Forecast by Livestock, 2020-2035
  • Table 71: Middle East and Africa Market Value (USD Billion) Forecast by Country, 2020-2035
  • Table 72: Middle East and Africa Market Volume (Metric Tons) Forecast by Country, 2020-2035
  • Table 73: Middle East and Africa Market Value (USD Billion) Forecast by Acid Type, 2020-2035
  • Table 74: Middle East and Africa Market Volume (Metric Tons) Forecast by Acid Type, 2020-2035
  • Table 75: Middle East and Africa Market Value (USD Billion) Forecast by Form, 2020-2035
  • Table 76: Middle East and Africa Market Volume (Metric Tons) Forecast by Form, 2020-2035
  • Table 77: Middle East and Africa Market Value (USD Billion) Forecast by Product Type, 2020-2035
  • Table 78: Middle East and Africa Market Volume (Metric Tons) Forecast by Product Type, 2020-2035
  • Table 79: Middle East and Africa Market Value (USD Billion) Forecast by Livestock, 2020-2035
  • Table 80: Middle East and Africa Market Volume (Metric Tons) Forecast by Livestock, 2020-2035

List of Figures

  • Figure 1: Global Market Volume (Metric Tons) Forecast 2020-2035
  • Figure 2: Global Market Pricing Analysis
  • Figure 3: Global Market Value (USD Billion) Forecast 2020-2035
  • Figure 4: Global Market Value Share and BPS Analysis by Acid Type, 2025 and 2035
  • Figure 5: Global Market Y-o-Y Growth Comparison by Acid Type, 2025-2035
  • Figure 6: Global Market Attractiveness Analysis by Acid Type
  • Figure 7: Global Market Value Share and BPS Analysis by Form, 2025 and 2035
  • Figure 8: Global Market Y-o-Y Growth Comparison by Form, 2025-2035
  • Figure 9: Global Market Attractiveness Analysis by Form
  • Figure 10: Global Market Value Share and BPS Analysis by Product Type, 2025 and 2035
  • Figure 11: Global Market Y-o-Y Growth Comparison by Product Type, 2025-2035
  • Figure 12: Global Market Attractiveness Analysis by Product Type
  • Figure 13: Global Market Value Share and BPS Analysis by Livestock, 2025 and 2035
  • Figure 14: Global Market Y-o-Y Growth Comparison by Livestock, 2025-2035
  • Figure 15: Global Market Attractiveness Analysis by Livestock 
  • Figure 16: Global Market Value (USD Billion) Share and BPS Analysis by Region, 2025 and 2035
  • Figure 17: Global Market Y-o-Y Growth Comparison by Region, 2025-2035
  • Figure 18: Global Market Attractiveness Analysis by Region
  • Figure 19: North America Market Incremental $ Opportunity, 2025-2035
  • Figure 20: Latin America Market Incremental $ Opportunity, 2025-2035
  • Figure 21: Western Europe Market Incremental $ Opportunity, 2025-2035
  • Figure 22: Eastern Europe Market Incremental $ Opportunity, 2025-2035
  • Figure 23: East Asia Market Incremental $ Opportunity, 2025-2035
  • Figure 24: South Asia & Pacific Market Incremental $ Opportunity, 2025-2035
  • Figure 25: Middle East and Africa Market Incremental $ Opportunity, 2025-2035
  • Figure 26: North America Market Value Share and BPS Analysis by Country, 2025 and 2035
  • Figure 27: North America Market Value Share and BPS Analysis by Acid Type, 2025 and 2035
  • Figure 28: North America Market Y-o-Y Growth Comparison by Acid Type, 2025-2035
  • Figure 29: North America Market Attractiveness Analysis by Acid Type
  • Figure 30: North America Market Value Share and BPS Analysis by Form, 2025 and 2035
  • Figure 31: North America Market Y-o-Y Growth Comparison by Form, 2025-2035
  • Figure 32: North America Market Attractiveness Analysis by Form
  • Figure 33: North America Market Value Share and BPS Analysis by Product Type, 2025 and 2035
  • Figure 34: North America Market Y-o-Y Growth Comparison by Product Type, 2025-2035
  • Figure 35: North America Market Attractiveness Analysis by Product Type
  • Figure 36: North America Market Value Share and BPS Analysis by Livestock, 2025 and 2035
  • Figure 37: North America Market Y-o-Y Growth Comparison by Livestock, 2025-2035
  • Figure 38: North America Market Attractiveness Analysis by Livestock 
  • Figure 39: Latin America Market Value Share and BPS Analysis by Country, 2025 and 2035
  • Figure 40: Latin America Market Value Share and BPS Analysis by Acid Type, 2025 and 2035
  • Figure 41: Latin America Market Y-o-Y Growth Comparison by Acid Type, 2025-2035
  • Figure 42: Latin America Market Attractiveness Analysis by Acid Type
  • Figure 43: Latin America Market Value Share and BPS Analysis by Form, 2025 and 2035
  • Figure 44: Latin America Market Y-o-Y Growth Comparison by Form, 2025-2035
  • Figure 45: Latin America Market Attractiveness Analysis by Form
  • Figure 46: Latin America Market Value Share and BPS Analysis by Product Type, 2025 and 2035
  • Figure 47: Latin America Market Y-o-Y Growth Comparison by Product Type, 2025-2035
  • Figure 48: Latin America Market Attractiveness Analysis by Product Type
  • Figure 49: Latin America Market Value Share and BPS Analysis by Livestock, 2025 and 2035
  • Figure 50: Latin America Market Y-o-Y Growth Comparison by Livestock, 2025-2035
  • Figure 51: Latin America Market Attractiveness Analysis by Livestock 
  • Figure 52: Western Europe Market Value Share and BPS Analysis by Country, 2025 and 2035
  • Figure 53: Western Europe Market Value Share and BPS Analysis by Acid Type, 2025 and 2035
  • Figure 54: Western Europe Market Y-o-Y Growth Comparison by Acid Type, 2025-2035
  • Figure 55: Western Europe Market Attractiveness Analysis by Acid Type
  • Figure 56: Western Europe Market Value Share and BPS Analysis by Form, 2025 and 2035
  • Figure 57: Western Europe Market Y-o-Y Growth Comparison by Form, 2025-2035
  • Figure 58: Western Europe Market Attractiveness Analysis by Form
  • Figure 59: Western Europe Market Value Share and BPS Analysis by Product Type, 2025 and 2035
  • Figure 60: Western Europe Market Y-o-Y Growth Comparison by Product Type, 2025-2035
  • Figure 61: Western Europe Market Attractiveness Analysis by Product Type
  • Figure 62: Western Europe Market Value Share and BPS Analysis by Livestock, 2025 and 2035
  • Figure 63: Western Europe Market Y-o-Y Growth Comparison by Livestock, 2025-2035
  • Figure 64: Western Europe Market Attractiveness Analysis by Livestock 
  • Figure 65: Eastern Europe Market Value Share and BPS Analysis by Country, 2025 and 2035
  • Figure 66: Eastern Europe Market Value Share and BPS Analysis by Acid Type, 2025 and 2035
  • Figure 67: Eastern Europe Market Y-o-Y Growth Comparison by Acid Type, 2025-2035
  • Figure 68: Eastern Europe Market Attractiveness Analysis by Acid Type
  • Figure 69: Eastern Europe Market Value Share and BPS Analysis by Form, 2025 and 2035
  • Figure 70: Eastern Europe Market Y-o-Y Growth Comparison by Form, 2025-2035
  • Figure 71: Eastern Europe Market Attractiveness Analysis by Form
  • Figure 72: Eastern Europe Market Value Share and BPS Analysis by Product Type, 2025 and 2035
  • Figure 73: Eastern Europe Market Y-o-Y Growth Comparison by Product Type, 2025-2035
  • Figure 74: Eastern Europe Market Attractiveness Analysis by Product Type
  • Figure 75: Eastern Europe Market Value Share and BPS Analysis by Livestock, 2025 and 2035
  • Figure 76: Eastern Europe Market Y-o-Y Growth Comparison by Livestock, 2025-2035
  • Figure 77: Eastern Europe Market Attractiveness Analysis by Livestock 
  • Figure 78: East Asia Market Value Share and BPS Analysis by Country, 2025 and 2035
  • Figure 79: East Asia Market Value Share and BPS Analysis by Acid Type, 2025 and 2035
  • Figure 80: East Asia Market Y-o-Y Growth Comparison by Acid Type, 2025-2035
  • Figure 81: East Asia Market Attractiveness Analysis by Acid Type
  • Figure 82: East Asia Market Value Share and BPS Analysis by Form, 2025 and 2035
  • Figure 83: East Asia Market Y-o-Y Growth Comparison by Form, 2025-2035
  • Figure 84: East Asia Market Attractiveness Analysis by Form
  • Figure 85: East Asia Market Value Share and BPS Analysis by Product Type, 2025 and 2035
  • Figure 86: East Asia Market Y-o-Y Growth Comparison by Product Type, 2025-2035
  • Figure 87: East Asia Market Attractiveness Analysis by Product Type
  • Figure 88: East Asia Market Value Share and BPS Analysis by Livestock, 2025 and 2035
  • Figure 89: East Asia Market Y-o-Y Growth Comparison by Livestock, 2025-2035
  • Figure 90: East Asia Market Attractiveness Analysis by Livestock 
  • Figure 91: South Asia & Pacific Market Value Share and BPS Analysis by Country, 2025 and 2035
  • Figure 92: South Asia & Pacific Market Value Share and BPS Analysis by Acid Type, 2025 and 2035
  • Figure 93: South Asia & Pacific Market Y-o-Y Growth Comparison by Acid Type, 2025-2035
  • Figure 94: South Asia & Pacific Market Attractiveness Analysis by Acid Type
  • Figure 95: South Asia & Pacific Market Value Share and BPS Analysis by Form, 2025 and 2035
  • Figure 96: South Asia & Pacific Market Y-o-Y Growth Comparison by Form, 2025-2035
  • Figure 97: South Asia & Pacific Market Attractiveness Analysis by Form
  • Figure 98: South Asia & Pacific Market Value Share and BPS Analysis by Product Type, 2025 and 2035
  • Figure 99: South Asia & Pacific Market Y-o-Y Growth Comparison by Product Type, 2025-2035
  • Figure 100: South Asia & Pacific Market Attractiveness Analysis by Product Type
  • Figure 101: South Asia & Pacific Market Value Share and BPS Analysis by Livestock, 2025 and 2035
  • Figure 102: South Asia & Pacific Market Y-o-Y Growth Comparison by Livestock, 2025-2035
  • Figure 103: South Asia & Pacific Market Attractiveness Analysis by Livestock 
  • Figure 104: Middle East and Africa Market Value Share and BPS Analysis by Country, 2025 and 2035
  • Figure 105: Middle East and Africa Market Value Share and BPS Analysis by Acid Type, 2025 and 2035
  • Figure 106: Middle East and Africa Market Y-o-Y Growth Comparison by Acid Type, 2025-2035
  • Figure 107: Middle East and Africa Market Attractiveness Analysis by Acid Type
  • Figure 108: Middle East and Africa Market Value Share and BPS Analysis by Form, 2025 and 2035
  • Figure 109: Middle East and Africa Market Y-o-Y Growth Comparison by Form, 2025-2035
  • Figure 110: Middle East and Africa Market Attractiveness Analysis by Form
  • Figure 111: Middle East and Africa Market Value Share and BPS Analysis by Product Type, 2025 and 2035
  • Figure 112: Middle East and Africa Market Y-o-Y Growth Comparison by Product Type, 2025-2035
  • Figure 113: Middle East and Africa Market Attractiveness Analysis by Product Type
  • Figure 114: Middle East and Africa Market Value Share and BPS Analysis by Livestock, 2025 and 2035
  • Figure 115: Middle East and Africa Market Y-o-Y Growth Comparison by Livestock, 2025-2035
  • Figure 116: Middle East and Africa Market Attractiveness Analysis by Livestock 
  • Figure 117: Global Market - Tier Structure Analysis
  • Figure 118: Global Market - Company Share Analysis

Frequently Asked Questions

How big is the feed acidifier market in 2025?

The global feed acidifier market is estimated to be valued at USD 3.1 billion in 2025.

What will be the size of the feed acidifier market in 2035?

The feed acidifier market size is projected to reach USD 5.0 billion by 2035.

How much will be the feed acidifier market growth between 2025 and 2035?

The feed acidifier market is expected to grow at a 5% CAGR between 2025 and 2035.

Which acid type is projected to lead in the feed acidifier market in 2025?

The propionic acid segment is projected to lead the feed acidifier market with 35% market share in 2025.

Which product type segment will contribute significant share in the feed acidifier market in 2025?

In terms of product type, the blended segment will command 60% share in the feed acidifier market in 2025.

Explore Similar Insights

Future Market Insights

Feed Acidifier Market

Chat With MaRIA

Chat With

MaRIA

Hi There, I am MaRIA, Your Market Research Intelligence Assistant. How may I help you?