Reports

- Global Locations -

Headquarters

Future Market Insights, Inc.

Christiana Corporate, 200
Continental Drive, Suite 401,
Newark, Delaware - 19713,
United States

T: +1-845-579-5705

Americas

Future Market Insights, Inc.

616 Corporate Way, Suite 2-9018,
Valley Cottage, NY 10989, United States

T: +1-347-918-3531

MEA

Future Market Insights

1602-6 Jumeirah Bay X2 Tower, Plot No: JLT-PH2-X2A,
Jumeirah Lakes Towers, Dubai,
United Arab Emirates

Europe

Future Market Insights

3rd Floor, 207 Regent Street,
W1B 3HH London
United Kingdom

T: + 44 (0) 20 8123 9659
D: +44 (0) 20 3287 4268

Asia Pacific

Future Market Insights

IndiaLand Global Tech Park, Unit UG-1, Behind Grand HighStreet, Phase 1, Hinjawadi, MH, Pune – 411057, India

Feeder Containers Market Outlook (2022 to 2032)

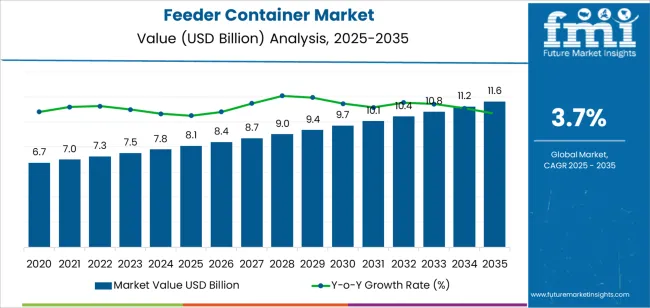
[190 Pages Report] The global feeder containers market is estimated to reach around US$ 7.8 Billion in 2022. As per the report, demand will increase at a 5.9% CAGR, with the market valuation reaching US$ 13.8 Billion by 2032.

Attribute Details
Feeder Containers Market Estimated Size (2022) US$ 7.8 Billion
Feeder Containers Market Projected Size (2032) US$ 13.8 Billion
Feeder Containers Market Value-based CAGR (2022 to 2032) 5.9%
Feeder Containers Market Collective Value Share: Top 3 Countries (2022E) 40%

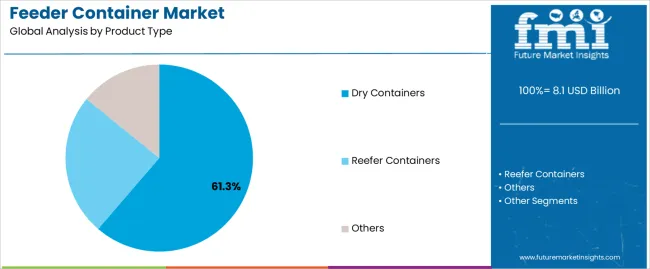
Feeder containers, also known as feeder vessels or container vessels, are frequently used in the maritime shipping and logistics industry and account for a large part of the cargo. As per FMI, demand for dry containers is expected to increase at a 4.6% CAGR during the assessment period.

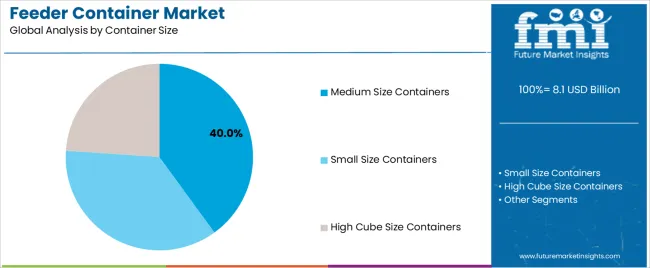
The high cube-size containers are gaining traction as they have the capacity of carrying more than 20,000 TEU. As these containers reduce the cost of shipping for the bulk volume to a certain extent, end users are considering them as an ideal option for shipping their products.

The food and beverage industry is one of the largest manufacturing sectors in Europe. As per the European Commission, in the past decade, food and beverage exports have doubled, reaching over US$ 97.1 Billion (Euro 90 Billion).

European Commission is working on enhancing the food sector which will increase trade activities with other countries. This is expected to create opportunities for growth in the market. As per FMI, sales of feeder containers in the food and beverage segment are expected to increase nearly twice by 2032.

Don't pay for what you don't need

Customize your report by selecting specific countries or regions and save 30%!

2015 to 2021 Historic Feeder Containers Market Outlook Vs 2022 to 2032 Forecast

Sales of feeder containers are slated to increase at a 5.9% CAGR over the forecast period, in comparison to the 3.5% CAGR registered between 2015 to 2021.

Optimal packaging of products is imperative in the logistics sector during exports and imports. During 2008-2010, due to the financial crisis, the demand for feeder containers grew by 1%. Since 2012, the volume of traded goods has increased in line with the GDP, which has generated exponential demand for feeder containers.

The World Trade Organization (WTO) has predicted the global merchandise trade volume to increase by 4.7% in 2022. On the back of this, the global feeder containers market will create an incremental opportunity of US$ 6.0 Billion over the forecast period.

Further, the transportation sector is emerging as a key end-user of feeder containers due to high adoption in the transportation of products from industries including oil & gas, mining, food & beverages, automotive, healthcare, and electrical and electronics.

Feeder Containers Market

What Is The Impact Of The Russia-Ukraine Conflict On The Feeder Containers Market?

Despite the positive outlook for feeder containers, some factors are influencing the sales of feeder containers such as the COVID-19 pandemic and the Ukraine-Russia war.

The war in Ukraine and Russia is putting the recovery of global trade at risk. Although the global trade volume is expected to increase by 4.7%, but it has grown by 3% till now amid the uncertainties caused by the conflict. The global merchandising trade is forecast to increase by 3.4% in 2023, amid the conflict, and the impact of the war will be reflected in the business trade across various nations.

After recovering from this conflict, the export and import of consumer goods, FMCG products, and many others are expected to recover, and the need for feeder containers for transporting these goods will increase.

Ismail Sutaria
Ismail Sutaria

Principal Consultant

Talk to Analyst

Find your sweet spots for generating winning opportunities in this market.

Which Factors Are Boosting Growth In The Feeder Containers Market?

The ongoing expansion of the food & beverages sector in various countries, along with rising demand from the e-commerce sector is boosting the requirement for feeder containers for the transportation of goods in this sector.

Growing adoption of effective containers, the use of low-emission and greener fuels, and the introduction of smart containers are expected to spur demand for feeder containers. By using these containers, shippers are making the best use of available spaces. It saves time and money and offers greater handling and protection.

Further, the surging adoption of smart containers will bode well for the growth in the market. These containers use technologies such as IoT devices, sensors, and GPS to improve security and track location and product contamination while transiting. the aforementioned factors are expected to continue pushing sales in the market over the forecast period.

Besides this, these containers are cost-effective, reduce transportation costs and provide safety and security for a wide range of goods, foods, and machinery.

Bulk materials and food & beverage goods are best stored in feeder containers. Increasing client inclination toward environmental conservation consciousness is spurring demand in the market. These containers are widely being adopted for the transportation of oil & gas, healthcare, and electric products. The usage of eco-friendly fuel solutions is gaining popularity in the container industry, thereby making feeder containers a viable option.

Country-Wise Insights

How Will the USA Feeder Containers Market Fare?

Surging Demand from the Food & Beverage Sector in the USA Will Boost Feeder Containers Sales

Total sales in the USA feeder containers market are projected to account for 87.9% of the North America feeder containers market during the forecast period. The adoption of feeder containers is expected to be driven by the presence of a robust food & beverage sector in the country, along with increasing international trade activities for pharmaceutical and personal care products.

What is Driving the China Feeder Containers Market?

Expansion of the e-Commerce Sector in China To Spur Demand for Feeder Containers

According to the UNITED NATIONS CONFERENCE ON TRADE AND DEVELOPMENT (UNCTAD), growth in the bauxite trade and oil & gas trade is expected to drive sales of feeder containers. Bauxite trade in the country increased by 8.2% and accounts for 77% of the total bauxite supply.

As of January 2021, China is in the top 3 countries among all 25 ship-owning countries. China's shipping industry is expected to generate a total of US$ 98,936 Million, in which bulk carriers trade accounts for 35% of the total revenue.

Driven by this, the feeder containers market in China is projected to hold 54.3% of the total East Asia feeder containers market during the forecast period.

Get the data you need at a Fraction of the cost

Personalize your report by choosing insights you need
and save 40%!

Category-Wise Insights

Which is the Most Preferred Feeder Containers Type?

Demand for Dry Feeder Containers Will Gain Momentum

Based on product type, sales of dry feeder containers will increase at a 4.6% CAGR over the assessment period. Surging demand for these feeder containers from the food & beverage and oil & gas sectors will continue pushing sales in this segment over the forecast period.

How Food & Beverages Sector Fueling Demand for Feeder Containers?

Sales of Feeder Containers for Packaging Processed Food Products to Remain High

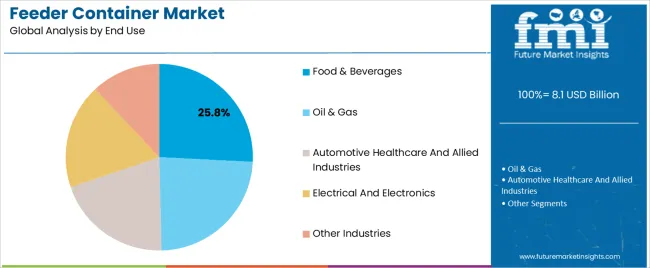
In terms of end use, demand in the food & beverage sector is expected to gain traction over the forecast period on the back of an increasing preference for cost-effective and flexible packaging solutions.

The food & beverage segment is expected to offer a total incremental opportunity of US$ 1.4 Billion, with sales growing 1.7x by 2032.

Competitive Landscape

Leading companies operating in the global feeder containers market are seeking to increase their global reach, diversify their product offering, and accelerate their development processes to improve sales.

For instance:

  • In September 2021, CMA CGM, a shipment giant, announced an agreement for 35 years with Abu Dhabi Ports in the view of developing a new terminal which is valued at US$ 154 million. This terminal will be helping the feeder operators and the shipping companies to provide their services between South Asia and Abu Dhabi, Europe, and Western Asia.
  • In March 2022, Hapag-Lloyd has acquired a Deutsche Afrika-Linien (DAL), which is a container liner business specialist in Africa.

Scope Of Report

Attribute Details
Forecast Period 2022 to 2032
Historical Data Available for 2015 to 2021
Market Analysis US$ Million for Value and Units for Volume
Key Regions Covered North America, Latin America, Europe, East Asia, South Asia, Middle East & Africa, Oceania
Key Countries Covered The USA, Canada, Brazil, Mexico, Germany, Spain, Italy, France, the UK, Russia, Poland, China, India, Japan, Australia, New Zealand, GCC Countries, Turkey, North Africa, and South Africa
Key Segments Covered Product Type, Container Size, End Use, and Region
Key Companies Profiled
  • Maersk group
  • Mediterranean Shipping Company
  • China COSCO Shipping
  • Hapag Lloyd
  • Orient Overseas container line
  • Hamburg Sud
  • NYK line
  • Mitsui O.S.K lines
  • Pacific International line
  • K line
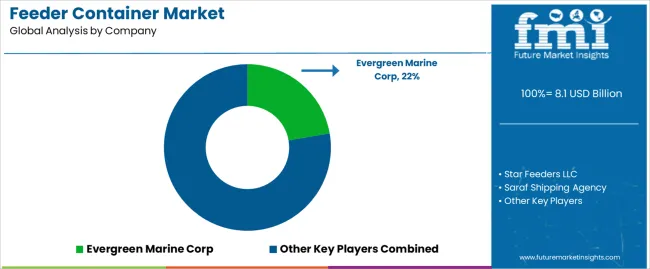
  • Evergreen Marine Corp
  • Star Feeders
  • Saraf Shipping Agency
  • Global Feeder Shipping
  • Bahri
  • Gulftainer
  • Hapag-Lloyd AG
  • Mediterranean Shipping Company
  • AP Moller Maersk
  • X-Press Feeders
  • Orient Overseas Container Line Limited
  • Safeen Feeders (Abu Dhabi Ports)
  • FeederTech (Unifeeder Group)
  • CMA CGM Group
  • PIL (UAE) LLC
  • COSCO Shipping Lines
  • HMM, Co. Ltd.
Report Coverage Market Forecast, Company Share Analysis, Competition Intelligence, Drivers, Restraints, Opportunities and Threats Analysis, Market Dynamics and Challenges, and Consumer Awareness.
Customization & Pricing Available upon Request

Feeder Containers Market By Category

By Product Type:

  • Dry Containers
  • Reefer Containers
  • Others

By Container Size:

  • Small Size Containers
  • Medium Size Containers
  • High Cube Size Containers

By End Use:

  • Oil, Gas, and Mining
  • Food & Beverages
  • Automotive
  • Healthcare
  • Electrical and Electronics
  • Other Industries

By Region:

  • North America
  • Latin America
  • Europe
  • East Asia
  • South Asia
  • Middle East and Africa (MEA)
  • Oceania

Frequently Asked Questions

How much is the global feeder containers market currently worth?

The global feeder containers market is expected to reach US$ 7.7 Billion in 2022.

At what rate did the demand for feeder containers grow between 205 to 2021?

The global feeder containers market registered a CAGR of 3.5% from 2015 to 2021.

At what CAGR is the market projected to expand during the forecast period (2022 to 2032)?

The global feeder containers market is forecasted to expand at a CAGR of 5.9% over the forecast period.

What is the major factor augmenting the sales of feeder containers?

Growth in the global feeder containers market is expected to be fuelled by increasing demand from end-use sectors such as food & beverages, oil & gas, and mining.

At what rate will the India Feeder Containers Market grow?

As per FMI analysis, the India feeder containers market is estimated to expand at a CAGR of 7.1% between 2022 and 2032.

Table of Content

1. Executive Summary | Feeder Containers Market

    1.1. Global Market Outlook

    1.2. Demand Side Trends

    1.3. Supply Side Trends

    1.4. Analysis and Recommendations

2. Market Overview

    2.1. Market Coverage / Taxonomy

    2.2. Market Definition / Scope / Limitations

3. Key Market Trends

    3.1. Key Trends Impacting the Market

    3.2. Product Innovation / Development Trends

4. Key Success Factors

    4.1. Product Adoption /Usage Analysis

    4.2. Product USPs / Features

    4.3. Strategic Promotional Strategies

5. Global Market Demand Analysis 2015 to 2021 and Forecast, 2022 to 2032

    5.1. Historical Market Volume (Units) Analysis, 2015 to 2021

    5.2. Current and Future Market Volume (Units) Analysis Projections, 2022 to 2032

    5.3. Y-o-Y Growth Trend Analysis

6. Markets- Pricing Analysis

    6.1. Regional Pricing Analysis by Product Type

    6.2. Global Average Pricing Analysis Benchmark

7. Markets Demand (Value in US$ Million) Analysis 2015 to 2021 and Forecast, 2022 to 2032

    7.1. Historical Market Value (US$ Million) Analysis, 2015 to 2021

    7.2. Current and Future Market Value (US$ Million) Analysis Projections, 2022 to 2032

        7.2.1. Y-o-Y Growth Trend Analysis

        7.2.2. Absolute $ Opportunity Analysis

8. Market Background

    8.1. Global Packaging Market Overview

    8.2. Global Rigid Packaging Market Overview

    8.3. Global Food & Beverages Market Overview

    8.4. Global Oil and Gas Market Outlook

    8.5. Macro-Economic Factors

        8.5.1. Global GDP Growth Outlook

        8.5.2. Oil, Gas, & Mining Growth

        8.5.3. Healthcare Product Outlook

    8.6. Forecast Factors - Relevance & Impact

        8.6.1. Packaging Industry Growth

        8.6.2. Pharmaceutical Packaging Market Growth

        8.6.3. Segmental Revenue Growth, by Key Players

    8.7. Value Chain Analysis

        8.7.1. Key Market Participants

            8.7.1.1. Raw Material Suppliers

            8.7.1.2. Market Converters / Manufacturers

            8.7.1.3. End-use

    8.8. Market Dynamics

        8.8.1. Drivers

        8.8.2. Restraints

        8.8.3. Opportunity Analysis

    8.9. Global Supply Demand Analysis

9. Impact of COVID-19 

    9.1. Current Statistics and Probable Future Impact

    9.2. Impact of COVID-19 on the Market

10. Global Market Analysis 2015 to 2021 and Forecast 2022 to 2032, By Product Type

    10.1. Introduction / Key Findings

    10.2. Historical Market Size (US$ Million) Analysis and Volume (Units) Analysis, by Product Type, 2015 to 2021

    10.3. Current and Future Market Size (US$ Million) Analysis and Volume (Units) Analysis and Forecast, by Product Type 2022 to 2032

        10.3.1. Dry Containers

        10.3.2. Reefer Containers

        10.3.3. Others

    10.4. Market Attractiveness Analysis, by Product Type

11. Global Market Analysis 2015 to 2021 and Forecast 2022 to 2032, By Container Size

    11.1. Introduction / Key Findings

    11.2. Historical Market Size (US$ Million) Analysis and Volume (Units) Analysis, By Container Size, 2015 to 2021

    11.3. Current and Future Market Size (US$ Million) Analysis and Volume (Units) Analysis and Forecast, By Container Size,2022 to 2032

        11.3.1. Small Size Containers

        11.3.2. Medium Size Containers

        11.3.3. High Cube Size Containers

    11.4. Market Attractiveness Analysis, By Container Size

12. Global Market Analysis 2015 to 2021 and Forecast 2022 to 2032, By End Use

    12.1. Introduction / Key Findings

    12.2. Historical Market Size (US$ Million) Analysis and Volume (Units) Analysis by End Use, 2015 to 2021

    12.3. Current and Future Market Size (US$ Million) Analysis and Volume (Units) Analysis and Forecast by End Use, 2022 to 2032

        12.3.1. Oil, Gas, & Mining

        12.3.2. Food and Beverages

        12.3.3. Automotive

        12.3.4. Healthcare

        12.3.5. Electrical and Electronics

        12.3.6. Other Industries

    12.4. Market Attractiveness Analysis by End Use

13. Global Market Analysis 2015 to 2021 and Forecast 2022 to 2032, By Region

    13.1. Introduction / Key Findings

    13.2. Historical Market Size (US$ Million) Analysis and Volume (Units) Analysis, by Region, 2015 to 2021

    13.3. Current and Future Market Size (US$ Million) Analysis and Volume (Units) Analysis and Forecast, by Region, 2022 to 2032

        13.3.1. North America

        13.3.2. Latin America

        13.3.3. Europe

        13.3.4. East Asia

        13.3.5. South Asia

        13.3.6. Middle East and Africa (MEA)

        13.3.7. Oceania

    13.4. Market Attractiveness Analysis, by Region

14. North America Market Analysis 2015 to 2021 and Forecast 2022 to 2032

    14.1. Introduction / Key Findings

    14.2. Historical Market Size (US$ Million) Analysis and Volume (Units) Analysis, by Market Taxonomy, 2015 to 2021

    14.3. Current Market Size (US$ Million) Analysis and Volume (Units) Analysis Forecast, by Market Taxonomy, 2022 to 2032

        14.3.1. By Country

            14.3.1.1. United States of America

            14.3.1.2. Canada

        14.3.2. By Product Type

        14.3.3. By Container Size

        14.3.4. By End Use

    14.4. Market Attractiveness Analysis

        14.4.1. By Country

        14.4.2. By Product Type

        14.4.3. By Container Size

        14.4.4. By End Use

15. Latin America Market Analysis 2015 to 2021 and Forecast 2022 to 2032

    15.1. Introduction / Key Findings

    15.2. Historical Market Size (US$ Million) Analysis and Volume (Units) Analysis, by Market Taxonomy, 2015 to 2021

    15.3. Current Market Size (US$ Million) Analysis and Volume (Units) Analysis Forecast, by Market Taxonomy, 2022 to 2032

        15.3.1. By Country

            15.3.1.1. Brazil

            15.3.1.2. Mexico

            15.3.1.3. Argentina

            15.3.1.4. Rest of Latin America

        15.3.2. By Product Type

        15.3.3. By Container Size

        15.3.4. By End Use

    15.4. Market Attractiveness Analysis

        15.4.1. By Country

        15.4.2. By Product Type

        15.4.3. By Container Size

        15.4.4. By End Use

16. Europe Market Analysis 2015 to 2021 and Forecast 2022 to 2032

    16.1. Introduction / Key Findings

    16.2. Historical Market Size (US$ Million) Analysis and Volume (Units) Analysis, by Market Taxonomy, 2015 to 2021

    16.3. Current Market Size (US$ Million) Analysis and Volume (Units) Analysis Forecast, by Market Taxonomy, 2022 to 2032

        16.3.1. By Country

            16.3.1.1. Germany

            16.3.1.2. Italy

            16.3.1.3. France

            16.3.1.4. United Kingdom

            16.3.1.5. Spain

            16.3.1.6. Russia

            16.3.1.7. Benelux

            16.3.1.8. Nordic

            16.3.1.9. Poland

            16.3.1.10. Rest of Europe

        16.3.2. By Product Type

        16.3.3. By Container Size

        16.3.4. By End Use

    16.4. Market Attractiveness Analysis

        16.4.1. By Country

        16.4.2. By Product Type

        16.4.3. By Container Size

        16.4.4. By End Use

17. East Asia Market Analysis 2015 to 2021 and Forecast 2022 to 2032

    17.1. Introduction / Key Findings

    17.2. Historical Market Size (US$ Million) Analysis and Volume (Units) Analysis, by Market Taxonomy, 2015 to 2021

    17.3. Current Market Size (US$ Million) Analysis and Volume (Units) Analysis Forecast, by Market Taxonomy, 2022 to 2032

        17.3.1. By Country

            17.3.1.1. China

            17.3.1.2. Japan

            17.3.1.3. South Korea

        17.3.2. By Product Type

        17.3.3. By Container Size

        17.3.4. By End Use

    17.4. Market Attractiveness Analysis

        17.4.1. By Country

        17.4.2. By Product Type

        17.4.3. By Container Size

        17.4.4. By End Use

18. South Asia Market Analysis 2015 to 2021 and Forecast 2022 to 2032

    18.1. Introduction / Key Findings

    18.2. Historical Market Size (US$ Million) Analysis and Volume (Units) Analysis, by Market Taxonomy, 2015 to 2021

    18.3. Current Market Size (US$ Million) Analysis and Volume (Units) Analysis Forecast, by Market Taxonomy, 2022 to 2032

        18.3.1. By Country

            18.3.1.1. India

            18.3.1.2. Thailand

            18.3.1.3. Indonesia

            18.3.1.4. Malaysia

            18.3.1.5. Rest of South Asia

        18.3.2. By Product Type

        18.3.3. By Container Size

        18.3.4. By End Use

    18.4. Market Attractiveness Analysis

        18.4.1. By Country

        18.4.2. By Product Type

        18.4.3. By Container Size

        18.4.4. By End Use

19. Middle East and Africa Market Analysis 2015 to 2021 and Forecast 2022 to 2032

    19.1. Introduction / Key Findings

    19.2. Historical Market Size (US$ Million) Analysis and Volume (Units) Analysis, by Market Taxonomy, 2015 to 2021

    19.3. Current Market Size (US$ Million) Analysis and Volume (Units) Analysis Forecast, by Market Taxonomy, 2022 to 2032

        19.3.1. By Country

            19.3.1.1. GCC Countries

            19.3.1.2. Turkey

            19.3.1.3. South Africa

            19.3.1.4. Northern Africa

            19.3.1.5. Rest of Middle East and Africa

        19.3.2. By Product Type

        19.3.3. By Container Size

        19.3.4. By End Use

    19.4. Market Attractiveness Analysis

        19.4.1. By Country

        19.4.2. By Product Type

        19.4.3. By Container Size

        19.4.4. By End Use

20. Oceania Market Analysis 2015 to 2021 and Forecast 2022 to 2032

    20.1. Introduction / Key Findings

    20.2. Historical Market Size (US$ Million) Analysis and Volume (Units) Analysis, by Market Taxonomy, 2015 to 2021

    20.3. Current Market Size (US$ Million) Analysis and Volume (Units) Analysis Forecast, by Market Taxonomy, 2022 to 2032

        20.3.1. By Country

            20.3.1.1. Australia

            20.3.1.2. New Zealand

        20.3.2. By Product Type

        20.3.3. By Container Size

        20.3.4. By End Use

    20.4. Market Attractiveness Analysis

        20.4.1. By Country

        20.4.2. By Product Type

        20.4.3. By Container Size

        20.4.4. By End Use

21. Global Country-wise Market Analysis, 2022 to 2032

    21.1. USA Market Analysis

        21.1.1. By Product Type

        21.1.2. By Container Size

        21.1.3. By End Use

    21.2. Canada Market Analysis

        21.2.1. By Product Type

        21.2.2. By Container Size

        21.2.3. By End Use

    21.3. Germany Market Analysis

        21.3.1. By Product Type

        21.3.2. By Container Size

        21.3.3. By End Use

    21.4. Italy Market Analysis

        21.4.1. By Product Type

        21.4.2. By Container Size

        21.4.3. By End Use

    21.5. France Market Analysis

        21.5.1. BY Product Type

        21.5.2. By Container Size

        21.5.3. By End Use

    21.6. UK Market Analysis

        21.6.1. By Product Type

        21.6.2. By Container Size

        21.6.3. By End Use

    21.7. Spain Market Analysis

        21.7.1. By Product Type

        21.7.2. By Container Size

        21.7.3. By End Use

    21.8. Russia Market Analysis

        21.8.1. By Product Type

        21.8.2. By Container Size

        21.8.3. By End Use

    21.9. Poland Market Analysis

        21.9.1. By Product Type

        21.9.2. By Container Size

        21.9.3. By End Use

    21.10. Turkey Market Analysis

        21.10.1. By Product Type

        21.10.2. By Container Size

        21.10.3. By End Use

    21.11. Brazil Market Analysis

        21.11.1. By Product Type

        21.11.2. By Container Size

        21.11.3. By End Use

    21.12. Mexico Market Analysis

        21.12.1. By Product Type

        21.12.2. By Container Size

        21.12.3. By End Use

    21.13. Japan Market Analysis

        21.13.1. By Product Type

        21.13.2. By Container Size

        21.13.3. By End Use

    21.14. India Market Analysis

        21.14.1. By Product Type

        21.14.2. By Container Sizes

        21.14.3. By End Use

    21.15. China Market Analysis

        21.15.1. By Product Type

        21.15.2. By Container Size

        21.15.3. By End Use

22. Market Structure Analysis

    22.1. Market Analysis, by Tier of Companies (Market)

    22.2. Market Share Analysis of Top Players

    22.3. Market Presence Analysis

23. Competition Analysis

    23.1. Competition Dashboard

    23.2. Competition Benchmarking

    23.3. Competition Deep Dive

        23.3.1. Maersk group

            23.3.1.1. Overview

            23.3.1.2. Product Portfolio

            23.3.1.3. Profitability by Market Segments (Product/Channel/ Region)

            23.3.1.4. Sales Footprint

            23.3.1.5. Strategy Overview

                23.3.1.5.1. Marketing Strategy

                23.3.1.5.2. Product Strategy

                23.3.1.5.3. Channel Strategy

        23.3.2. Mediterranean Shipping Company

            23.3.2.1. Overview

            23.3.2.2. Product Portfolio

            23.3.2.3. Profitability by Market Segments (Product/Channel/ Region)

            23.3.2.4. Sales Footprint

            23.3.2.5. Strategy Overview

                23.3.2.5.1. Marketing Strategy

                23.3.2.5.2. Product Strategy

                23.3.2.5.3. Channel Strategy

        23.3.3. China COSCO Shipping

            23.3.3.1. Overview

            23.3.3.2. Product Portfolio

            23.3.3.3. Profitability by Market Segments (Product/Channel/ Region)

            23.3.3.4. Sales Footprint

            23.3.3.5. Strategy Overview

                23.3.3.5.1. Marketing Strategy

                23.3.3.5.2. Product Strategy

                23.3.3.5.3. Channel Strategy

        23.3.4. Hapag Lloyd

            23.3.4.1. Overview

            23.3.4.2. Product Portfolio

            23.3.4.3. Profitability by Market Segments (Product/Channel/ Region)

            23.3.4.4. Sales Footprint

            23.3.4.5. Strategy Overview

                23.3.4.5.1. Marketing Strategy

                23.3.4.5.2. Product Strategy

                23.3.4.5.3. Channel Strategy

        23.3.5. Orient Overseas container line

            23.3.5.1. Overview

            23.3.5.2. Product Portfolio

            23.3.5.3. Profitability by Market Segments (Product/Channel/ Region)

            23.3.5.4. Sales Footprint

            23.3.5.5. Strategy Overview

                23.3.5.5.1. Marketing Strategy

                23.3.5.5.2. Product Strategy

                23.3.5.5.3. Channel Strategy

        23.3.6. Hamburg Sud

            23.3.6.1. Overview

            23.3.6.2. Product Portfolio

            23.3.6.3. Profitability by Market Segments (Product/Channel/ Region)

            23.3.6.4. Sales Footprint

            23.3.6.5. Strategy Overview

                23.3.6.5.1. Marketing Strategy

                23.3.6.5.2. Product Strategy

                23.3.6.5.3. Channel Strategy

        23.3.7. NYK line

            23.3.7.1. Overview

            23.3.7.2. Product Portfolio

            23.3.7.3. Profitability by Market Segments (Product/Channel/ Region)

            23.3.7.4. Sales Footprint

            23.3.7.5. Strategy Overview

                23.3.7.5.1. Marketing Strategy

                23.3.7.5.2. Product Strategy

                23.3.7.5.3. Channel Strategy

        23.3.8. Mitsui O.S.K lines

            23.3.8.1. Overview

            23.3.8.2. Product Portfolio

            23.3.8.3. Profitability by Market Segments (Product/Channel/ Region)

            23.3.8.4. Sales Footprint

            23.3.8.5. Strategy Overview

                23.3.8.5.1. Marketing Strategy

                23.3.8.5.2. Product Strategy

                23.3.8.5.3. Channel Strategy

        23.3.9. Pacific International line

            23.3.9.1. Overview

            23.3.9.2. Product Portfolio

            23.3.9.3. Profitability by Market Segments (Product/Channel/ Region)

            23.3.9.4. Sales Footprint

            23.3.9.5. Strategy Overview

                23.3.9.5.1. Marketing Strategy

                23.3.9.5.2. Product Strategy

                23.3.9.5.3. Channel Strategy

        23.3.10. K line

            23.3.10.1. Overview

            23.3.10.2. Product Portfolio

            23.3.10.3. Profitability by Market Segments (Product/Channel/ Region)

            23.3.10.4. Sales Footprint

            23.3.10.5. Strategy Overview

                23.3.10.5.1. Marketing Strategy

                23.3.10.5.2. Product Strategy

                23.3.10.5.3. Channel Strategy

        23.3.11. Evergreen Marine Corp

            23.3.11.1. Overview

            23.3.11.2. Product Portfolio

            23.3.11.3. Profitability by Market Segments (Product/Channel/ Region)

            23.3.11.4. Sales Footprint

            23.3.11.5. Strategy Overview

                23.3.11.5.1. Marketing Strategy

                23.3.11.5.2. Product Strategy

                23.3.11.5.3. Channel Strategy

        23.3.12. Star Feeders

            23.3.12.1. Overview

            23.3.12.2. Product Portfolio

            23.3.12.3. Profitability by Market Segments (Product/Channel/ Region)

            23.3.12.4. Sales Footprint

            23.3.12.5. Strategy Overview

                23.3.12.5.1. Marketing Strategy

                23.3.12.5.2. Product Strategy

                23.3.12.5.3. Channel Strategy

        23.3.13. Saraf Shipping Agency

            23.3.13.1. Overview

            23.3.13.2. Product Portfolio

            23.3.13.3. Profitability by Market Segments (Product/Channel/ Region)

            23.3.13.4. Sales Footprint

            23.3.13.5. Strategy Overview

                23.3.13.5.1. Marketing Strategy

                23.3.13.5.2. Product Strategy

                23.3.13.5.3. Channel Strategy

        23.3.14. Global Feeder Shipping

            23.3.14.1. Overview

            23.3.14.2. Product Portfolio

            23.3.14.3. Profitability by Market Segments (Product/Channel/ Region)

            23.3.14.4. Sales Footprint

            23.3.14.5. Strategy Overview

                23.3.14.5.1. Marketing Strategy

                23.3.14.5.2. Product Strategy

                23.3.14.5.3. Channel Strategy

        23.3.15. Bahri

            23.3.15.1. Overview

            23.3.15.2. Product Portfolio

            23.3.15.3. Profitability by Market Segments (Product/Channel/ Region)

            23.3.15.4. Sales Footprint

            23.3.15.5. Strategy Overview

                23.3.15.5.1. Marketing Strategy

                23.3.15.5.2. Product Strategy

                23.3.15.5.3. Channel Strategy

        23.3.16. Gulftainer

            23.3.16.1. Overview

            23.3.16.2. Product Portfolio

            23.3.16.3. Profitability by Market Segments (Product/Channel/ Region)

            23.3.16.4. Sales Footprint

            23.3.16.5. Strategy Overview

                23.3.16.5.1. Marketing Strategy

                23.3.16.5.2. Product Strategy

                23.3.16.5.3. Channel Strategy

        23.3.17. Hapag-Lloyd AG

            23.3.17.1. Overview

            23.3.17.2. Product Portfolio

            23.3.17.3. Profitability by Market Segments (Product/Channel/ Region)

            23.3.17.4. Sales Footprint

            23.3.17.5. Strategy Overview

                23.3.17.5.1. Marketing Strategy

                23.3.17.5.2. Product Strategy

                23.3.17.5.3. Channel Strategy

        23.3.18. Mediterranean Shipping Company

            23.3.18.1. Overview

            23.3.18.2. Product Portfolio

            23.3.18.3. Profitability by Market Segments (Product/Channel/ Region)

            23.3.18.4. Sales Footprint

            23.3.18.5. Strategy Overview

                23.3.18.5.1. Marketing Strategy

                23.3.18.5.2. Product Strategy

                23.3.18.5.3. Channel Strategy

        23.3.19. AP Moller Maersk

            23.3.19.1. Overview

            23.3.19.2. Product Portfolio

            23.3.19.3. Profitability by Market Segments (Product/Channel/ Region)

            23.3.19.4. Sales Footprint

            23.3.19.5. Strategy Overview

                23.3.19.5.1. Marketing Strategy

                23.3.19.5.2. Product Strategy

                23.3.19.5.3. Channel Strategy

        23.3.20. X-Press Feeders

            23.3.20.1. Overview

            23.3.20.2. Product Portfolio

            23.3.20.3. Profitability by Market Segments (Product/Channel/ Region)

            23.3.20.4. Sales Footprint

            23.3.20.5. Strategy Overview

                23.3.20.5.1. Marketing Strategy

                23.3.20.5.2. Product Strategy

                23.3.20.5.3. Channel Strategy

        23.3.21. Orient Overseas Container Line Limited

            23.3.21.1. Overview

            23.3.21.2. Product Portfolio

            23.3.21.3. Profitability by Market Segments (Product/Channel/ Region)

            23.3.21.4. Sales Footprint

            23.3.21.5. Strategy Overview

                23.3.21.5.1. Marketing Strategy

                23.3.21.5.2. Product Strategy

                23.3.21.5.3. Channel Strategy

        23.3.22. Safeen Feeders (Abu Dhabi Ports)

            23.3.22.1. Overview

            23.3.22.2. Product Portfolio

            23.3.22.3. Profitability by Market Segments (Product/Channel/ Region)

            23.3.22.4. Sales Footprint

            23.3.22.5. Strategy Overview

                23.3.22.5.1. Marketing Strategy

                23.3.22.5.2. Product Strategy

                23.3.22.5.3. Channel Strategy

        23.3.23. FeederTech (Unifeeder Group)

            23.3.23.1. Overview

            23.3.23.2. Product Portfolio

            23.3.23.3. Profitability by Market Segments (Product/Channel/ Region)

            23.3.23.4. Sales Footprint

            23.3.23.5. Strategy Overview

                23.3.23.5.1. Marketing Strategy

                23.3.23.5.2. Product Strategy

                23.3.23.5.3. Channel Strategy

        23.3.24. CMA CGM Group

            23.3.24.1. Overview

            23.3.24.2. Product Portfolio

            23.3.24.3. Profitability by Market Segments (Product/Channel/ Region)

            23.3.24.4. Sales Footprint

            23.3.24.5. Strategy Overview

                23.3.24.5.1. Marketing Strategy

                23.3.24.5.2. Product Strategy

                23.3.24.5.3. Channel Strategy

        23.3.25. PIL (UAE) LLC

            23.3.25.1. Overview

            23.3.25.2. Product Portfolio

            23.3.25.3. Profitability by Market Segments (Product/Channel/ Region)

            23.3.25.4. Sales Footprint

            23.3.25.5. Strategy Overview

                23.3.25.5.1. Marketing Strategy

                23.3.25.5.2. Product Strategy

                23.3.25.5.3. Channel Strategy

        23.3.26. COSCO Shipping Lines

            23.3.26.1. Overview

            23.3.26.2. Product Portfolio

            23.3.26.3. Profitability by Market Segments (Product/Channel/ Region)

            23.3.26.4. Sales Footprint

            23.3.26.5. Strategy Overview

                23.3.26.5.1. Marketing Strategy

                23.3.26.5.2. Product Strategy

                23.3.26.5.3. Channel Strategy

        23.3.27. HMM, Co. Ltd.

            23.3.27.1. Overview

            23.3.27.2. Product Portfolio

            23.3.27.3. Profitability by Market Segments (Product/Channel/ Region)

            23.3.27.4. Sales Footprint

            23.3.27.5. Strategy Overview

                23.3.27.5.1. Marketing Strategy

                23.3.27.5.2. Product Strategy

                23.3.27.5.3. Channel Strategy

            23.3.27.6. *The above list is indicative in nature and is subject to change during the course of research

24. Assumptions and Acronyms Used

25. Research Methodology

List of Tables

Table 01: Global Market Value (US$ Million) Analysis, by Region, 2015(H) to 2032(F)

Table 02: Global Market Volume (Units) Analysis, by Region, 2015(H) to 2032(F)

Table 03: Global Market Value (US$ Million) Analysis, by Product Type, 2015(H) to 2032(F)

Table 04: Global Market Volume (Units) Analysis, by Product Type, 2015(H) to 2032(F)

Table 05: Global Market Value (US$ Million) Analysis, By Container Size, 2015(H) to 2032(F)

Table 06: Global Market Volume (Units) Analysis, By Container Size, 2015(H) to 2032(F)

Table 07: Global Market Value (US$ Million) Analysis, by End Use, 2015(H) to 2032(F)

Table 08: Global Market Volume (Units) Analysis, by End Use, 2015(H) to 2032(F)

Table 09: North America Market Value (US$ Million) Analysis, by Country, 2015(H) to 2032(F)

Table 10: North America Market Volume (Units) Analysis, by Country, 2015(H) to 2032(F)

Table 11: North America Market Value (US$ Million) Analysis, by Product Type, 2015(H) to 2032(F)

Table 12: North America Market Volume (Units) Analysis, by Product Type. 2015(H) to 2032(F)

Table 13: North America Market Value (US$ Million) Analysis, By Container Size, 2015(H) to 2032(F)

Table 14: North America Market Volume (Units) Analysis, By Container Size 2015(H) to 2032(F)

Table 15: North America Market Value (US$ Million) Analysis, by End Use 2015(H) to 2032(F)

Table 16: North America Market Volume (Units) Analysis, by End Use 2015(H) to 2032(F)

Table 17: Latin America Market Value (US$ Million) Analysis, by Country, 2015(H) to 2032(F)

Table 18: Latin America Market Volume (Units) Analysis, by Country, 2015(H) to 2032(F)

Table 19: Latin America Market Value (US$ Million) Analysis, by Product Type, 2015(H) to 2032(F)

Table 20: Latin America Market Volume (Units) Analysis, by Product Type 2015(H) to 2032(F)

Table 21: Latin America Market Value (US$ Million) Analysis, By Container Size, 2015(H) to 2032(F)

Table 22: Latin America Market Volume (Units) Analysis, By Container Size, 2015(H) to 2032(F)

Table 23: Latin America Market Value (US$ Million) Analysis, by End Use, 2015(H) to 2032(F)

Table 24: Latin America Market Volume (Units) Analysis, by End Use, 2015(H) to 2032(F)

Table 25: Europe Market Value (US$ Million) Analysis, by Country 2015(H) to 2032(F)

Table 26: Europe Market Volume (Units) Analysis, by Country 2015(H) to 2032(F)

Table 27: Europe Market Value (US$ Million) Analysis, by Product Type 2015(H) to 2032(F)

Table 28: Europe Market Volume (Units) Analysis, by Product Type 2015(H) to 2032

Table 29: Europe Market Volume (Units) Analysis, By Container Size 2015(H) to 2032

Table 30: Europe Market Value (US$ Million) Analysis, By Container Size 2015(H) to 2032(F)

Table 31: Europe Market Volume (Units) Analysis, by End Use 2015(H) to 2032

Table 32: Europe Market Volume (Units) Analysis, by End Use 2015(H) to 2032

Table 33: East Asia Market Value (US$ Million) Analysis, by Country 2015(H) to 2032(F)

Table 34: East Asia Market Volume (Units) Analysis, by Country 2015(H) to 2032(F)

Table 35: East Asia Market Value (US$ Million) Analysis, by Product Type 2015(H) to 2032(F

Table 36: East Asia Market Volume (Units) Analysis, by Product Type 2015(H) to 2032(F)

Table 37: East Asia Market Value (US$ Million) Analysis, By Container Size 2015(H) to 2032(F)

Table 38: East Asia Market Volume (Units) Analysis, By Container Size 2015(H) to 2032(F)

Table 39: East Asia Market Value (US$ Million) Analysis, by End Use 2015(H) to 2032(F

Table 40: East Asia Market Volume (Units) Analysis, by End Use 2015(H) to 2032(F)

Table 41: South Asia Market Value (US$ Million) Analysis, by Country 2015(H) to 2032(F)

Table 42: South Asia Market Volume (Units) Analysis, by Country 2015(H) to 2032(F)

Table 43: South Asia Market Value (US$ Million) Analysis, by Product Type 2015(H) to 2032(F

Table 44: South Asia Market Volume (Units) Analysis, by Product Type 2015(H) to 2032(F)

Table 45: South Asia Market Value (US$ Million) Analysis, By Container Size 2015(H) to 2032(F)

Table 46: South Asia Market Volume (Units) Analysis, By Container Size 2015(H) to 2032(F)

Table 47: South Asia Market Value (US$ Million) Analysis, by End Use 2015(H) to 2032(F

Table 48: South Asia Market Volume (Units) Analysis, by End Use 2015(H) to 2032(F)

Table 49: MEA Market Value (US$ Million) Analysis, by End Country 2015(H) to 2032(F)

Table 50: MEA Market Volume (Units) Analysis, by Country 2015(H) to 2032(F)

Table 51: MEA Market Value (US$ Million) Analysis, by Product Type 2015(H) to 2032(F)

Table 52: MEA Market Volume (Units) Analysis, by Product Type 2015(H) to 2032(F)

Table 53: MEA Market Value (US$ Million) Analysis, By Container Size 2015(H) to 2032(F)

Table 54: MEA Market Volume (Units) Analysis, By Container Size 2015(H) to 2032(F)

Table 55: MEA Market Value (US$ Million) Analysis, by End Use 2015(H) to 2032(F)

Table 56 MEA Market Volume (Units) Analysis, by End Use 2015(H) to 2032(F)

Table 57: USA Market Analysis by Product Type, Container Size, and End Use.

Table 58: Canada Market Analysis by Product Type, Container Size, and End Use.

Table 59: Italy Market Analysis by Product Type, Container Size, and End Use.

Table 60: France Market Analysis by Product Type, Container Size, and End Use.

Table 61: United Kingdom Market Analysis by Product Type, Container Size, and End Use.

Table 62: Spain Market Analysis by Product Type, Container Size, and End Use.

Table 63: Pol, and Market Analysis by Product Type, Container Size, and End Use.

Table 64: China Market Analysis by Product Type, Container Size, and End Use.

Table 65: Japan Market Analysis by Product Type, Container Size, and End Use.

Table 66: South Africa Market Analysis by Product Type, Container Size, and End Use.

Table 67: GCC Countries Market Analysis by Product Type, Container Size, and End Use.

Table 68: Turkey Market Analysis by Product Type, Container Size, and End Use.

Table 69: North Africa Market Analysis by Product Type, Container Size, and End Use.

Table 70: India Market Analysis by Product Type, Container Size, and End Use.

Table 71: Australia Market Analysis by Product Type, Container Size, and End Use.

Table 72: New Zeal, and Market Analysis by Product Type, Container Size, and End Use.

Table 73: Brazil Market Analysis by Product Type, Container Size, and End Use.

Table 74: México Market Analysis by Product Type, Container Size, and End Use.

List of Charts

Figure 01: Global Market Value (US$ Million) Analysis and Volume (Units) Analysis, 2015(H) to 2021(A)

Figure 02: Global Market Value (US$ Million) Analysis and Volume (Units) Analysis Forecast, 2022(E) to 2032(F)

Figure 03: Global Market Volume (Units) Analysis (Units) Analysis projection 2022(E) to 2032(F) and Y-o-Y growth 2022(E) to 2032(F)

Figure 04: Market Incremental Opportunity Analysis (US$ Million) Analysis 2022(E) to 2032(F)

Figure 05: Market Value (US$ Million) Analysis projection 2022(E) to 2032(F) and Y-o-Y growth 2022(E) to 2032(F)

Figure 06: Market Analysis, by Product Type, 2015(H), 2022 (E) & 2032(F)

Figure 07: Market Attractiveness Analysis, by Product Type, 2022(E) to 2032(F)

Figure 08: Market Value (US$ Million) Analysis and Volume (Units) Analysis, By Dry Containers, 2015(H) to 2021(A)

Figure 09: Market Value (US$ Million) Analysis and Volume (Units) Analysis Forecast, Dry Containers, 2022(E) to 2032(F)

Figure 10: Market Value (US$ Million) Analysis and Volume (Units) Analysis, By Reefer Containers, 2015(H) to 2021(A)

Figure 11: Market Value (US$ Million) Analysis and Volume (Units) Analysis Forecast, By Reefer Containers, 2022(E) to 2032(F)

Figure 12: Market Analysis, By Container Size, 2015(H), 2022 (E) & 2032(F)

Figure 13: Market Attractiveness Analysis, By Container Size, 2022(E) to 2032(F)

Figure 14: Market Value (US$ Million) Analysis and Volume (Units) Analysis, by Small Size Containers, 2015(H) to 2021A)

Figure 15: Market Value (US$ Million) Analysis and Volume (Units) Analysis Forecast, by Small Size Containers, 2022(E) to 2032(F)

Figure 16: Market Value (US$ Million) Analysis and Volume (Units) Analysis (Units) Analysis, by Medium Size Containers, 2015(H) to 2021A)

Figure 17: Market Value (US$ Million) Analysis and Volume (Units) Analysis Forecast, by Medium Size Containers, 2022(E) to 2032(F)

Figure 18: Market Value (US$ Million) Analysis and Volume (Units) Analysis (Units) Analysis, by High Cube Size Containers, 2015(H) to 2021A)

Figure 19: Market Value (US$ Million) Analysis and Volume (Units) Analysis Forecast, by High Cube Size Containers, 2022(E) to 2032(F)

Figure 20: Market Attractiveness Analysis, by End Use, 2022(E) to 2032(F)

Figure 21: Market Value (US$ Million) Analysis and Volume (Units) Analysis, by Oil & Gas and Mining Analysis, 2015(H) to 2021A)

Figure 22: Market Value (US$ Million) Analysis and Volume (Units) Analysis, by Oil & Gas and Mining Forecast, 2022(E) to 2032(F)

Figure 23: Market Value (US$ Million) Analysis and Volume (Units) Analysis, by Food and Beverages Analysis, 2015(H) to 2021A)

Figure 24: Market Value (US$ Million) Analysis and Volume (Units) Analysis, by Food and Beverages Forecast, 2022(E) to 2032(F)

Figure 25: Market Value (US$ Million) Analysis and Volume (Units) Analysis (Units), by Automotive, 2015(H) to 2021A)

Figure 26: Market Value (US$ Million) Analysis and Volume (Units) Analysis, by Automotive, 2022(E) to 2032(F)

Figure 27: Market Value (US$ Million) Analysis and Volume (Units) Analysis (Units), by Healthcare and Allied Industries, 2015(H) to 2021A)

Figure 28: Market Value (US$ Million) Analysis and Volume (Units) Analysis, by Healthcare and Allied Industries, 2022(E) to 2032(F)

Figure 29: Market Value (US$ Million) Analysis and Volume (Units) Analysis (Units), by Electrical and Electronics, 2015(H) to 2021A)

Figure 30: Market Value (US$ Million) Analysis and Volume (Units) Analysis, by Electrical and Electronics, 2022(E) to 2032(F)

Figure 31: Market Value (US$ Million) Analysis and Volume (Units) Analysis (Units), by Other Industries, 2015(H) to 2021A)

Figure 32: Market Value (US$ Million) Analysis and Volume (Units) Analysis, by Other Industries, 2022(E) to 2032(F)

Figure 33: Market Analysis, by region, 2015(H), 2022 (E) & 2032(F)

Figure 34: Market Attractiveness Analysis, by Region, 2022(E) to 2032(F)

Figure 35: North America Market Attractiveness Analysis, by Product Type, 2022(E) to 2032(F)

Figure 36: North America Market Analysis, by Product Type, 2015(H), 2022(E) & 2032(F)

Figure 37: North America Market Attractiveness Analysis, By Container Size, 2022(E) to 2032(F)

Figure 38: North America Market, By Container Size, 2015(H), 2022(E) & 2032(F)

Figure 39: North America Market Attractiveness Analysis, by End Use, 2022(E) to 2032(F)

Figure 40: North America Market Analysis, by End Use, 2015(H), 2022(E) & 2032(F)

Figure 41: Europe Market Attractiveness Analysis, by Product Type, 2022(E) to 2032(F)

Figure 42: Europe Market Analysis, by Product Type, 2015(H), 2022(E) & 2032(F)

Figure 43: Europe Market Attractiveness Analysis, By Container Size, 2022(E) to 2032(F)

Figure 44: Europe Market, By Container Size, 2015(H), 2022(E) & 2032(F)

Figure 45: Europe Market Attractiveness Analysis, by End Use, 2022(E) to 2032(F)

Figure 46: Europe Market Analysis, by End Use, 2015(H), 2022(E) & 2032(F)

Figure 47: Latin America Market Attractiveness Analysis, by Product Type, 2022(E) to 2032(F)

Figure 48: Latin America Market Analysis, by Product Type, 2015(H), 2022(E) & 2032(F)

Figure 49: Latin America Market Attractiveness Analysis, By Container Size, 2022(E) to 2032(F)

Figure 50: Latin America Market, By Container Size, 2015(H), 2022(E) & 2032(F)

Figure 51: Latin America Market Attractiveness Analysis, by End Use, 2022(E) to 2032(F)

Figure 52: Latin America Market Analysis, by End Use, 2015(H), 2022(E) & 2032(F)

Figure 53: East Asia Market Attractiveness Analysis, by Product Type, 2022(E) to 2032(F)

Figure 54: East Asia Market Analysis, by Product Type, 2015(H), 2022(E) & 2032(F)

Figure 55: East Asia Market Attractiveness Analysis, By Container Size, 2022(E) to 2032(F)

Figure 56: East Asia Market Analysis, By Container Size, 2015(H), 2022(E) & 2032(F)

Figure 57: East Asia Market Attractiveness Analysis, by End Use, 2022(E) to 2032(F)

Figure 58: East Asia Market Analysis, by End Use, 2015(H), 2022(E) & 2032(F)

Figure 59: South Asia Market Attractiveness Analysis, by Product Type, 2022(E) to 2032(F)

Figure 60: South Asia Market Analysis, by Product Type, 2015(H), 2022(E) & 2032(F)

Figure 61: South Asia Market Attractiveness Analysis, By Container Size, 2022(E) to 2032(F)

Figure 62: South Asia Market Analysis, By Container Size, 2015(H), 2022(E) & 2032(F)

Figure 63: South Asia Market Attractiveness Analysis, by End Use, 2022(E) to 2032(F)

Figure 64: South Asia Market Analysis, by End Use, 2015(H), 2022(E) & 2032(F)

Figure 65: MEA Market Attractiveness Analysis, by Product Type, 2022(E) to 2032(F)

Figure 66: MEA Market Analysis, by Product Type, 2015(H), 2022(E) & 2032(F)

Figure 67: MEA Market Attractiveness Analysis By Container Size, 2020(E) to 2032(F)

Figure 68: MEA Market, By Container Size, 2015(H), 2022(E) & 2032(F)

Figure 69: MEA Market Attractiveness Analysis, by End Use, 2022(E) to 2032(F)

Figure 70: MEA Market Analysis, by End Use, 2015(H), 2022(E) & 2032(F)

Recommendations

Packaging

Slotted Containers Market

Published : August 2023

Packaging

Durable Insulated Containers Market

Published : July 2022

Packaging

Rotomolded Containers Market

Published : June 2022

Packaging

Sample Containers Market

Published : July 2021

Explore Packaging Insights

View Reports