Hog Feeder Market
Dive in to Know What Drives Hog Feeder Adoption and Surpass the Competition. FMI Analysis on Hog Feeder Industry with Trends and Opportunities.
Hog Feeder Market by Product Type, Material & Region - Forecast 2023 - 2033
Hog Feeder Market Outlook 2023 - 2033
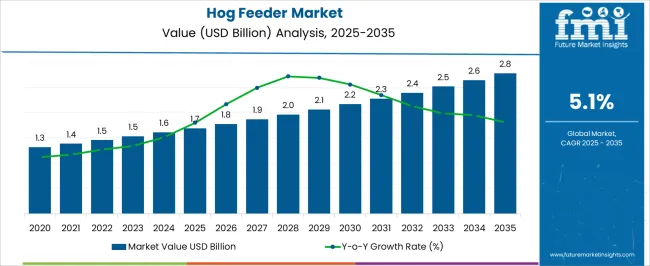
The hog feeder market size is anticipated to rise from US$ 1,530 Mn in 2023 and it is anticipated to surpass US$ 2,516 Mn by 2033. The demand for hog feeders is expected to increase at a CAGR of 5.1% during the forecast period. The growth in the market for hog feeders is attributed to the following:
- Due to the growing acceptance and popularity of hog feed mixed with well-researched and cutting-edge chemicals and premixes to promote hog health, the global market for it is growing.
- The increased commercialization of pig feed products and farmers' growing concern over the development and health of their hog herds are expected to spur the sales of hog feeders.
- The hog feeder industry is also being shaped by rising demand for premium hog meat in both established and developing nations.
- The demand for pig meat is anticipated to rise due to the expanding world population and rising per capita meat consumption, which is also anticipated to support the expansion of the global market.
Let us know your requirement to get
100% FREE customization
Growing Demand for Quality Pork Meat to Boost the Adoption of Hog Feeders
Hog production is forecast to increase as a result of the high demand for animal protein, particularly in the form of meat, which is also anticipated to accelerate the expansion of the hog feeder industry. Hog is quite well-liked by the inhabitants of various economies due to its reasonable pricing structure. Additionally, the high consumer favorability of pig products like bacon, ham, and others owing to their flavor and texture is likely to increase the demand for a hog feeder. During the forecast period, it is anticipated that established pork markets in western nations and rising commerce in livestock products and pork across several worldwide economies are likely to further drive the sales of hog feeders.
Automated Hog Feeders to Rise as One of the Major Trends in the Hog Feeder Industry
The global market for hog feeders is anticipated to have significant growth over the anticipated period. The demand for automated hog feeders has risen as manual machines were inefficient and labor costs for handling manual or semi-automatic feeders were pretty high. The manufacturers are developing hog feeder machines that are very easy to use and convenient. The sales of automatic hog feeders have increased due to the rising population of hogs and growing disposable income. These are the driving forces behind the expansion of automatic hog feeder equipment globally.
Additionally, the rise in demand for hog meat and related products throughout the world has increased farmers' interest in using autonomous hog feeder equipment to decrease labor requirements and boost hog production. As a result, these factors are likely to boost the adoption of hog feeder machines during the forecast period.
Report Attributes |
Details |
Hog Feeder Market Value (2023) |
US$ 1,530 Mn |
Hog Feeder Market CAGR (2023-2033) |
5.1% |
Anticipated Hog Feeder Market Value (2033) |
US$ 2,516 Mn |
Find your sweet spots for generating winning opportunities in this market.
Talk to AnalystHistorical Outlook 2018-2022 Vs Future Forecasts for Hog Feeder Market
According to Future Market Insights, the market for hog feeders rose at a CAGR of 4.6% from US$ 1,218.41 Mn in 2018 to US$ 1,458.54 Mn in 2022.
During the forecast period, demand for hog feeders is anticipated to rise due to several other factors in a variety of residential and industrial applications. Radiation causes the production of enzymes to proceed slowly, which eventually slows down food ripening, sprouting, and rotting. Hog Feeders for residential use have seen a considerable increase in sales as a result in recent years.
Attribute | Valuation |
2025 | US$ 1,690.09 Mn |
2028 | US$ 1,962.09 Mn |
2032 | US$ 2,394.03 Mn |
The market is anticipated to grow at a CAGR of 5.1% during 2023-2033, surpassing US$ 2,516 Mn by 2033.
- Short Term (2022 to 2025): The demand for hog feeders among animal husbandry farms is rising, which is projected to considerably contribute to the market's growth. Hog feeders are beneficial to animal husbandry processes by boosting process efficiency and lowering operational expenses. As a result, the manufacturers are devising growth strategies keeping expansion to different markets a priority.
- Medium Term (2025 to 2028): It is projected that rising demand for automated production line operations among manufacturers across a variety of industry verticals is likely to boost sales of hog feeders and, therefore, the market's expansion.
- Long Term (2028 to 2032): Increased use of cutting-edge technologies in the manufacture of a hog feeder machine is likely to aid in the growth of the market during the forecast period. With the hog population set to rise, managing the herd manually is likely to become more challenging. As a result, there is a growing demand for hog feeder equipment since they routinely feed hogs and aid in herd management.
Comparative View of the Adjacent Hog Feeder Market
Hog Feeder Market:
Attributes |
Hog Feeder Market |
CAGR (2022-2032) |
5.1% |
Market Value (2033) |
US$ 2,516 Mn |
Opportunity |
Swift technological progress in the equipment sector and specialized services |
Key Trends |
The massive increase in consumer demand for organic pig meat in developed countries. |
Automated Feeding System Market:
Attributes |
Automated Feeding System Market |
CAGR (2022-2032) |
5.4% |
Market Value (2033) |
US$ 1,200 Mn |
Opportunity |
Growing dairy farm sizes globally and rising awareness of animal nutrition management. |
Key Trends |
To decrease power outages and increase the demand for automated feeding systems, suppliers are actively engaging in research and development. |
Feed Processing Machinery Market:
Attributes |
Feed Processing Machinery Market |
CAGR (2022-2032) |
4.6% |
Market Value (2033) |
US$ 1,520.48 Mn |
Opportunity |
The demand for complex feed and feed additives has opened up a market for machinery manufacturers. |
Key Trends |
Highly automated and cutting-edge equipment has helped the industry expand in addition to meeting the need of livestock producers. |

A unified Market Research Subscription Platform, built for today's disparate research needs.
Category-wise Insights
Bunk Feeders Segment to Hold the Dominant Position in the Market
With an anticipated CAGR of 6.9% throughout the forecast period, the bunk feeder category is expected to lead the market for hog feeders. The advantages of bunk feeders, such as improved feed intake and increased animal weight growth, are what essentially drives the demand for bunk feeders. Pellet production is increasing significantly as a result of the expanding demand for nutrient-dense feed, which also encourages company investment in the hog bunk feeder manufacturing sector. These benefits have also reduced waste during the eating process. Additionally, lucrative opportunities for market expansion are likely to be generated by emerging countries' growing knowledge of the product's effectiveness.
Growing Popularity of Stainless-Steel Hog Feeders with High Endurance and Quality
Due to stainless steel's corrosion resistance, tensile strength, and durability, the stainless-steel hog feeders segment is expected to increase at a CAGR of more than 5.89% by 2033. Market expansion is projected to be fueled by manufacturers of hog feeders' rising demand for stainless steel. The high toughness, ductility, and minimal maintenance of stainless steel have led to a growth in the product's use in hog feeder equipment, which is expected to drive up demand for stainless steel during the forecast period.
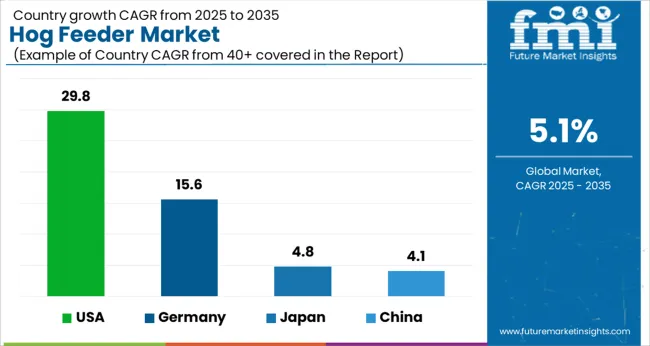
Country-wise Insights
Country |
The U.S. |
CAGR (2023-2033) |
29.8% |
Market Value by 2033 (in US$ Mn) |
433.8 |
Country |
Germany |
CAGR (2023-2033) |
15.6% |
Market Value by 2033 (in US$ Mn) |
227.0 |
Country |
Japan |
CAGR (2023-2033) |
4.8% |
Market Value by 2033 (in US$ Mn) |
70.6 |
Country |
China |
CAGR (2023-2033) |
4.1% |
Market Value by 2033 (in US$ Mn) |
219.5 |
United States to Lead the Hog Feeder Industry with a CAGR of 29.8% during 2023-2033
Due to the rising demand for premium swine meat and other goods in the area, North America is expected to experience significant growth over the next years. The market in the area is anticipated to expand as a result of the presence of major industry players in the U.S. Another factor that might contribute to the future expansion of the quality swine feed sector in nations like the U.S. and Canada is the high profitability gained from exporting hog.
The U.S. hog feeder market is anticipated to surpass US$ 433.8 Mn by 2033, rising at a CAGR of 8.3% during the forecast period. Furthermore, the expansion of this market in the US is being influenced by the rising consumption of pork-based products.
Germany Controls the Majority of the European Hog Feeder Market
Due to factors like increasing corporate focus on technological developments in feeding management, effectively managing animal nutritional requirements, and rising adoption of hog feeders in hog farming, Germany is currently dominating the European hog feeder industry. Germany is likely to witness significant growth prospects in the market. The German hog feeder industry is anticipated to be worth US$ 227.0 Mn by 2033, growing at a CAGR of 15.6% during the forecast period.
For instance, Trioliet introduced new feeding equipment called Solomix 3 in September 2018 to attract major European cattle farms, grow their business, and add to their current product line.
Japan Hog Feeder Market Outlook
Japan's hog feeder industry is to reach US$ 270.6 million by 2033, expanding at a strong CAGR of 4.8% over the projected period. The sales of hog feeders in the region are growing due to urbanization and rising middle-class incomes. The demand for hog feed is consequently driven by the growing price of raw materials for animal use. The processed meat sector, which is expanding healthily and demands premium hog meat, also contributes to market growth.
China to Witness High Demand for Hog Feeders During 2023-2033
China accounts for a 10.1% share of the hog feeder industry, growing at a CAGR of 4.1% during the forecast period. By 2033, due to high hog consumption in the region, China's hog feeder industry is anticipated to surpass US$ 219.5. The market is primarily driven by the growing concentration of hog feeder equipment companies, technological advancements, and government incentives for mechanization due to population growth. The development of the nation's hog industry and the development of export potential for other nations are both significantly aided by China's hog feeder industry.
Hog Feeder Manufacturers to Revise the Strategies and Obtain Larger Share of Profits
The market for hog feeders is slightly competitive due to the presence of some of the major giants. The hog feeder industry has a medium level of market concentration, with several prominent companies using tactics including product innovation, mergers, and acquisitions to get an edge over rivals.
To expand their market share in the international market, major businesses are similarly choosing mergers and acquisitions and working with regional players. Government, equipment manufacturers, commercial distribution utilities, and service providers are heavily engaging in research and development operations to decrease power outages and increase the need for automated feeding systems to gain a competitive edge.
- Brehmer Mfg.
Brehmer Mfg. is a leading manufacturer of stainless-steel hog feeder equipment since 1982. Brehmer Mfg. has previously worked as a contract maker for several well-known feeder brands. We identified locations where these feeders may be strengthened as a result of our years of expertise. We decided to take the risk and create our line of hog-producing machinery.
A specialized barn is used by the family-owned Brehmer Mfg. to test its products. Brehmer uses 304 stainless steel to construct all goods according to your demands while continuously innovating its designs. As a consequence, you can rely on the reliability and usability of a Brehmer Feeder.
- Hog Slat
Hog Slat manufactures and distributes a variety of hog feeders that aid the hogs from farrowing to market. Hog Slat stocks models of baby pig creep feeders, nursery feeders, finishing feeders, and sow feeders. They also developed the most innovative sow feeding system on the market with the introduction of the SowMax Ad Lib Feeder.
Major Manufacturers in the Hog Feeder Industry
- Hog Slat
- Sioux Steel Company
- Osborne Livestock Equipment
- PS Operating Company LLC.
- County Line
- Miller Manufacturing Company
- Behlen Country
- Big Herdsman Machinery
- O'Mara
- Fancom BV
Recent Developments in the Hog Feeder Industry:
- The micro feed system, the 3-Rolls assembly upgrade for the Paladin 2000, and the metris vibe are three new animal and aqua feed equipment advances that ANDRITZ unveiled in May 2022. This micro feed system makes use of the aqua feed-specific extruder. With a dimension of less than 2mm, the technique enhances capacity by 40% as compared to traditional extrusion machines.
- A strategic partnership agreement between Bratney Companies and F.H. Schule Mühlenbau (a member of the Kahl Group) was announced in July 2019. For both new and current milling operations, this relationship involves joint distributorship, sales, and promotional initiatives in the United States.
Report Scope
Report Attribute |
Details |
Growth Rate |
CAGR of 5.1% from 2023 to 2033 |
Historical Data |
2018-2022 |
Forecast Period |
2023-2033 |
Quantitative Units |
Revenue in US$ Million and CAGR from 2023-2033 |
Segments Covered |
|
Regions Covered |
|
Key Countries Profiled |
|
Key Companies Profiled |
|
Customization scope |
Available Upon Request |
Pricing and Purchase Option |
Avail of Customized purchase options to meet your exact research needs. |
Key Segments Covered in the Report
By Product Type:
- Hay Feeders
- Bunk Feeders
- Feed Feeders
- Lick Feeders
By Material:
- Stainless Steel
- Mild Steel
- Plastic
- A mix of Plastic & Stainless steel
By Region:
- North America
- Latin America
- Europe
- Asia Pacific (APAC)
- Middle East & Africa (MEA)
Frequently Asked Questions
The hog feeder market is likely to register a CAGR of 5.1% during the forecast period.
For the current year 2023, the value of the global hog feeder market share is estimated to be around US$ 1,530 Mn.
The hog feeder market share is likely to reach US$ 2,516 Mn by 2033.
The bunk feeder segment dominates the market with a CAGR of 6.9% during the forecast period.
Table of Content
1. Executive Summary
1.1. Global Market Outlook
1.2. Demand-side Trends
1.3. Supply-side Trends
1.4. Technology Roadmap Analysis
1.5. Analysis and Recommendations
2. Market Overview
2.1. Market Coverage / Taxonomy
2.2. Market Definition / Scope / Limitations
3. Market Background
3.1. Market Dynamics
3.1.1. Drivers
3.1.2. Restraints
3.1.3. Opportunity
3.1.4. Trends
3.2. Scenario Forecast
3.2.1. Demand in Optimistic Scenario
3.2.2. Demand in Likely Scenario
3.2.3. Demand in Conservative Scenario
3.3. Opportunity Map Analysis
3.4. Product Life Cycle Analysis
3.5. Supply Chain Analysis
3.5.1. Supply Side Participants and their Roles
3.5.1.1. Producers
3.5.1.2. Mid-Level Participants (Traders/ Agents/ Brokers)
3.5.1.3. Wholesalers and Distributors
3.5.2. Value Added and Value Created at Node in the Supply Chain
3.5.3. List of Raw Material Suppliers
3.5.4. List of Existing and Potential Buyer’s
3.6. Investment Feasibility Matrix
3.7. Value Chain Analysis
3.7.1. Profit Margin Analysis
3.7.2. Wholesalers and Distributors
3.7.3. Retailers
3.8. PESTLE and Porter’s Analysis
3.9. Regulatory Landscape
3.9.1. By Key Regions
3.9.2. By Key Countries
3.10. Regional Parent Market Outlook
3.11. Production and Consumption Statistics
3.12. Import and Export Statistics
4. Global Market Analysis 2018-2022 and Forecast, 2023-2033
4.1. Historical Market Size Value (US$ Mn) & Volume (Units) Analysis, 2018-2022
4.2. Current and Future Market Size Value (US$ Mn) & Volume (Units) Projections, 2023-2033
4.2.1. Y-o-Y Growth Trend Analysis
4.2.2. Absolute $ Opportunity Analysis
5. Global Market Analysis 2018-2022 and Forecast 2023-2033, By Type
5.1. Introduction / Key Findings
5.2. Historical Market Size Value (US$ Mn) & Volume (Units) Analysis By Type, 2018-2022
5.3. Current and Future Market Size Value (US$ Mn) & Volume (Units) Analysis and Forecast By Type, 2023-2033
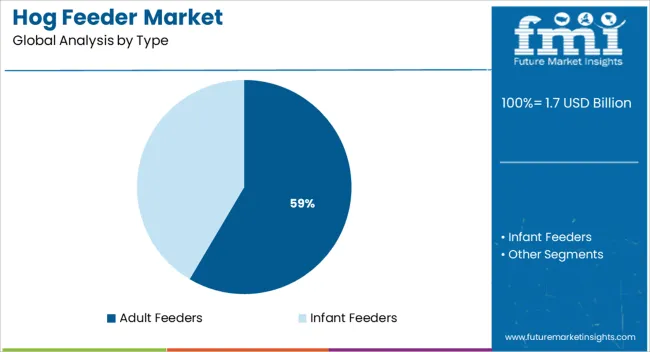
5.3.1. Infant Feeders
5.3.2. Adult Feeders
5.4. Y-o-Y Growth Trend Analysis By Type, 2018-2022
5.5. Absolute $ Opportunity Analysis By Type, 2023-2033
6. Global Market Analysis 2018-2022 and Forecast 2023-2033, By Facility
6.1. Introduction / Key Findings
6.2. Historical Market Size Value (US$ Mn) & Volume (Units) Analysis By Facility, 2018-2022
6.3. Current and Future Market Size Value (US$ Mn) & Volume (Units) Analysis and Forecast By Facility, 2023-2033
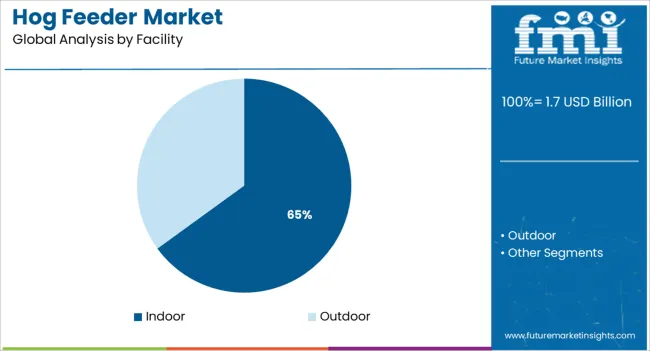
6.3.1. Indoor
6.3.2. Outdoor
6.4. Y-o-Y Growth Trend Analysis By Facility, 2018-2022
6.5. Absolute $ Opportunity Analysis By Facility, 2023-2033
7. Global Market Analysis 2018-2022 and Forecast 2023-2033, By Sales Channel
7.1. Introduction / Key Findings
7.2. Historical Market Size Value (US$ Mn) & Volume (Units) Analysis By Sales Channel, 2018-2022
7.3. Current and Future Market Size Value (US$ Mn) & Volume (Units) Analysis and Forecast By Sales Channel, 2023-2033
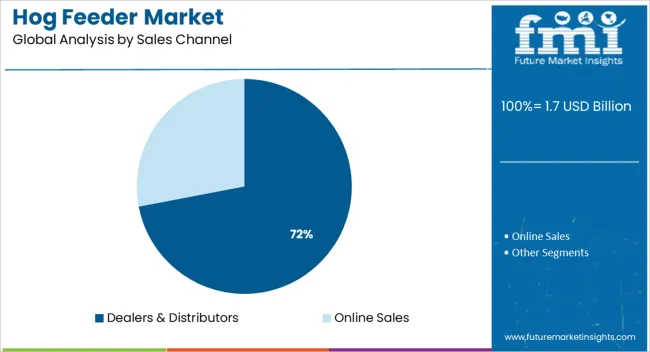
7.3.1. Online Sales
7.3.2. Dealers & Distributors
7.4. Y-o-Y Growth Trend Analysis By Sales Channel, 2018-2022
7.5. Absolute $ Opportunity Analysis By Sales Channel, 2023-2033
8. Global Market Analysis 2018-2022 and Forecast 2023-2033, By Application
8.1. Introduction / Key Findings
8.2. Historical Market Size Value (US$ Mn) & Volume (Units) Analysis By Application, 2018-2022
8.3. Current and Future Market Size Value (US$ Mn) & Volume (Units) Analysis and Forecast By Application, 2023-2033
8.3.1. Hunting
8.3.2. Domestic Farm
8.4. Y-o-Y Growth Trend Analysis By Application, 2018-2022
8.5. Absolute $ Opportunity Analysis By Application, 2023-2033
9. Global Market Analysis 2018-2022 and Forecast 2023-2033, By Region
9.1. Introduction
9.2. Historical Market Size Value (US$ Mn) & Volume (Units) Analysis By Region, 2018-2022
9.3. Current Market Size Value (US$ Mn) & Volume (Units) Analysis and Forecast By Region, 2023-2033
9.3.1. North America
9.3.2. Latin America
9.3.3. Europe
9.3.4. Asia Pacific
9.3.5. MEA
9.4. Market Attractiveness Analysis By Region
10. North America Market Analysis 2018-2022 and Forecast 2023-2033, By Country
10.1. Historical Market Size Value (US$ Mn) & Volume (Units) Trend Analysis By Market Taxonomy, 2018-2022
10.2. Market Size Value (US$ Mn) & Volume (Units) Forecast By Market Taxonomy, 2023-2033
10.2.1. By Country
10.2.1.1. U.S.
10.2.1.2. Canada
10.2.2. By Type
10.2.3. By Facility
10.2.4. By Sales Channel
10.2.5. By Application
10.3. Market Attractiveness Analysis
10.3.1. By Country
10.3.2. By Type
10.3.3. By Facility
10.3.4. By Sales Channel
10.3.5. By Application
10.4. Key Takeaways
11. Latin America Market Analysis 2018-2022 and Forecast 2023-2033, By Country
11.1. Historical Market Size Value (US$ Mn) & Volume (Units) Trend Analysis By Market Taxonomy, 2018-2022
11.2. Market Size Value (US$ Mn) & Volume (Units) Forecast By Market Taxonomy, 2023-2033
11.2.1. By Country
11.2.1.1. Brazil
11.2.1.2. Mexico
11.2.1.3. Rest of Latin America
11.2.2. By Type
11.2.3. By Facility
11.2.4. By Sales Channel
11.2.5. By Application
11.3. Market Attractiveness Analysis
11.3.1. By Country
11.3.2. By Type
11.3.3. By Facility
11.3.4. By Sales Channel
11.3.5. By Application
11.4. Key Takeaways
12. Europe Market Analysis 2018-2022 and Forecast 2023-2033, By Country
12.1. Historical Market Size Value (US$ Mn) & Volume (Units) Trend Analysis By Market Taxonomy, 2018-2022
12.2. Market Size Value (US$ Mn) & Volume (Units) Forecast By Market Taxonomy, 2023-2033
12.2.1. By Country
12.2.1.1. Germany
12.2.1.2. U.K.
12.2.1.3. France
12.2.1.4. Spain
12.2.1.5. Italy
12.2.1.6. Rest of Europe
12.2.2. By Type
12.2.3. By Facility
12.2.4. By Sales Channel
12.2.5. By Application
12.3. Market Attractiveness Analysis
12.3.1. By Country
12.3.2. By Type
12.3.3. By Facility
12.3.4. By Sales Channel
12.3.5. By Application
12.4. Key Takeaways
13. Asia Pacific Market Analysis 2018-2022 and Forecast 2023-2033, By Country
13.1. Historical Market Size Value (US$ Mn) & Volume (Units) Trend Analysis By Market Taxonomy, 2018-2022
13.2. Market Size Value (US$ Mn) & Volume (Units) Forecast By Market Taxonomy, 2023-2033
13.2.1. By Country
13.2.1.1. China
13.2.1.2. Japan
13.2.1.3. South Korea
13.2.1.4. Singapore
13.2.1.5. Thailand
13.2.1.6. Indonesia
13.2.1.7. Australia
13.2.1.8. New Zealand
13.2.1.9. Rest of Asia Pacific
13.2.2. By Type
13.2.3. By Facility
13.2.4. By Sales Channel
13.2.5. By Application
13.3. Market Attractiveness Analysis
13.3.1. By Country
13.3.2. By Type
13.3.3. By Facility
13.3.4. By Sales Channel
13.3.5. By Application
13.4. Key Takeaways
14. MEA Market Analysis 2018-2022 and Forecast 2023-2033, By Country
14.1. Historical Market Size Value (US$ Mn) & Volume (Units) Trend Analysis By Market Taxonomy, 2018-2022
14.2. Market Size Value (US$ Mn) & Volume (Units) Forecast By Market Taxonomy, 2023-2033
14.2.1. By Country
14.2.1.1. GCC Countries
14.2.1.2. South Africa
14.2.1.3. Israel
14.2.1.4. Rest of MEA
14.2.2. By Type
14.2.3. By Facility
14.2.4. By Sales Channel
14.2.5. By Application
14.3. Market Attractiveness Analysis
14.3.1. By Country
14.3.2. By Type
14.3.3. By Facility
14.3.4. By Sales Channel
14.3.5. By Application
14.4. Key Takeaways
15. Key Countries Market Analysis
15.1. U.S.
15.1.1. Pricing Analysis
15.1.2. Market Share Analysis, 2022
15.1.2.1. By Type
15.1.2.2. By Facility
15.1.2.3. By Sales Channel
15.1.2.4. By Application
15.2. Canada
15.2.1. Pricing Analysis
15.2.2. Market Share Analysis, 2022
15.2.2.1. By Type
15.2.2.2. By Facility
15.2.2.3. By Sales Channel
15.2.2.4. By Application
15.3. Brazil
15.3.1. Pricing Analysis
15.3.2. Market Share Analysis, 2022
15.3.2.1. By Type
15.3.2.2. By Facility
15.3.2.3. By Sales Channel
15.3.2.4. By Application
15.4. Mexico
15.4.1. Pricing Analysis
15.4.2. Market Share Analysis, 2022
15.4.2.1. By Type
15.4.2.2. By Facility
15.4.2.3. By Sales Channel
15.4.2.4. By Application
15.5. Germany
15.5.1. Pricing Analysis
15.5.2. Market Share Analysis, 2022
15.5.2.1. By Type
15.5.2.2. By Facility
15.5.2.3. By Sales Channel
15.5.2.4. By Application
15.6. U.K.
15.6.1. Pricing Analysis
15.6.2. Market Share Analysis, 2022
15.6.2.1. By Type
15.6.2.2. By Facility
15.6.2.3. By Sales Channel
15.6.2.4. By Application
15.7. France
15.7.1. Pricing Analysis
15.7.2. Market Share Analysis, 2022
15.7.2.1. By Type
15.7.2.2. By Facility
15.7.2.3. By Sales Channel
15.7.2.4. By Application
15.8. Spain
15.8.1. Pricing Analysis
15.8.2. Market Share Analysis, 2022
15.8.2.1. By Type
15.8.2.2. By Facility
15.8.2.3. By Sales Channel
15.8.2.4. By Application
15.9. Italy
15.9.1. Pricing Analysis
15.9.2. Market Share Analysis, 2022
15.9.2.1. By Type
15.9.2.2. By Facility
15.9.2.3. By Sales Channel
15.9.2.4. By Application
15.10. China
15.10.1. Pricing Analysis
15.10.2. Market Share Analysis, 2022
15.10.2.1. By Type
15.10.2.2. By Facility
15.10.2.3. By Sales Channel
15.10.2.4. By Application
15.11. Japan
15.11.1. Pricing Analysis
15.11.2. Market Share Analysis, 2022
15.11.2.1. By Type
15.11.2.2. By Facility
15.11.2.3. By Sales Channel
15.11.2.4. By Application
15.12. South Korea
15.12.1. Pricing Analysis
15.12.2. Market Share Analysis, 2022
15.12.2.1. By Type
15.12.2.2. By Facility
15.12.2.3. By Sales Channel
15.12.2.4. By Application
15.13. Singapore
15.13.1. Pricing Analysis
15.13.2. Market Share Analysis, 2022
15.13.2.1. By Type
15.13.2.2. By Facility
15.13.2.3. By Sales Channel
15.13.2.4. By Application
15.14. Thailand
15.14.1. Pricing Analysis
15.14.2. Market Share Analysis, 2022
15.14.2.1. By Type
15.14.2.2. By Facility
15.14.2.3. By Sales Channel
15.14.2.4. By Application
15.15. Indonesia
15.15.1. Pricing Analysis
15.15.2. Market Share Analysis, 2022
15.15.2.1. By Type
15.15.2.2. By Facility
15.15.2.3. By Sales Channel
15.15.2.4. By Application
15.16. Australia
15.16.1. Pricing Analysis
15.16.2. Market Share Analysis, 2022
15.16.2.1. By Type
15.16.2.2. By Facility
15.16.2.3. By Sales Channel
15.16.2.4. By Application
15.17. New Zealand
15.17.1. Pricing Analysis
15.17.2. Market Share Analysis, 2022
15.17.2.1. By Type
15.17.2.2. By Facility
15.17.2.3. By Sales Channel
15.17.2.4. By Application
15.18. GCC Countries
15.18.1. Pricing Analysis
15.18.2. Market Share Analysis, 2022
15.18.2.1. By Type
15.18.2.2. By Facility
15.18.2.3. By Sales Channel
15.18.2.4. By Application
15.19. South Africa
15.19.1. Pricing Analysis
15.19.2. Market Share Analysis, 2022
15.19.2.1. By Type
15.19.2.2. By Facility
15.19.2.3. By Sales Channel
15.19.2.4. By Application
15.20. Israel
15.20.1. Pricing Analysis
15.20.2. Market Share Analysis, 2022
15.20.2.1. By Type
15.20.2.2. By Facility
15.20.2.3. By Sales Channel
15.20.2.4. By Application
16. Market Structure Analysis
16.1. Competition Dashboard
16.2. Competition Benchmarking
16.3. Market Share Analysis of Top Players
16.3.1. By Regional
16.3.2. By Type
16.3.3. By Facility
16.3.4. By Sales Channel
16.3.5. By Application
17. Competition Analysis
17.1. Competition Deep Dive
17.1.1. Osborne Industries Inc.
17.1.1.1. Overview
17.1.1.2. Product Portfolio
17.1.1.3. Profitability by Market Segments
17.1.1.4. Sales Footprint
17.1.1.5. Strategy Overview
17.1.1.5.1. Marketing Strategy
17.1.1.5.2. Product Strategy
17.1.1.5.3. Channel Strategy
17.1.2. Hog Slat
17.1.2.1. Overview
17.1.2.2. Product Portfolio
17.1.2.3. Profitability by Market Segments
17.1.2.4. Sales Footprint
17.1.2.5. Strategy Overview
17.1.2.5.1. Marketing Strategy
17.1.2.5.2. Product Strategy
17.1.2.5.3. Channel Strategy
17.1.3. browerequip.com
17.1.3.1. Overview
17.1.3.2. Product Portfolio
17.1.3.3. Profitability by Market Segments
17.1.3.4. Sales Footprint
17.1.3.5. Strategy Overview
17.1.3.5.1. Marketing Strategy
17.1.3.5.2. Product Strategy
17.1.3.5.3. Channel Strategy
17.1.4. Quality Equipment Ltd.
17.1.4.1. Overview
17.1.4.2. Product Portfolio
17.1.4.3. Profitability by Market Segments
17.1.4.4. Sales Footprint
17.1.4.5. Strategy Overview
17.1.4.5.1. Marketing Strategy
17.1.4.5.2. Product Strategy
17.1.4.5.3. Channel Strategy
17.1.5. Miller Co
17.1.5.1. Overview
17.1.5.2. Product Portfolio
17.1.5.3. Profitability by Market Segments
17.1.5.4. Sales Footprint
17.1.5.5. Strategy Overview
17.1.5.5.1. Marketing Strategy
17.1.5.5.2. Product Strategy
17.1.5.5.3. Channel Strategy
17.1.6. Lilbees
17.1.6.1. Overview
17.1.6.2. Product Portfolio
17.1.6.3. Profitability by Market Segments
17.1.6.4. Sales Footprint
17.1.6.5. Strategy Overview
17.1.6.5.1. Marketing Strategy
17.1.6.5.2. Product Strategy
17.1.6.5.3. Channel Strategy
17.1.7. Sioux Steel Company
17.1.7.1. Overview
17.1.7.2. Product Portfolio
17.1.7.3. Profitability by Market Segments
17.1.7.4. Sales Footprint
17.1.7.5. Strategy Overview
17.1.7.5.1. Marketing Strategy
17.1.7.5.2. Product Strategy
17.1.7.5.3. Channel Strategy
17.1.8. Brehmer
17.1.8.1. Overview
17.1.8.2. Product Portfolio
17.1.8.3. Profitability by Market Segments
17.1.8.4. Sales Footprint
17.1.8.5. Strategy Overview
17.1.8.5.1. Marketing Strategy
17.1.8.5.2. Product Strategy
17.1.8.5.3. Channel Strategy
17.1.9. Miller Manufacturing Company
17.1.9.1. Overview
17.1.9.2. Product Portfolio
17.1.9.3. Profitability by Market Segments
17.1.9.4. Sales Footprint
17.1.9.5. Strategy Overview
17.1.9.5.1. Marketing Strategy
17.1.9.5.2. Product Strategy
17.1.9.5.3. Channel Strategy
17.1.10. SDI
17.1.10.1. Overview
17.1.10.2. Product Portfolio
17.1.10.3. Profitability by Market Segments
17.1.10.4. Sales Footprint
17.1.10.5. Strategy Overview
17.1.10.5.1. Marketing Strategy
17.1.10.5.2. Product Strategy
17.1.10.5.3. Channel Strategy
18. Assumptions & Acronyms Used
19. Research Methodology
Let us know your requirement to get
100% FREE customization
List of Tables
Table 1: Global Market Value (US$ Mn) Forecast by Region, 2018-2033
Table 2: Global Market Volume (Units) Forecast by Region, 2018-2033
Table 3: Global Market Value (US$ Mn) Forecast by Type, 2018-2033
Table 4: Global Market Volume (Units) Forecast by Type, 2018-2033
Table 5: Global Market Value (US$ Mn) Forecast by Facility, 2018-2033
Table 6: Global Market Volume (Units) Forecast by Facility, 2018-2033
Table 7: Global Market Value (US$ Mn) Forecast by Sales Channel, 2018-2033
Table 8: Global Market Volume (Units) Forecast by Sales Channel, 2018-2033
Table 9: Global Market Value (US$ Mn) Forecast by Application, 2018-2033
Table 10: Global Market Volume (Units) Forecast by Application, 2018-2033
Table 11: North America Market Value (US$ Mn) Forecast by Country, 2018-2033
Table 12: North America Market Volume (Units) Forecast by Country, 2018-2033
Table 13: North America Market Value (US$ Mn) Forecast by Type, 2018-2033
Table 14: North America Market Volume (Units) Forecast by Type, 2018-2033
Table 15: North America Market Value (US$ Mn) Forecast by Facility, 2018-2033
Table 16: North America Market Volume (Units) Forecast by Facility, 2018-2033
Table 17: North America Market Value (US$ Mn) Forecast by Sales Channel, 2018-2033
Table 18: North America Market Volume (Units) Forecast by Sales Channel, 2018-2033
Table 19: North America Market Value (US$ Mn) Forecast by Application, 2018-2033
Table 20: North America Market Volume (Units) Forecast by Application, 2018-2033
Table 21: Latin America Market Value (US$ Mn) Forecast by Country, 2018-2033
Table 22: Latin America Market Volume (Units) Forecast by Country, 2018-2033
Table 23: Latin America Market Value (US$ Mn) Forecast by Type, 2018-2033
Table 24: Latin America Market Volume (Units) Forecast by Type, 2018-2033
Table 25: Latin America Market Value (US$ Mn) Forecast by Facility, 2018-2033
Table 26: Latin America Market Volume (Units) Forecast by Facility, 2018-2033
Table 27: Latin America Market Value (US$ Mn) Forecast by Sales Channel, 2018-2033
Table 28: Latin America Market Volume (Units) Forecast by Sales Channel, 2018-2033
Table 29: Latin America Market Value (US$ Mn) Forecast by Application, 2018-2033
Table 30: Latin America Market Volume (Units) Forecast by Application, 2018-2033
Table 31: Europe Market Value (US$ Mn) Forecast by Country, 2018-2033
Table 32: Europe Market Volume (Units) Forecast by Country, 2018-2033
Table 33: Europe Market Value (US$ Mn) Forecast by Type, 2018-2033
Table 34: Europe Market Volume (Units) Forecast by Type, 2018-2033
Table 35: Europe Market Value (US$ Mn) Forecast by Facility, 2018-2033
Table 36: Europe Market Volume (Units) Forecast by Facility, 2018-2033
Table 37: Europe Market Value (US$ Mn) Forecast by Sales Channel, 2018-2033
Table 38: Europe Market Volume (Units) Forecast by Sales Channel, 2018-2033
Table 39: Europe Market Value (US$ Mn) Forecast by Application, 2018-2033
Table 40: Europe Market Volume (Units) Forecast by Application, 2018-2033
Table 41: Asia Pacific Market Value (US$ Mn) Forecast by Country, 2018-2033
Table 42: Asia Pacific Market Volume (Units) Forecast by Country, 2018-2033
Table 43: Asia Pacific Market Value (US$ Mn) Forecast by Type, 2018-2033
Table 44: Asia Pacific Market Volume (Units) Forecast by Type, 2018-2033
Table 45: Asia Pacific Market Value (US$ Mn) Forecast by Facility, 2018-2033
Table 46: Asia Pacific Market Volume (Units) Forecast by Facility, 2018-2033
Table 47: Asia Pacific Market Value (US$ Mn) Forecast by Sales Channel, 2018-2033
Table 48: Asia Pacific Market Volume (Units) Forecast by Sales Channel, 2018-2033
Table 49: Asia Pacific Market Value (US$ Mn) Forecast by Application, 2018-2033
Table 50: Asia Pacific Market Volume (Units) Forecast by Application, 2018-2033
Table 51: MEA Market Value (US$ Mn) Forecast by Country, 2018-2033
Table 52: MEA Market Volume (Units) Forecast by Country, 2018-2033
Table 53: MEA Market Value (US$ Mn) Forecast by Type, 2018-2033
Table 54: MEA Market Volume (Units) Forecast by Type, 2018-2033
Table 55: MEA Market Value (US$ Mn) Forecast by Facility, 2018-2033
Table 56: MEA Market Volume (Units) Forecast by Facility, 2018-2033
Table 57: MEA Market Value (US$ Mn) Forecast by Sales Channel, 2018-2033
Table 58: MEA Market Volume (Units) Forecast by Sales Channel, 2018-2033
Table 59: MEA Market Value (US$ Mn) Forecast by Application, 2018-2033
Table 60: MEA Market Volume (Units) Forecast by Application, 2018-2033
Find your sweet spots for generating winning opportunities in this market.
Talk to AnalystList of Charts
Figure 1: Global Market Value (US$ Mn) by Type, 2023-2033
Figure 2: Global Market Value (US$ Mn) by Facility, 2023-2033
Figure 3: Global Market Value (US$ Mn) by Sales Channel, 2023-2033
Figure 4: Global Market Value (US$ Mn) by Application, 2023-2033
Figure 5: Global Market Value (US$ Mn) by Region, 2023-2033
Figure 6: Global Market Value (US$ Mn) Analysis by Region, 2018-2033
Figure 7: Global Market Volume (Units) Analysis by Region, 2018-2033
Figure 8: Global Market Value Share (%) and BPS Analysis by Region, 2023-2033
Figure 9: Global Market Y-o-Y Growth (%) Projections by Region, 2023-2033
Figure 10: Global Market Value (US$ Mn) Analysis by Type, 2018-2033
Figure 11: Global Market Volume (Units) Analysis by Type, 2018-2033
Figure 12: Global Market Value Share (%) and BPS Analysis by Type, 2023-2033
Figure 13: Global Market Y-o-Y Growth (%) Projections by Type, 2023-2033
Figure 14: Global Market Value (US$ Mn) Analysis by Facility, 2018-2033
Figure 15: Global Market Volume (Units) Analysis by Facility, 2018-2033
Figure 16: Global Market Value Share (%) and BPS Analysis by Facility, 2023-2033
Figure 17: Global Market Y-o-Y Growth (%) Projections by Facility, 2023-2033
Figure 18: Global Market Value (US$ Mn) Analysis by Sales Channel, 2018-2033
Figure 19: Global Market Volume (Units) Analysis by Sales Channel, 2018-2033
Figure 20: Global Market Value Share (%) and BPS Analysis by Sales Channel, 2023-2033
Figure 21: Global Market Y-o-Y Growth (%) Projections by Sales Channel, 2023-2033
Figure 22: Global Market Value (US$ Mn) Analysis by Application, 2018-2033
Figure 23: Global Market Volume (Units) Analysis by Application, 2018-2033
Figure 24: Global Market Value Share (%) and BPS Analysis by Application, 2023-2033
Figure 25: Global Market Y-o-Y Growth (%) Projections by Application, 2023-2033
Figure 26: Global Market Attractiveness by Type, 2023-2033
Figure 27: Global Market Attractiveness by Facility, 2023-2033
Figure 28: Global Market Attractiveness by Sales Channel, 2023-2033
Figure 29: Global Market Attractiveness by Application, 2023-2033
Figure 30: Global Market Attractiveness by Region, 2023-2033
Figure 31: North America Market Value (US$ Mn) by Type, 2023-2033
Figure 32: North America Market Value (US$ Mn) by Facility, 2023-2033
Figure 33: North America Market Value (US$ Mn) by Sales Channel, 2023-2033
Figure 34: North America Market Value (US$ Mn) by Application, 2023-2033
Figure 35: North America Market Value (US$ Mn) by Country, 2023-2033
Figure 36: North America Market Value (US$ Mn) Analysis by Country, 2018-2033
Figure 37: North America Market Volume (Units) Analysis by Country, 2018-2033
Figure 38: North America Market Value Share (%) and BPS Analysis by Country, 2023-2033
Figure 39: North America Market Y-o-Y Growth (%) Projections by Country, 2023-2033
Figure 40: North America Market Value (US$ Mn) Analysis by Type, 2018-2033
Figure 41: North America Market Volume (Units) Analysis by Type, 2018-2033
Figure 42: North America Market Value Share (%) and BPS Analysis by Type, 2023-2033
Figure 43: North America Market Y-o-Y Growth (%) Projections by Type, 2023-2033
Figure 44: North America Market Value (US$ Mn) Analysis by Facility, 2018-2033
Figure 45: North America Market Volume (Units) Analysis by Facility, 2018-2033
Figure 46: North America Market Value Share (%) and BPS Analysis by Facility, 2023-2033
Figure 47: North America Market Y-o-Y Growth (%) Projections by Facility, 2023-2033
Figure 48: North America Market Value (US$ Mn) Analysis by Sales Channel, 2018-2033
Figure 49: North America Market Volume (Units) Analysis by Sales Channel, 2018-2033
Figure 50: North America Market Value Share (%) and BPS Analysis by Sales Channel, 2023-2033
Figure 51: North America Market Y-o-Y Growth (%) Projections by Sales Channel, 2023-2033
Figure 52: North America Market Value (US$ Mn) Analysis by Application, 2018-2033
Figure 53: North America Market Volume (Units) Analysis by Application, 2018-2033
Figure 54: North America Market Value Share (%) and BPS Analysis by Application, 2023-2033
Figure 55: North America Market Y-o-Y Growth (%) Projections by Application, 2023-2033
Figure 56: North America Market Attractiveness by Type, 2023-2033
Figure 57: North America Market Attractiveness by Facility, 2023-2033
Figure 58: North America Market Attractiveness by Sales Channel, 2023-2033
Figure 59: North America Market Attractiveness by Application, 2023-2033
Figure 60: North America Market Attractiveness by Country, 2023-2033
Figure 61: Latin America Market Value (US$ Mn) by Type, 2023-2033
Figure 62: Latin America Market Value (US$ Mn) by Facility, 2023-2033
Figure 63: Latin America Market Value (US$ Mn) by Sales Channel, 2023-2033
Figure 64: Latin America Market Value (US$ Mn) by Application, 2023-2033
Figure 65: Latin America Market Value (US$ Mn) by Country, 2023-2033
Figure 66: Latin America Market Value (US$ Mn) Analysis by Country, 2018-2033
Figure 67: Latin America Market Volume (Units) Analysis by Country, 2018-2033
Figure 68: Latin America Market Value Share (%) and BPS Analysis by Country, 2023-2033
Figure 69: Latin America Market Y-o-Y Growth (%) Projections by Country, 2023-2033
Figure 70: Latin America Market Value (US$ Mn) Analysis by Type, 2018-2033
Figure 71: Latin America Market Volume (Units) Analysis by Type, 2018-2033
Figure 72: Latin America Market Value Share (%) and BPS Analysis by Type, 2023-2033
Figure 73: Latin America Market Y-o-Y Growth (%) Projections by Type, 2023-2033
Figure 74: Latin America Market Value (US$ Mn) Analysis by Facility, 2018-2033
Figure 75: Latin America Market Volume (Units) Analysis by Facility, 2018-2033
Figure 76: Latin America Market Value Share (%) and BPS Analysis by Facility, 2023-2033
Figure 77: Latin America Market Y-o-Y Growth (%) Projections by Facility, 2023-2033
Figure 78: Latin America Market Value (US$ Mn) Analysis by Sales Channel, 2018-2033
Figure 79: Latin America Market Volume (Units) Analysis by Sales Channel, 2018-2033
Figure 80: Latin America Market Value Share (%) and BPS Analysis by Sales Channel, 2023-2033
Figure 81: Latin America Market Y-o-Y Growth (%) Projections by Sales Channel, 2023-2033
Figure 82: Latin America Market Value (US$ Mn) Analysis by Application, 2018-2033
Figure 83: Latin America Market Volume (Units) Analysis by Application, 2018-2033
Figure 84: Latin America Market Value Share (%) and BPS Analysis by Application, 2023-2033
Figure 85: Latin America Market Y-o-Y Growth (%) Projections by Application, 2023-2033
Figure 86: Latin America Market Attractiveness by Type, 2023-2033
Figure 87: Latin America Market Attractiveness by Facility, 2023-2033
Figure 88: Latin America Market Attractiveness by Sales Channel, 2023-2033
Figure 89: Latin America Market Attractiveness by Application, 2023-2033
Figure 90: Latin America Market Attractiveness by Country, 2023-2033
Figure 91: Europe Market Value (US$ Mn) by Type, 2023-2033
Figure 92: Europe Market Value (US$ Mn) by Facility, 2023-2033
Figure 93: Europe Market Value (US$ Mn) by Sales Channel, 2023-2033
Figure 94: Europe Market Value (US$ Mn) by Application, 2023-2033
Figure 95: Europe Market Value (US$ Mn) by Country, 2023-2033
Figure 96: Europe Market Value (US$ Mn) Analysis by Country, 2018-2033
Figure 97: Europe Market Volume (Units) Analysis by Country, 2018-2033
Figure 98: Europe Market Value Share (%) and BPS Analysis by Country, 2023-2033
Figure 99: Europe Market Y-o-Y Growth (%) Projections by Country, 2023-2033
Figure 100: Europe Market Value (US$ Mn) Analysis by Type, 2018-2033
Figure 101: Europe Market Volume (Units) Analysis by Type, 2018-2033
Figure 102: Europe Market Value Share (%) and BPS Analysis by Type, 2023-2033
Figure 103: Europe Market Y-o-Y Growth (%) Projections by Type, 2023-2033
Figure 104: Europe Market Value (US$ Mn) Analysis by Facility, 2018-2033
Figure 105: Europe Market Volume (Units) Analysis by Facility, 2018-2033
Figure 106: Europe Market Value Share (%) and BPS Analysis by Facility, 2023-2033
Figure 107: Europe Market Y-o-Y Growth (%) Projections by Facility, 2023-2033
Figure 108: Europe Market Value (US$ Mn) Analysis by Sales Channel, 2018-2033
Figure 109: Europe Market Volume (Units) Analysis by Sales Channel, 2018-2033
Figure 110: Europe Market Value Share (%) and BPS Analysis by Sales Channel, 2023-2033
Figure 111: Europe Market Y-o-Y Growth (%) Projections by Sales Channel, 2023-2033
Figure 112: Europe Market Value (US$ Mn) Analysis by Application, 2018-2033
Figure 113: Europe Market Volume (Units) Analysis by Application, 2018-2033
Figure 114: Europe Market Value Share (%) and BPS Analysis by Application, 2023-2033
Figure 115: Europe Market Y-o-Y Growth (%) Projections by Application, 2023-2033
Figure 116: Europe Market Attractiveness by Type, 2023-2033
Figure 117: Europe Market Attractiveness by Facility, 2023-2033
Figure 118: Europe Market Attractiveness by Sales Channel, 2023-2033
Figure 119: Europe Market Attractiveness by Application, 2023-2033
Figure 120: Europe Market Attractiveness by Country, 2023-2033
Figure 121: Asia Pacific Market Value (US$ Mn) by Type, 2023-2033
Figure 122: Asia Pacific Market Value (US$ Mn) by Facility, 2023-2033
Figure 123: Asia Pacific Market Value (US$ Mn) by Sales Channel, 2023-2033
Figure 124: Asia Pacific Market Value (US$ Mn) by Application, 2023-2033
Figure 125: Asia Pacific Market Value (US$ Mn) by Country, 2023-2033
Figure 126: Asia Pacific Market Value (US$ Mn) Analysis by Country, 2018-2033
Figure 127: Asia Pacific Market Volume (Units) Analysis by Country, 2018-2033
Figure 128: Asia Pacific Market Value Share (%) and BPS Analysis by Country, 2023-2033
Figure 129: Asia Pacific Market Y-o-Y Growth (%) Projections by Country, 2023-2033
Figure 130: Asia Pacific Market Value (US$ Mn) Analysis by Type, 2018-2033
Figure 131: Asia Pacific Market Volume (Units) Analysis by Type, 2018-2033
Figure 132: Asia Pacific Market Value Share (%) and BPS Analysis by Type, 2023-2033
Figure 133: Asia Pacific Market Y-o-Y Growth (%) Projections by Type, 2023-2033
Figure 134: Asia Pacific Market Value (US$ Mn) Analysis by Facility, 2018-2033
Figure 135: Asia Pacific Market Volume (Units) Analysis by Facility, 2018-2033
Figure 136: Asia Pacific Market Value Share (%) and BPS Analysis by Facility, 2023-2033
Figure 137: Asia Pacific Market Y-o-Y Growth (%) Projections by Facility, 2023-2033
Figure 138: Asia Pacific Market Value (US$ Mn) Analysis by Sales Channel, 2018-2033
Figure 139: Asia Pacific Market Volume (Units) Analysis by Sales Channel, 2018-2033
Figure 140: Asia Pacific Market Value Share (%) and BPS Analysis by Sales Channel, 2023-2033
Figure 141: Asia Pacific Market Y-o-Y Growth (%) Projections by Sales Channel, 2023-2033
Figure 142: Asia Pacific Market Value (US$ Mn) Analysis by Application, 2018-2033
Figure 143: Asia Pacific Market Volume (Units) Analysis by Application, 2018-2033
Figure 144: Asia Pacific Market Value Share (%) and BPS Analysis by Application, 2023-2033
Figure 145: Asia Pacific Market Y-o-Y Growth (%) Projections by Application, 2023-2033
Figure 146: Asia Pacific Market Attractiveness by Type, 2023-2033
Figure 147: Asia Pacific Market Attractiveness by Facility, 2023-2033
Figure 148: Asia Pacific Market Attractiveness by Sales Channel, 2023-2033
Figure 149: Asia Pacific Market Attractiveness by Application, 2023-2033
Figure 150: Asia Pacific Market Attractiveness by Country, 2023-2033
Figure 151: MEA Market Value (US$ Mn) by Type, 2023-2033
Figure 152: MEA Market Value (US$ Mn) by Facility, 2023-2033
Figure 153: MEA Market Value (US$ Mn) by Sales Channel, 2023-2033
Figure 154: MEA Market Value (US$ Mn) by Application, 2023-2033
Figure 155: MEA Market Value (US$ Mn) by Country, 2023-2033
Figure 156: MEA Market Value (US$ Mn) Analysis by Country, 2018-2033
Figure 157: MEA Market Volume (Units) Analysis by Country, 2018-2033
Figure 158: MEA Market Value Share (%) and BPS Analysis by Country, 2023-2033
Figure 159: MEA Market Y-o-Y Growth (%) Projections by Country, 2023-2033
Figure 160: MEA Market Value (US$ Mn) Analysis by Type, 2018-2033
Figure 161: MEA Market Volume (Units) Analysis by Type, 2018-2033
Figure 162: MEA Market Value Share (%) and BPS Analysis by Type, 2023-2033
Figure 163: MEA Market Y-o-Y Growth (%) Projections by Type, 2023-2033
Figure 164: MEA Market Value (US$ Mn) Analysis by Facility, 2018-2033
Figure 165: MEA Market Volume (Units) Analysis by Facility, 2018-2033
Figure 166: MEA Market Value Share (%) and BPS Analysis by Facility, 2023-2033
Figure 167: MEA Market Y-o-Y Growth (%) Projections by Facility, 2023-2033
Figure 168: MEA Market Value (US$ Mn) Analysis by Sales Channel, 2018-2033
Figure 169: MEA Market Volume (Units) Analysis by Sales Channel, 2018-2033
Figure 170: MEA Market Value Share (%) and BPS Analysis by Sales Channel, 2023-2033
Figure 171: MEA Market Y-o-Y Growth (%) Projections by Sales Channel, 2023-2033
Figure 172: MEA Market Value (US$ Mn) Analysis by Application, 2018-2033
Figure 173: MEA Market Volume (Units) Analysis by Application, 2018-2033
Figure 174: MEA Market Value Share (%) and BPS Analysis by Application, 2023-2033
Figure 175: MEA Market Y-o-Y Growth (%) Projections by Application, 2023-2033
Figure 176: MEA Market Attractiveness by Type, 2023-2033
Figure 177: MEA Market Attractiveness by Facility, 2023-2033
Figure 178: MEA Market Attractiveness by Sales Channel, 2023-2033
Figure 179: MEA Market Attractiveness by Application, 2023-2033
Figure 180: MEA Market Attractiveness by Country, 2023-2033
Need specific information?
Request CustomizationExplore Food and Beverage Insights
View Reports