Automatic Hog Feeder Market Size and Share Forecast Outlook 2023 to 2033

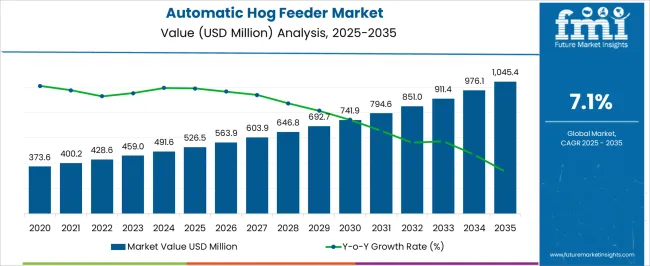
By 2033, the sector is expected to expand significantly at a 7.1% CAGR. According to FMI, the revenue share of the automatic hog feeder market is predicted to rise from USD 459 million in 2023 to USD 911 million in 2033.

A key factor influencing the demand for automatic hog feeders is rising meat consumption. The livestock industry is under increasing pressure to meet the growing demand for high-value animal protein. In order to boost quality and productivity, livestock farmers are increasingly in need of an automatic hog feeders.

Due to the inefficiency of manual machinery and the high labor expenses associated with operating manual feeders, the sales of automatic hog feeders have increased. Automatic hog feeder makers are developing user-friendly and practical machines for better profit margins.

Due to the growing hog population and rise in disposable income, automatic hog feeder adoption has increased. Additionally, farmers are interested in employing automatic hog feeders to enhance hog productivity, with surging demand for hog meat and associated goods globally.

Attributes Details
Automatic Hog Feeder Market CAGR (2023 to 2033) 7.1%
Automatic Hog Feeder Market Size (2023) USD 459 million
Automatic Hog Feeder Market Size (2033) USD 911 million

2016 to 2022 Performance vs 2023 to 2033 Forecast for Automatic Hog Feeder Market

When compared to the 6.4% CAGR recorded between 2016 and 2022, the automatic hog feeder industry is predicted to expand at a 7.1% CAGR between 2023 and 2033. The average growth of the market is expected to be around 1.07x between 2022 and 2023.

Market Statistics Details
Market Share (2016) USD 296.1 million
Market Share (2021) USD 403.0 million
Market Share (2022) USD 428.6 million

Short-term Growth (2023 to 2026): the industry is anticipated to gain in the short term from technological advances, such as better sensors that enable more precise and effective feeding.

Medium-term Growth (2027 to 2029): precision livestock farming is a growing trend that is predicted to increase demand for an automated hog feeder.

Long-term Growth (2030 to 2033): the growing demand for automated hog feeders could be attributed to the rising popularity of substitute proteins like plant-based proteins.

Recent innovations like automatic weighing and biometrics affect global market growth. Hog management software's use of biometric sensors makes it possible to monitor more animals with fewer staff members. It gives accurate and unbiased information on their health and welfare.

Latest Trends Reshaping the Automatic Hog Feeder Market Share

  • Growing Preference for Smart Technology: in the hog-feeding sector, smart technology is gaining popularity. The development of automated hog feeders with cutting-edge features like Wi-Fi connectivity makes the process easy. Moreover, remote monitoring and even machine learning capabilities have made it possible for farmers to oversee and manage their hog-feeding operations from any location.
  • Innovations in Feeding Technology: the hog automatic feeder sector is continually evolving, introducing new products and technology to boost efficiency, cost-effectiveness, and safety. In order to increase efficiency and dependability, automated hog feeders are being built with features including feeding schedules, customizable
  • Growing Focus on Animal Welfare: with producers looking for ways to enhance animal health, animal welfare is becoming a focus that is increasingly significant in the automatic hog feeder sector. Automated hog feeders are being developed to offer reliable nutrition with less stress on the animals and to cut labor costs.

Category-wise Analysis of the Automatic Hog Feeder Industry

Infant v/s Adult Feeder: Popular System in the Global Market

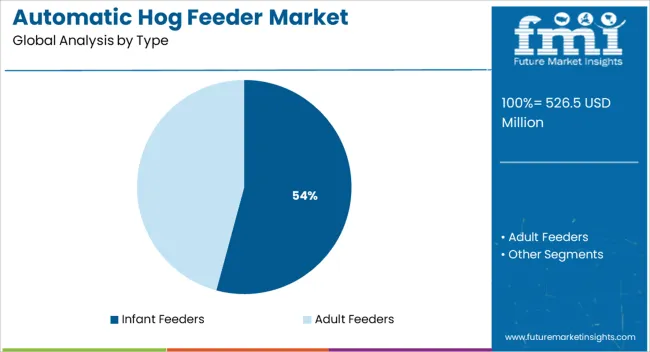
Over the forecast period, the infant automatic hog feeder segment is expected to dominate the market. Growth is credited to the companies' investments in research and development to create new technology for infant hog feeders that are effective and nutritionally superior.

The need for young hog feeders is also being driven by governmental laws and customer preferences for ethical animal treatment. However, the adult automatic hog feeder segment is anticipated to experience considerable expansion.

Based on Material, Which Sub-segment has Most Potential in the Market?

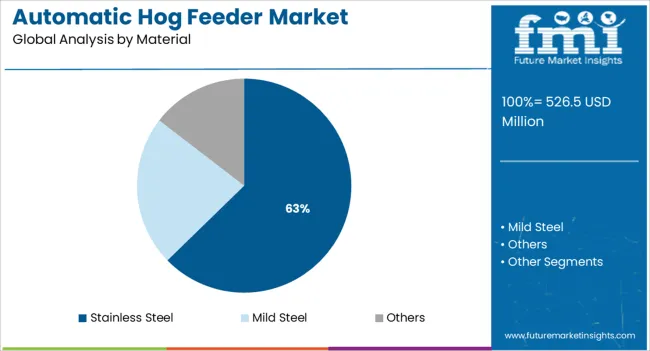
During the forecast period, stainless steel automatic hog feeders are anticipated to lead the market share in terms of volume and value. Stainless steel is frequently used to produce hog feeders due to its improved corrosion-resistant qualities, longer product life, and simplicity of maintenance.

Stainless steel is a very ductile substance that can be used to create intricate components for automatic hog feeders. The segment's appeal is also owed to the fact that it is resistant to oxidation and abrasion and is renowned for its exceptional strength and durability.

Due to its low price, mild steel automatic hog feeders are anticipated to grow at a moderate rate throughout the projection period. Additionally, mild steel automatic hog feeders are simple to install and have a low material weight. As they can survive high temperatures and are resistant to wear and strain, the demand is expected to increase significantly.
Regional Trends Shaping the Automatic Hog Feeder Market

United States Large-scale Businesses - New Trend towards Market Expansion

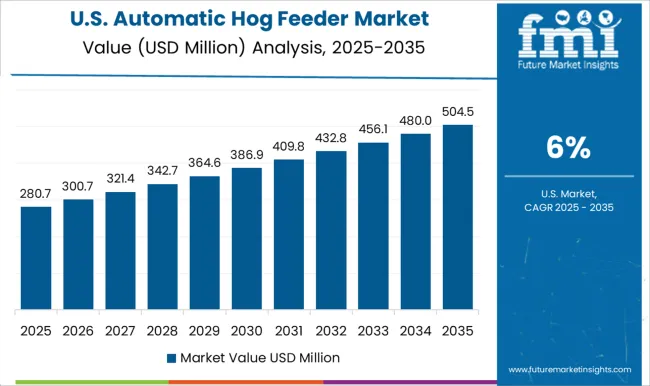
The USA dominated the automatic hog feeder market with a share of 30.1%, and worth USD 129 million in 2022. The market is expanding due to the rising costs of human labor and rising consumer desire for automation and convenience.

Another factor boosting demand for automatic hog feeders is growing consumer concern over animal welfare and the value of providing hogs with a healthy diet.

The growing trend toward large-scale farming operations necessitates the use of automated systems to save time, money, and labor. As a result, the market in the USA is projected to witness significant growth during the forecast period.

United Kingdom Builds Platform for New Developments

Attributes Statistics
United Kingdom Market Value 2022 USD 38.9 million
United Kingdom Market Value 2033 USD 81.1 million
United Kingdom Market Share (2023 to 2033) 9.1%
United Kingdom Market CAGR (2023 to 2033) 7.6%

The rising desire for automated technologies to assist farmers in managing their animals is fueling this expansion. In the United Kingdom, intelligent automated feeders are becoming common, as they provide better control over feed quantity, nutrition, and timing.

The project calls for the construction of an automatic feeding system that provides the pig's food at regular intervals and is able to keep track of their well-being. Other initiatives include installing automatic feeders in the pig unit of the National Pig Association and installing a monitoring system for the well-being of the pigs in the pig unit of the University of Warwick.
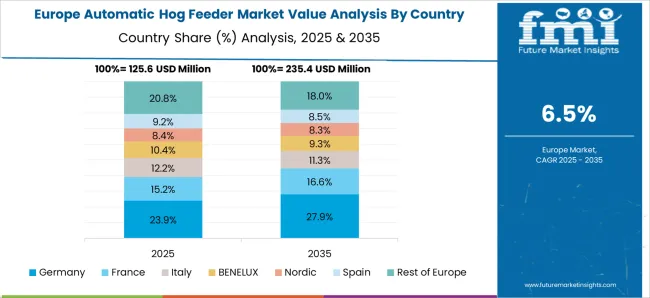
Germany Automatic Hog Feeder Industry - Leading Market Share in Europe

Germany dominated the Europe automatic hog feeder sector with a share of 19.9%, and worth USD 85.2 million in 2022. This is attributed to the constant efforts by key players in Germany.

  • Rauch Agrartechnik GmbH: the Rauch Hog Feeder, is a fully automated feeder that can be used for both pigs and sows. The Rauch Bulk Feeder, a bulk feeder for bigger groups of hogs, is just one of the products they provide. A variety of other items are also available from the company, including temperature control systems and handling and cleaning systems.
  • Big Dutchman: The Big Dutchman Auto Hog Feeder, a completely automated device that can be used for up to 500 hogs, is one of the many feeders they have to offer. Additionally, they provide the Big Dutchman Bulk Feeder and the Big Dutchman Silo Feeder, which are feeders for large groups of pigs or sows.

China & India Projects Provide Amazing Opportunities to the Key Players

Country China
Market Share (2022) 10.1%
CAGR (2023 to 2033) 5.7%
Market Value (2022) USD 43.29 million
Market Value (2033) USD 75.3 million
Country India
Market Share (2022) 8.3%
CAGR (2023 to 2033) 3.9%
Market Value (2022) USD 16.6 million
Market Value (2033) USD 37 million

Some of the related projects in China that raise the automatic hog feeder adoption rates:

  • Beijing Sanki Automation Technology Co., Ltd: China's demand for the automatic hog feeder is dominated by Beijing Sanki. Their automatic hog feeder was created using cutting-edge technology and has a touchscreen control panel, automatic feeder control system, and stainless steel hopper.
  • Zhengzhou Sincola Machinery Co., Ltd.: Another significant company in the China industry for automatic hog feeders is Zhengzhou Sincola. They have many different automatic hog feeders available, including automatic pig feeders, agitator feeders, liquid feeders, and dry feeders.

Indian Market Outlook

The automatic hog feeder business in India is expected to witness significant growth during the forecast period. It is fueled by the growing need for automated animal husbandry solutions.

The market in India is anticipated to increase in response to the growing demand from the agriculture industry for better farming techniques. Government programs to support animal husbandry and the implementation of various animal welfare laws are adding up to the market value.

Japan to Establish a Solid Base in the Automatic Hog Feeders Market

The rise in small-scale hog farms and the need to cut labor costs are the main factors driving the market. The market was worth USD 18.8 million in 2022, with a share of 4.4%. and is expected to grow further in the coming years. The major players in the market include Hasegawa, Takasaka, and Ushio.

These companies manufacture a wide range of automatic hog feeders, ranging from simple models to advanced ones with features such as automatic cleaning systems.

Many of these businesses have also created mobile apps that let farmers check on the performance of the feeder from a distance. The government's initiatives to encourage the adoption of innovative technology in the agriculture industry are anticipated to help the market.

Start-up Strategies Transforming the Automatic Hog Feeder Landscape

The reason for successful start-ups in the industry is that a large amount of demand is not particularly hard to find. In low-bandwidth environments and areas with low cost through distribution, start-ups arose from companies that were able to sell to consumers directly or through resellers.

The growth required was driven by an existing need. In contrast, companies that are trying to enter markets where there is already competition encounter a problem:

  • Already existing firms may be very good at meeting those needs.
  • The resources necessary to develop a product and sell it into such a market may exceed the company's financial capabilities.

Both problems need adequate attention to make a stronghold in the market. For instance, a Pune-based business called Prima Agrotech has created an automatic hog feeder that can be set to release food at predetermined intervals. A mobile app can be used to remotely monitor the feeder as well.
Marketing-Focused Growth Strategies by Key Players in the Automatic Hog Feeder Market

Due to the presence of established players worldwide, the market is very competitive. In order to produce new technologies that are used to improve the performance of their current products, players are heavily spending on research and development.

Key players are also investing heavily in marketing and promotional activities to gain a competitive edge over their competitors. Moreover, these players are also focusing on strategic collaborations and partnerships to expand their product portfolio and capture a large market share.

Recent Developments

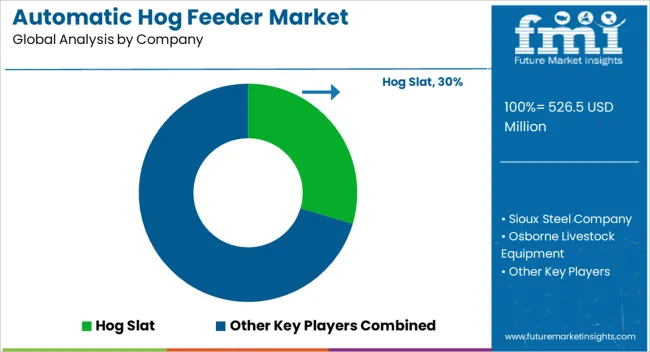
  • A range of hog feeders that help the pigs from birth to market is produced and sold by Hog Slat. Models of sow feeders, finishing feeders, nursery feeders, and baby pig creep feeders are available from Hog Slat. They also created the SowMax Ad Lib Feeder, the most cutting-edge sow feeding system on the market.
  • Three new developments in animal and aqua feed equipment were introduced by ANDRITZ in May 2022: the micro feed system, the 3-Rolls assembly upgrade for the Paladin 2000, and the metrics vibe. The aqua feed-specific extruder is used in this micro feed system. When compared to conventional extrusion machines, the technology increases capacity by 40% with a size of less than 2mm.
  • The Kahl Group member F.H. Schule Mühlenbau and Bratney Companies signed a strategic partnership agreement in July 2019. This partnership includes joint distributorship, sales, and promotional efforts in the USA for both new and existing milling facilities.

Leading Companies in the Automatic Hog Feeder Market

  • Hog Slat
  • PS Operating Company LLC
  • Osborne Livestock Equipment
  • Sioux Steel Company
  • CountyLine
  • O’Mara
  • Fancom BV
  • Big Herdsman Machinery
  • Behlen Country
  • Miller Manufacturing Company

Key Segments

By Type:

  • Infant Feeders
  • Adult feeders

By Material:

  • Stainless Steel
  • Mild Steel
  • Others

By Application:

  • Hunting
  • Domestic Farm

By Sales Channel:

  • Direct Sales
  • Agro Sales

By Region:

  • North America
  • Latin America
  • Europe
  • East Asia
  • South Asia Pacific
  • Middle East and Africa

Table of Content

  • 1. Executive Summary
  • 2. Market Overview
  • 3. Market Background
  • 4. Global Market Analysis 2018 to 2022 and Forecast, 2023 to 2033
  • 5. Global Market Analysis 2018 to 2022 and Forecast 2023 to 2033, By Type
    • 5.1. Infant Feeders
    • 5.2. Adult Feeders
  • 6. Global Market Analysis 2018 to 2022 and Forecast 2023 to 2033, By Material
    • 6.1. Stainless Steel
    • 6.2. Mild Steel
    • 6.3. Others
  • 7. Global Market Analysis 2018 to 2022 and Forecast 2023 to 2033, By Application
    • 7.1. Hunting
    • 7.2. Domestic Farm
  • 8. Global Market Analysis 2018 to 2022 and Forecast 2023 to 2033, By Sales Channel
    • 8.1. Direct Sales
    • 8.2. Agro Stores
    • 8.3. Y-o-Y Growth Trend Analysis By Sales Channel, 2018 to 2022
    • 8.4. Absolute $ Opportunity Analysis By Sales Channel, 2023 to 2033
  • 9. Global Market Analysis 2018 to 2022 and Forecast 2023 to 2033, By Region
    • 9.1. North America
    • 9.2. Latin America
    • 9.3. Europe
    • 9.4. Asia Pacific
    • 9.5. Middle East and Africa (MEA)
  • 10. North America Market Analysis 2018 to 2022 and Forecast 2023 to 2033, By Country
  • 11. Latin America Market Analysis 2018 to 2022 and Forecast 2023 to 2033, By Country
  • 12. Europe Market Analysis 2018 to 2022 and Forecast 2023 to 2033, By Country
  • 13. Asia Pacific Market Analysis 2018 to 2022 and Forecast 2023 to 2033, By Country
  • 14. MEA Market Analysis 2018 to 2022 and Forecast 2023 to 2033, By Country
  • 15. Key Countries Market Analysis
  • 16. Market Structure Analysis
  • 17. Competition Analysis
    • 17.1. Hog Slat
    • 17.2. Sioux Steel Company
    • 17.3. Osborne Livestock Equipment
    • 17.4. PS Operating Company LLC.
    • 17.5. CountyLine
    • 17.6. Miller Manufacturing Company
    • 17.7. Behlen Country
    • 17.8. Big Herdsman Machinery
    • 17.9. O'Mara
    • 17.10. Fancom BV
  • 18. Assumptions & Acronyms Used
  • 19. Research Methodology

List of Tables

Table 1: Global Market Value (US$ Million) Forecast by Region, 2018 to 2033

Table 2: Global Market Volume (Units) Forecast by Region, 2018 to 2033

Table 3: Global Market Value (US$ Million) Forecast by Type, 2018 to 2033

Table 4: Global Market Volume (Units) Forecast by Type, 2018 to 2033

Table 5: Global Market Value (US$ Million) Forecast by Material, 2018 to 2033

Table 6: Global Market Volume (Units) Forecast by Material, 2018 to 2033

Table 7: Global Market Value (US$ Million) Forecast by Application, 2018 to 2033

Table 8: Global Market Volume (Units) Forecast by Application, 2018 to 2033

Table 9: Global Market Value (US$ Million) Forecast by Sales Channel, 2018 to 2033

Table 10: Global Market Volume (Units) Forecast by Sales Channel, 2018 to 2033

Table 11: North America Market Value (US$ Million) Forecast by Country, 2018 to 2033

Table 12: North America Market Volume (Units) Forecast by Country, 2018 to 2033

Table 13: North America Market Value (US$ Million) Forecast by Type, 2018 to 2033

Table 14: North America Market Volume (Units) Forecast by Type, 2018 to 2033

Table 15: North America Market Value (US$ Million) Forecast by Material, 2018 to 2033

Table 16: North America Market Volume (Units) Forecast by Material, 2018 to 2033

Table 17: North America Market Value (US$ Million) Forecast by Application, 2018 to 2033

Table 18: North America Market Volume (Units) Forecast by Application, 2018 to 2033

Table 19: North America Market Value (US$ Million) Forecast by Sales Channel, 2018 to 2033

Table 20: North America Market Volume (Units) Forecast by Sales Channel, 2018 to 2033

Table 21: Latin America Market Value (US$ Million) Forecast by Country, 2018 to 2033

Table 22: Latin America Market Volume (Units) Forecast by Country, 2018 to 2033

Table 23: Latin America Market Value (US$ Million) Forecast by Type, 2018 to 2033

Table 24: Latin America Market Volume (Units) Forecast by Type, 2018 to 2033

Table 25: Latin America Market Value (US$ Million) Forecast by Material, 2018 to 2033

Table 26: Latin America Market Volume (Units) Forecast by Material, 2018 to 2033

Table 27: Latin America Market Value (US$ Million) Forecast by Application, 2018 to 2033

Table 28: Latin America Market Volume (Units) Forecast by Application, 2018 to 2033

Table 29: Latin America Market Value (US$ Million) Forecast by Sales Channel, 2018 to 2033

Table 30: Latin America Market Volume (Units) Forecast by Sales Channel, 2018 to 2033

Table 31: Europe Market Value (US$ Million) Forecast by Country, 2018 to 2033

Table 32: Europe Market Volume (Units) Forecast by Country, 2018 to 2033

Table 33: Europe Market Value (US$ Million) Forecast by Type, 2018 to 2033

Table 34: Europe Market Volume (Units) Forecast by Type, 2018 to 2033

Table 35: Europe Market Value (US$ Million) Forecast by Material, 2018 to 2033

Table 36: Europe Market Volume (Units) Forecast by Material, 2018 to 2033

Table 37: Europe Market Value (US$ Million) Forecast by Application, 2018 to 2033

Table 38: Europe Market Volume (Units) Forecast by Application, 2018 to 2033

Table 39: Europe Market Value (US$ Million) Forecast by Sales Channel, 2018 to 2033

Table 40: Europe Market Volume (Units) Forecast by Sales Channel, 2018 to 2033

Table 41: Asia Pacific Market Value (US$ Million) Forecast by Country, 2018 to 2033

Table 42: Asia Pacific Market Volume (Units) Forecast by Country, 2018 to 2033

Table 43: Asia Pacific Market Value (US$ Million) Forecast by Type, 2018 to 2033

Table 44: Asia Pacific Market Volume (Units) Forecast by Type, 2018 to 2033

Table 45: Asia Pacific Market Value (US$ Million) Forecast by Material, 2018 to 2033

Table 46: Asia Pacific Market Volume (Units) Forecast by Material, 2018 to 2033

Table 47: Asia Pacific Market Value (US$ Million) Forecast by Application, 2018 to 2033

Table 48: Asia Pacific Market Volume (Units) Forecast by Application, 2018 to 2033

Table 49: Asia Pacific Market Value (US$ Million) Forecast by Sales Channel, 2018 to 2033

Table 50: Asia Pacific Market Volume (Units) Forecast by Sales Channel, 2018 to 2033

Table 51: MEA Market Value (US$ Million) Forecast by Country, 2018 to 2033

Table 52: MEA Market Volume (Units) Forecast by Country, 2018 to 2033

Table 53: MEA Market Value (US$ Million) Forecast by Type, 2018 to 2033

Table 54: MEA Market Volume (Units) Forecast by Type, 2018 to 2033

Table 55: MEA Market Value (US$ Million) Forecast by Material, 2018 to 2033

Table 56: MEA Market Volume (Units) Forecast by Material, 2018 to 2033

Table 57: MEA Market Value (US$ Million) Forecast by Application, 2018 to 2033

Table 58: MEA Market Volume (Units) Forecast by Application, 2018 to 2033

Table 59: MEA Market Value (US$ Million) Forecast by Sales Channel, 2018 to 2033

Table 60: MEA Market Volume (Units) Forecast by Sales Channel, 2018 to 2033

List of Figures

Figure 1: Global Market Value (US$ Million) by Type, 2023 to 2033

Figure 2: Global Market Value (US$ Million) by Material, 2023 to 2033

Figure 3: Global Market Value (US$ Million) by Application, 2023 to 2033

Figure 4: Global Market Value (US$ Million) by Sales Channel, 2023 to 2033

Figure 5: Global Market Value (US$ Million) by Region, 2023 to 2033

Figure 6: Global Market Value (US$ Million) Analysis by Region, 2018 to 2033

Figure 7: Global Market Volume (Units) Analysis by Region, 2018 to 2033

Figure 8: Global Market Value Share (%) and BPS Analysis by Region, 2023 to 2033

Figure 9: Global Market Y-o-Y Growth (%) Projections by Region, 2023 to 2033

Figure 10: Global Market Value (US$ Million) Analysis by Type, 2018 to 2033

Figure 11: Global Market Volume (Units) Analysis by Type, 2018 to 2033

Figure 12: Global Market Value Share (%) and BPS Analysis by Type, 2023 to 2033

Figure 13: Global Market Y-o-Y Growth (%) Projections by Type, 2023 to 2033

Figure 14: Global Market Value (US$ Million) Analysis by Material, 2018 to 2033

Figure 15: Global Market Volume (Units) Analysis by Material, 2018 to 2033

Figure 16: Global Market Value Share (%) and BPS Analysis by Material, 2023 to 2033

Figure 17: Global Market Y-o-Y Growth (%) Projections by Material, 2023 to 2033

Figure 18: Global Market Value (US$ Million) Analysis by Application, 2018 to 2033

Figure 19: Global Market Volume (Units) Analysis by Application, 2018 to 2033

Figure 20: Global Market Value Share (%) and BPS Analysis by Application, 2023 to 2033

Figure 21: Global Market Y-o-Y Growth (%) Projections by Application, 2023 to 2033

Figure 22: Global Market Value (US$ Million) Analysis by Sales Channel, 2018 to 2033

Figure 23: Global Market Volume (Units) Analysis by Sales Channel, 2018 to 2033

Figure 24: Global Market Value Share (%) and BPS Analysis by Sales Channel, 2023 to 2033

Figure 25: Global Market Y-o-Y Growth (%) Projections by Sales Channel, 2023 to 2033

Figure 26: Global Market Attractiveness by Type, 2023 to 2033

Figure 27: Global Market Attractiveness by Material, 2023 to 2033

Figure 28: Global Market Attractiveness by Application, 2023 to 2033

Figure 29: Global Market Attractiveness by Sales Channel, 2023 to 2033

Figure 30: Global Market Attractiveness by Region, 2023 to 2033

Figure 31: North America Market Value (US$ Million) by Type, 2023 to 2033

Figure 32: North America Market Value (US$ Million) by Material, 2023 to 2033

Figure 33: North America Market Value (US$ Million) by Application, 2023 to 2033

Figure 34: North America Market Value (US$ Million) by Sales Channel, 2023 to 2033

Figure 35: North America Market Value (US$ Million) by Country, 2023 to 2033

Figure 36: North America Market Value (US$ Million) Analysis by Country, 2018 to 2033

Figure 37: North America Market Volume (Units) Analysis by Country, 2018 to 2033

Figure 38: North America Market Value Share (%) and BPS Analysis by Country, 2023 to 2033

Figure 39: North America Market Y-o-Y Growth (%) Projections by Country, 2023 to 2033

Figure 40: North America Market Value (US$ Million) Analysis by Type, 2018 to 2033

Figure 41: North America Market Volume (Units) Analysis by Type, 2018 to 2033

Figure 42: North America Market Value Share (%) and BPS Analysis by Type, 2023 to 2033

Figure 43: North America Market Y-o-Y Growth (%) Projections by Type, 2023 to 2033

Figure 44: North America Market Value (US$ Million) Analysis by Material, 2018 to 2033

Figure 45: North America Market Volume (Units) Analysis by Material, 2018 to 2033

Figure 46: North America Market Value Share (%) and BPS Analysis by Material, 2023 to 2033

Figure 47: North America Market Y-o-Y Growth (%) Projections by Material, 2023 to 2033

Figure 48: North America Market Value (US$ Million) Analysis by Application, 2018 to 2033

Figure 49: North America Market Volume (Units) Analysis by Application, 2018 to 2033

Figure 50: North America Market Value Share (%) and BPS Analysis by Application, 2023 to 2033

Figure 51: North America Market Y-o-Y Growth (%) Projections by Application, 2023 to 2033

Figure 52: North America Market Value (US$ Million) Analysis by Sales Channel, 2018 to 2033

Figure 53: North America Market Volume (Units) Analysis by Sales Channel, 2018 to 2033

Figure 54: North America Market Value Share (%) and BPS Analysis by Sales Channel, 2023 to 2033

Figure 55: North America Market Y-o-Y Growth (%) Projections by Sales Channel, 2023 to 2033

Figure 56: North America Market Attractiveness by Type, 2023 to 2033

Figure 57: North America Market Attractiveness by Material, 2023 to 2033

Figure 58: North America Market Attractiveness by Application, 2023 to 2033

Figure 59: North America Market Attractiveness by Sales Channel, 2023 to 2033

Figure 60: North America Market Attractiveness by Country, 2023 to 2033

Figure 61: Latin America Market Value (US$ Million) by Type, 2023 to 2033

Figure 62: Latin America Market Value (US$ Million) by Material, 2023 to 2033

Figure 63: Latin America Market Value (US$ Million) by Application, 2023 to 2033

Figure 64: Latin America Market Value (US$ Million) by Sales Channel, 2023 to 2033

Figure 65: Latin America Market Value (US$ Million) by Country, 2023 to 2033

Figure 66: Latin America Market Value (US$ Million) Analysis by Country, 2018 to 2033

Figure 67: Latin America Market Volume (Units) Analysis by Country, 2018 to 2033

Figure 68: Latin America Market Value Share (%) and BPS Analysis by Country, 2023 to 2033

Figure 69: Latin America Market Y-o-Y Growth (%) Projections by Country, 2023 to 2033

Figure 70: Latin America Market Value (US$ Million) Analysis by Type, 2018 to 2033

Figure 71: Latin America Market Volume (Units) Analysis by Type, 2018 to 2033

Figure 72: Latin America Market Value Share (%) and BPS Analysis by Type, 2023 to 2033

Figure 73: Latin America Market Y-o-Y Growth (%) Projections by Type, 2023 to 2033

Figure 74: Latin America Market Value (US$ Million) Analysis by Material, 2018 to 2033

Figure 75: Latin America Market Volume (Units) Analysis by Material, 2018 to 2033

Figure 76: Latin America Market Value Share (%) and BPS Analysis by Material, 2023 to 2033

Figure 77: Latin America Market Y-o-Y Growth (%) Projections by Material, 2023 to 2033

Figure 78: Latin America Market Value (US$ Million) Analysis by Application, 2018 to 2033

Figure 79: Latin America Market Volume (Units) Analysis by Application, 2018 to 2033

Figure 80: Latin America Market Value Share (%) and BPS Analysis by Application, 2023 to 2033

Figure 81: Latin America Market Y-o-Y Growth (%) Projections by Application, 2023 to 2033

Figure 82: Latin America Market Value (US$ Million) Analysis by Sales Channel, 2018 to 2033

Figure 83: Latin America Market Volume (Units) Analysis by Sales Channel, 2018 to 2033

Figure 84: Latin America Market Value Share (%) and BPS Analysis by Sales Channel, 2023 to 2033

Figure 85: Latin America Market Y-o-Y Growth (%) Projections by Sales Channel, 2023 to 2033

Figure 86: Latin America Market Attractiveness by Type, 2023 to 2033

Figure 87: Latin America Market Attractiveness by Material, 2023 to 2033

Figure 88: Latin America Market Attractiveness by Application, 2023 to 2033

Figure 89: Latin America Market Attractiveness by Sales Channel, 2023 to 2033

Figure 90: Latin America Market Attractiveness by Country, 2023 to 2033

Figure 91: Europe Market Value (US$ Million) by Type, 2023 to 2033

Figure 92: Europe Market Value (US$ Million) by Material, 2023 to 2033

Figure 93: Europe Market Value (US$ Million) by Application, 2023 to 2033

Figure 94: Europe Market Value (US$ Million) by Sales Channel, 2023 to 2033

Figure 95: Europe Market Value (US$ Million) by Country, 2023 to 2033

Figure 96: Europe Market Value (US$ Million) Analysis by Country, 2018 to 2033

Figure 97: Europe Market Volume (Units) Analysis by Country, 2018 to 2033

Figure 98: Europe Market Value Share (%) and BPS Analysis by Country, 2023 to 2033

Figure 99: Europe Market Y-o-Y Growth (%) Projections by Country, 2023 to 2033

Figure 100: Europe Market Value (US$ Million) Analysis by Type, 2018 to 2033

Figure 101: Europe Market Volume (Units) Analysis by Type, 2018 to 2033

Figure 102: Europe Market Value Share (%) and BPS Analysis by Type, 2023 to 2033

Figure 103: Europe Market Y-o-Y Growth (%) Projections by Type, 2023 to 2033

Figure 104: Europe Market Value (US$ Million) Analysis by Material, 2018 to 2033

Figure 105: Europe Market Volume (Units) Analysis by Material, 2018 to 2033

Figure 106: Europe Market Value Share (%) and BPS Analysis by Material, 2023 to 2033

Figure 107: Europe Market Y-o-Y Growth (%) Projections by Material, 2023 to 2033

Figure 108: Europe Market Value (US$ Million) Analysis by Application, 2018 to 2033

Figure 109: Europe Market Volume (Units) Analysis by Application, 2018 to 2033

Figure 110: Europe Market Value Share (%) and BPS Analysis by Application, 2023 to 2033

Figure 111: Europe Market Y-o-Y Growth (%) Projections by Application, 2023 to 2033

Figure 112: Europe Market Value (US$ Million) Analysis by Sales Channel, 2018 to 2033

Figure 113: Europe Market Volume (Units) Analysis by Sales Channel, 2018 to 2033

Figure 114: Europe Market Value Share (%) and BPS Analysis by Sales Channel, 2023 to 2033

Figure 115: Europe Market Y-o-Y Growth (%) Projections by Sales Channel, 2023 to 2033

Figure 116: Europe Market Attractiveness by Type, 2023 to 2033

Figure 117: Europe Market Attractiveness by Material, 2023 to 2033

Figure 118: Europe Market Attractiveness by Application, 2023 to 2033

Figure 119: Europe Market Attractiveness by Sales Channel, 2023 to 2033

Figure 120: Europe Market Attractiveness by Country, 2023 to 2033

Figure 121: Asia Pacific Market Value (US$ Million) by Type, 2023 to 2033

Figure 122: Asia Pacific Market Value (US$ Million) by Material, 2023 to 2033

Figure 123: Asia Pacific Market Value (US$ Million) by Application, 2023 to 2033

Figure 124: Asia Pacific Market Value (US$ Million) by Sales Channel, 2023 to 2033

Figure 125: Asia Pacific Market Value (US$ Million) by Country, 2023 to 2033

Figure 126: Asia Pacific Market Value (US$ Million) Analysis by Country, 2018 to 2033

Figure 127: Asia Pacific Market Volume (Units) Analysis by Country, 2018 to 2033

Figure 128: Asia Pacific Market Value Share (%) and BPS Analysis by Country, 2023 to 2033

Figure 129: Asia Pacific Market Y-o-Y Growth (%) Projections by Country, 2023 to 2033

Figure 130: Asia Pacific Market Value (US$ Million) Analysis by Type, 2018 to 2033

Figure 131: Asia Pacific Market Volume (Units) Analysis by Type, 2018 to 2033

Figure 132: Asia Pacific Market Value Share (%) and BPS Analysis by Type, 2023 to 2033

Figure 133: Asia Pacific Market Y-o-Y Growth (%) Projections by Type, 2023 to 2033

Figure 134: Asia Pacific Market Value (US$ Million) Analysis by Material, 2018 to 2033

Figure 135: Asia Pacific Market Volume (Units) Analysis by Material, 2018 to 2033

Figure 136: Asia Pacific Market Value Share (%) and BPS Analysis by Material, 2023 to 2033

Figure 137: Asia Pacific Market Y-o-Y Growth (%) Projections by Material, 2023 to 2033

Figure 138: Asia Pacific Market Value (US$ Million) Analysis by Application, 2018 to 2033

Figure 139: Asia Pacific Market Volume (Units) Analysis by Application, 2018 to 2033

Figure 140: Asia Pacific Market Value Share (%) and BPS Analysis by Application, 2023 to 2033

Figure 141: Asia Pacific Market Y-o-Y Growth (%) Projections by Application, 2023 to 2033

Figure 142: Asia Pacific Market Value (US$ Million) Analysis by Sales Channel, 2018 to 2033

Figure 143: Asia Pacific Market Volume (Units) Analysis by Sales Channel, 2018 to 2033

Figure 144: Asia Pacific Market Value Share (%) and BPS Analysis by Sales Channel, 2023 to 2033

Figure 145: Asia Pacific Market Y-o-Y Growth (%) Projections by Sales Channel, 2023 to 2033

Figure 146: Asia Pacific Market Attractiveness by Type, 2023 to 2033

Figure 147: Asia Pacific Market Attractiveness by Material, 2023 to 2033

Figure 148: Asia Pacific Market Attractiveness by Application, 2023 to 2033

Figure 149: Asia Pacific Market Attractiveness by Sales Channel, 2023 to 2033

Figure 150: Asia Pacific Market Attractiveness by Country, 2023 to 2033

Figure 151: MEA Market Value (US$ Million) by Type, 2023 to 2033

Figure 152: MEA Market Value (US$ Million) by Material, 2023 to 2033

Figure 153: MEA Market Value (US$ Million) by Application, 2023 to 2033

Figure 154: MEA Market Value (US$ Million) by Sales Channel, 2023 to 2033

Figure 155: MEA Market Value (US$ Million) by Country, 2023 to 2033

Figure 156: MEA Market Value (US$ Million) Analysis by Country, 2018 to 2033

Figure 157: MEA Market Volume (Units) Analysis by Country, 2018 to 2033

Figure 158: MEA Market Value Share (%) and BPS Analysis by Country, 2023 to 2033

Figure 159: MEA Market Y-o-Y Growth (%) Projections by Country, 2023 to 2033

Figure 160: MEA Market Value (US$ Million) Analysis by Type, 2018 to 2033

Figure 161: MEA Market Volume (Units) Analysis by Type, 2018 to 2033

Figure 162: MEA Market Value Share (%) and BPS Analysis by Type, 2023 to 2033

Figure 163: MEA Market Y-o-Y Growth (%) Projections by Type, 2023 to 2033

Figure 164: MEA Market Value (US$ Million) Analysis by Material, 2018 to 2033

Figure 165: MEA Market Volume (Units) Analysis by Material, 2018 to 2033

Figure 166: MEA Market Value Share (%) and BPS Analysis by Material, 2023 to 2033

Figure 167: MEA Market Y-o-Y Growth (%) Projections by Material, 2023 to 2033

Figure 168: MEA Market Value (US$ Million) Analysis by Application, 2018 to 2033

Figure 169: MEA Market Volume (Units) Analysis by Application, 2018 to 2033

Figure 170: MEA Market Value Share (%) and BPS Analysis by Application, 2023 to 2033

Figure 171: MEA Market Y-o-Y Growth (%) Projections by Application, 2023 to 2033

Figure 172: MEA Market Value (US$ Million) Analysis by Sales Channel, 2018 to 2033

Figure 173: MEA Market Volume (Units) Analysis by Sales Channel, 2018 to 2033

Figure 174: MEA Market Value Share (%) and BPS Analysis by Sales Channel, 2023 to 2033

Figure 175: MEA Market Y-o-Y Growth (%) Projections by Sales Channel, 2023 to 2033

Figure 176: MEA Market Attractiveness by Type, 2023 to 2033

Figure 177: MEA Market Attractiveness by Material, 2023 to 2033

Figure 178: MEA Market Attractiveness by Application, 2023 to 2033

Figure 179: MEA Market Attractiveness by Sales Channel, 2023 to 2033

Figure 180: MEA Market Attractiveness by Country, 2023 to 2033

Frequently Asked Questions

What is the Projected Size of the Market by 2033?

The global market size to reach USD 911 million by 2033.

Which Region Holds High Lucrativeness?

North America is projected to emerge as a lucrative market.

What is the Growth Potential of the Automatic Hog Feeder Market?

The growth potential of the automatic hog feeder market is 7.1% through 2033.

What Factors Driving the Market Growth?

Smart technology and innovation in feeding technology is driving the market growth.

What is the Growth Potential of the Market in the United States?

The United State’s is likely to secure a share of 30.1% in 2023

Explore Similar Insights

Future Market Insights

Automatic Hog Feeder Market