Reports

- Global Locations -

Headquarters

Future Market Insights, Inc.

Christiana Corporate, 200
Continental Drive, Suite 401,
Newark, Delaware - 19713,
United States

T: +1-845-579-5705

Americas

Future Market Insights, Inc.

616 Corporate Way, Suite 2-9018,
Valley Cottage, NY 10989, United States

T: +1-347-918-3531

MEA

Future Market Insights

1602-6 Jumeirah Bay X2 Tower, Plot No: JLT-PH2-X2A,
Jumeirah Lakes Towers, Dubai,
United Arab Emirates

Europe

Future Market Insights

3rd Floor, 207 Regent Street,
W1B 3HH London
United Kingdom

T: + 44 (0) 20 8123 9659
D: +44 (0) 20 3287 4268

Asia Pacific

Future Market Insights

IndiaLand Global Tech Park, Unit UG-1, Behind Grand HighStreet, Phase 1, Hinjawadi, MH, Pune – 411057, India

Automatic Dishwasher Market Outlook (2022 to 2032)

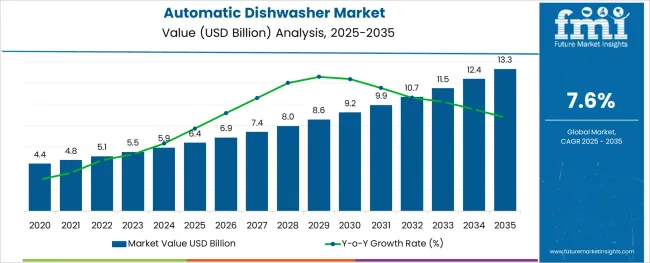
The global automatic dishwasher market size is estimated at ~US$ 5,129.2 million in 2022 and it is projected to reach a valuation of ~US$ 10,670.2 million by 2032. Overall automatic dishwasher sales are slated to grow at a CAGR of ~7.6% from 2022 to 2032. The share of the automatic dishwasher market in its parent market (consumer appliance market) is approximately ~2%-5%.

Automatic dishwashers are advanced machines used for cleaning and rinsing dirty dishes automatically, quickly, and efficiently. They have become ideal cleaning solutions across commercial establishments such as hotels and restaurants where many dishes need to be cleaned quickly.

End users just have to load dirty dishes and set proper washing cycles to initiate the cleaning process. Automatic dishwashers automatically clean dishes and get rid of germs. These cleaning solutions eliminate breakage through reduced handling of dishes and represent a tremendous saving in time and effort.

Automatic dishwashers help end users reduce labor costs, save water and energy, improve kitchen hygiene, and enhance overall productivity. Hence, they are being increasingly adopted across residential and commercial sectors which is providing a major impetus to the global automatic dishwasher industry.

Similarly, the growing popularity of modular kitchens, rising adoption of connected home appliances, and rapid growth of HoReCa sectors are expected to propel automatic dishwater demand during the forecast period.

Moreover, a growing focus on water conservation measures is expected to create opportunities for automatic dishwasher manufacturers during the forecast period. As automatic dishwashers use less water than usual, several industries are installing them in their kitchens.

Based on product type, freestanding automatic dishwashers will continue to remain top selling category during the forecast period owing to their low cost, easy installation, and portable nature. These freestanding automatic dishwashers are being increasingly adopted across restaurants, hotels, and households.

Attribute Key Insights
Estimated Automatic Dishwasher Market Value (2022) ~US$ 5,129.2 million
Projected Market Value (2032) ~US$ 10,670.2 million
Value-based CAGR (2022 to 2032) ~7.6%
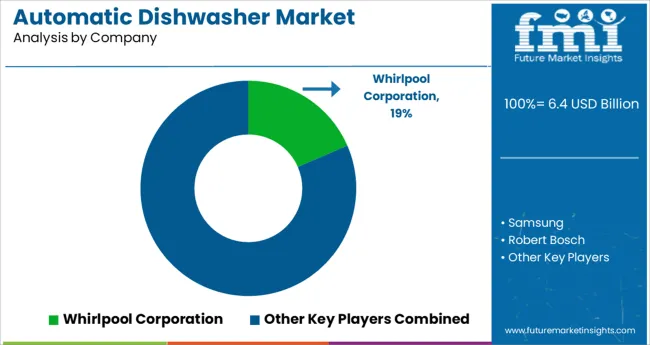
Top Players Share in 2021, % ~20%-25%

Don't pay for what you don't need

Customize your report by selecting specific countries or regions and save 30%!

2017 to 2021 Global Automatic Dishwasher Market Outlook Compared to 2022 to 2032 Forecast

According to Future Market Insights (FMI), the global automatic dishwasher industry is projected to expand at a CAGR of 7.6% between 2022 and 2032, in comparison to the 5.4% CAGR registered from 2017 to 2021.

The growing need for reducing labor costs and improving overall productivity across commercial kitchens and the increasing popularity of automatic dishwashers in households due to their water-saving ability are some of the key factors driving the global market forward.

Various digital platforms are increasingly being used by start-ups and large global corporations to promote their products and increase sales. Stainless steel dishwashers are preferred because they use less water and are more robust to use.

Steel products have lower operating costs because they use less energy. Consumers also want products with special properties such as glass protection, gloss enhancers, rinse aids, sound dampening, and LED touch panels. This innovation aims to increase the demand for the target product.

The demand for automatic dishwashers is also fueled by lifestyle changes due to rapid urbanization and increasing purchasing power in developing countries such as China, Taiwan, India, and Brazil. The working population uses time-saving smart kitchen appliances due to their rigorous work schedules.

Manufacturers in the industry have capitalized on the growing importance of conserving water by offering solutions in the form of automatic dishwashers that use less water than is needed for conventional dishwashing. This development of sustainable automatic dishwashers will further help the industry to develop during the forecast period.

Comparative Analysis of Automatic Dishwasher Markets

Automatic Dishwasher Market:

Differentiating Aspects Automatic Dishwasher Market
CAGR in 2022 to 2032 7.6%
Current Valuation in 2022 US$ 5,129.2 million
Projected Valuation in 2032 US$ 10,670.2 million
Demand Drivers
  • Growing demand for advanced dishwasher products from residential and commercial sectors is a key factor spurring automatic dishwasher sales globally.
  • The increasing need for reducing water and energy consumption while cleaning dishes will continue to generate high demand for automatic dishwashers over the next ten years.

Industrial Dishwasher Market:

Differentiating Aspects Industrial Dishwasher Market
CAGR in 2022 to 2032 3.3%
Current Valuation in 2022 US$ 433.5 million
Projected Valuation in 2032 US$ 629.5 million (2023)
Demand Drivers
  • The rising adoption of industrial dishwashers across the booming hospitality sector is a key factor driving the global industrial dishwasher market forward.
  • Growing health consciousness and hygiene awareness worldwide will continue to generate demand for industrial dishwashers.

Dishwasher Tablets Market:

Differentiating Aspects Dishwasher Tablets Market
CAGR in 2022 to 2032 6.9%
Current Valuation in 2022 US$ 563.2 million
Projected Valuation in 2032 US$ 1,097.5 million
Demand Drivers
  • The increasing popularity of dishwashers and dishwasher tablets in cafes, restaurants, and other establishments, is a key factor driving the global dishwasher tablets market.
  • The rising popularity of modular kitchens across the globe will positively influence dishwasher tablet sales during the forthcoming decade.
Sneha Verghese
Sneha Verghese

Principal Consultant

Talk to Analyst

Find your sweet spots for generating winning opportunities in this market.

What are the Key Trends Driving Sales of Automatic Dishwashers in the Global Market?

High Spending on Kitchen Remodeling & Renovation and Technological Advancements in Automatic Dishwashers Boosting Market

One of the key aspects propelling the automatic dishwasher industry forward is the rising spending on kitchen remodeling or renovation. Similarly, with the rising popularity of modular kitchens, there is an exponential increase in demand for smart kitchen appliances including dining and cooking utensils and dishwashers.

Wi-Fi-enabled smart dishwaters are a big improvement in the market for automatic dishwashers. Owners of the Wi-Fi-enabled dishwasher may start and stop cycles, as well as monitor the cleaning process, from their phone or tablet. For instance, LG Wi-Fi-equipped smart dishwashers feature SmartThinQ technology, which provides smartphone alerts when the process is finished.

Smart dishwashers are becoming more popular as customers want products that simplify their lives. There has been a growing interest in automatic dishwashers with the rise in the average family's extra income and busy lifestyles. Overall, continuous new product developments in these appliances will create lucrative opportunities for automatic dishwasher manufacturers during the forecast period.
Country-wise Insights

Why is the Demand for Automatic Dishwashers Increasing in the USA?

Growing Popularity of Sustaining Dishwashers in Thriving Commercial Sector Fueling Demand

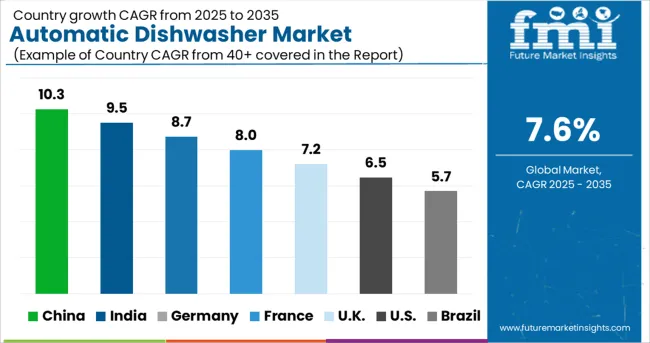
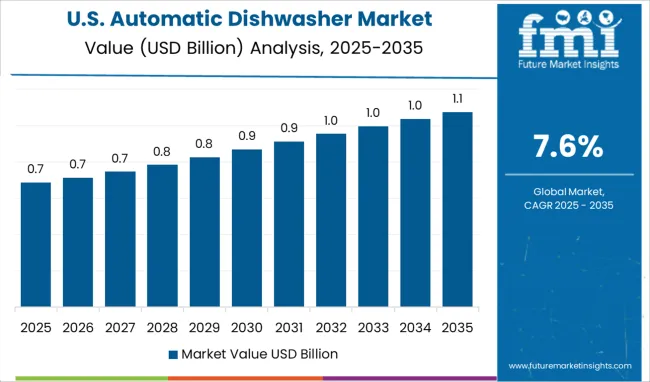
The USA is projected to be one of the largest markets for automatic dishwashers during the forecast period. A robust CAGR of over ~6.3% has been predicted by FMI for the USA market during the forecast period.

The rapid growth of the HoReCa sector and the rising shift towards sustainable and eco-friendly kitchenware solutions are some of the key factors driving the USA market for automatic dishwashers.

The most recent market development is a growing focus on environmentally friendly cleaning technology. A significant amount of energy is consumed to heat the water used in commercial automatic dishwashers. Technologies for reusing the water and energy needed for dishwashing are currently being used by commercial automatic dishwashers.

Since there are now more than a million restaurants in the United States; the commercial dishwashing industry is projected to undergo significant change in the years to come. A growing number of restaurants and hotels are purchasing commercial dishwashers due to considerations like higher throughput and improved efficiencies. This will boost automatic dishwasher sales during the forecast period.

What is the Automatic Dishwasher Sales Outlook in China?

Introduction of Different Innovative Options By Manufacturers Boosting China’s Market

China has been a promising market for automatic dishwashers during the last few years and it is expected to hold a significant share of the global market in 2022. Further, the overall automatic dishwasher sales in China are poised to accelerate at a CAGR of ~11.7% between 2022 and 2032 as per Future Market Insights' (FMI) latest analysis.

Easy product availability, the development of innovative and affordable kitchenware solutions by manufacturers, and the high adoption of automatic dishwashers across the residential sector are some of the key factors driving the China market.

China's society and economy have changed because of quick advancements in industrial technology and rising consumer spending. The country (China) is a significant global producer of both industrial and consumer goods. It is anticipated that medium and big businesses will consolidate quickly because of the Chinese government's encouragement of industrial consolidation, which aims to manage the sector and increase competitiveness in the international market.

How is the Market for Automatic Dishwashers Faring in India?

Rapid Urbanization and Rising Popularity of Modular Kitchens Generate Demand in India

According to Future Market Insights, India’s automatic dishwasher market is anticipated to grow at an impressive CAGR of ~12.5% during the forecast period.

The country’s expanding population and shifting consumer lifestyles are driving India’s automatic dishwasher industry. Similarly, the market is anticipated to develop because of rapid urbanization and rising personal income. The number of working individuals and nuclear families is increasing, which is driving up demand for automatic dishwashers.

Additionally, the market is noticing a trend toward increased demand for built-in dishwashers because of the popularity of modular kitchen layouts in India. This will further boost sales of automatic dishwashers during the forecast period.

Get the data you need at a Fraction of the cost

Personalize your report by choosing insights you need
and save 40%!

Category-wise Insights

Why are Freestanding Automatic Dishwashers Mostly Preferred?

Attractive Features Offered by Freestanding Automatic Dishwashers Making Them Popular

As per FMI, the market value of freestanding automatic dishwashers is expected to grow at a CAGR of ~6.8% between 2022 and 2032, making it the leading product type segment. This is attributed to the rising adoption of freestanding automatic dishwashers across residential and commercial sectors due to their compact, portable, and easy installation space features.

Both built-in and freestanding automatic dishwashers include energy-saving cycles that reduce utility costs; a standalone/freestanding dishwasher however does not need any additional setup. It often drains into the sink and is hooked to the kitchen faucet.

Additionally, freestanding automatic dishwashers are more affordable than built-in ones and can be put in any place. Thanks to these attractive features, they are becoming highly popular among end users and the trend is likely to continue during the forecast period

Why is the Adoption Rate of Automatic Dishwashers High in the Commercial Sector?

Growing Focus on Improving Overall Efficiency Encouraging Adoption in Commercial Sector

Based on application, the global market for automatic dishwashers is segmented into residential and commercial. Among these, the commercial segment is predicted to hold a sizable value share of roughly ~69.7% in 2022 and further grow at a healthy CAGR over the next ten years. This is attributed to the increasing adoption of automatic dishwashers across restaurants, hotels, cafeterias, and other commercial facilities to reduce labor requirements and improve efficiency.

Instead of hiring someone to wash dishes, many eateries opt to use automatic dishwashers. They can wash many dishes quickly, which is one of the main reasons for their adoption. This lessens the need for a clean pot and the time spent waiting for one.

Businesses that prepare food should adhere to government recommendations for food safety. As a result, they use automated dishwashers to ensure that their serving dinnerware is cleaned and washed.

Which Sales Channel Will Generate the Highest Revenues for the Market?

Online Retailers Segment to Generate Highest Revenues Through 2032

Between 2022 and 2032, a major chunk of the industry will be taken over by online retailers like Amazon, eBay, and others due to the flexibility they give in terms of pricing, design, and functionality. In long term, more products will be available on these internet platforms, which will enhance sales through these sales channels.

With online sales, delivering a secure transaction and processing reimbursement are simple. FMI predicts the online retailer's segment to expand at a significant growth rate of around ~14.3% during the forecast period.
Competitive Landscape

Leading businesses in the global market for automatic dishwashers are making significant investments in Research and Development (R&D) to develop cutting-edge goods and services. Besides this, they are employing various strategies such as facility expansions, mergers, acquisitions, partnerships, and collaborations to stay ahead of the competition. For instance,

  • In 2020, GE Appliances (GEA), a Haier business, announced the opening of a new US$ 80 million-dishwasher production line at its Louisville supersite, which will use a platform for extra-large capacity dishwashers that has undergone a thorough makeover.
  • In July 2022, Samsung Electronics Singapore launched new dishwashers designed to help consumers keep their kitchenware hygienic.
  • In February 2022, Godrej & Boyce announced that its business Godrej Appliances launched Godrej Eon Magnus Counter-Top Dishwasher for smaller families.

Scope of Report

Attribute Details
Estimated Market Size (2022) ~US$ 5,129.2 million
Projected Market Size (2032) ~US$ 10,670.2 million
Anticipated Growth Rate (2022 to 2032) ~7.6% CAGR
Forecast Period 2022 to 2032
Historical Data Available for 2017 to 2021
Market Analysis US$ Million for Value
Key Regions Covered North America, Latin America, Europe, East Asia, South Asia, Oceania & MEA
Key Countries Covered United States, Canada, Brazil, Mexico, Germany, the United Kingdom, France, Spain, Italy, Russia, Benelux, South Africa, Northern Africa GCC Countries, China, Japan, South Korea, India, Thailand, Malaysia, Indonesia, Australia & New Zealand
Key Segments Covered Product Type, Application, Capacity, Sales Channel, and Region
Key Companies Profiled
  • Samsung
  • Whirlpool
  • Robert Bosch
  • LG
  • Haier
  • Electrolux AB
  • Sears Holding Corporation
  • Asko
  • Miele
  • Others
Report Coverage Market Forecast, Company Share Analysis, Competition Intelligence, DROT Analysis, Market Dynamics and Challenges, and Strategic Growth Initiatives

Global Automatic Dishwasher Industry by Category

By Product Type:

  • Freestanding
  • Built-in

By Application:

  • Commercial
  • Residential

By Capacity:

  • 4 Place Setting
  • 6 Place Setting
  • 8 Place Setting
  • 12 Place Setting
  • Other

By Sales Channel:

  • Wholesalers/Distributors
  • Multi-Brand Stores
  • Specialty Stores
  • Hypermarket/Supermarkets
  • Online Retailers
  • Other Sales Channel

By Region:

  • North America
  • Latin America
  • Europe
  • East Asia
  • South Asia
  • Oceania
  • Middle East and Africa (MEA)

Frequently Asked Questions

How big is the global market for automatic dishwashers?

The global automatic dishwasher market reached a valuation of ~US$ 4,731.8 million in 2021 and it is expected to total US$ 5,129.2 million in 2022.

At what rate did the global market for automatic dishwashers grow between 2017 and 2021?

The worldwide market for automatic dishwashers grew at ~5.4% CAGR between 2017 and 2021.

What is the projected valuation for automatic dishwasher industry in 2032?

As per FMI, the worldwide automatic dishwasher industry is projected to reach ~US$ 10,670.2 million by the end of 2032.

At what rate is the demand for automatic dishwashers expected to grow between 2022 and 2032?

Between 2022 and 2032, the overall automatic dishwaters demand is projected to grow at a CAGR of 7.6%.

What are the key trends driving automatic dishwasher sales?

Growing popularity of online stores, new product launches, and rising concerns regarding hygiene are some of the key trends boosting the market.

Who are the leading players in the market?

Leading players operating in the global market for automatic dishwashers are Samsung, Whirlpool, Robert Bosch, LG, Haier, Electrolux AB, among others.

What is the sales forecast for the USA Market?

Automatic dishwasher sales across the USA are projected to surge at a ~6.3% CAGR over the forecast period.

Table of Content

1. Executive Summary | Automatic Dishwasher Market

    1.1. Global Market Outlook

    1.2. Summary of Key Findings

    1.3. Summary of Key Statistics

    1.4. FMI Analysis and Recommendations

2. Market Overview

    2.1. Market Taxonomy

    2.2. Market Definition

3. Key Market Trends

    3.1. Key Trends Impacting the Market

    3.2. Product Innovation Trends

4. Global Market Demand Analysis 2017 to 2021 and Forecast, 2022 to 2032

    4.1. Historical Market Volume (‘000 Units) Analysis, 2017 to 2021

    4.2. Current and Future Market Volume (‘000 Units) Projections, 2022 to 2032

    4.3. Y-o-Y Growth Trend Analysis

5. Global Market - Pricing Analysis

    5.1. Regional Pricing Analysis by Product Type

    5.2. Pricing Break-up

        5.2.1. Manufacturer-Level Pricing

        5.2.2. Distributor Level Pricing

    5.3. Average Pricing Analysis Benchmark

6. Global Market Demand (in Value or in US$ million) Analysis 2017 to 2021 and Forecast, 2022 to 2032

    6.1. Historical Market Value (US$ million) Analysis, 2017 to 2021

    6.2. Current and Future Market Value (US$ million) Projections, 2022 to 2032

        6.2.1. Y-o-Y Growth Trend Analysis

        6.2.2. Absolute $ Opportunity Analysis

7. Market Background

    7.1. Macro-Economic Factors

        7.1.1. Global GDP Growth Outlook

        7.1.2. Global Consumer Spending Outlook

        7.1.3. Retail Sector GVA and Growth

        7.1.4. Per Capita Disposable Income

        7.1.5. Global Urbanization Outlook

        7.1.6. Global Working Population Statistics

        7.1.7. E-commerce Penetration Overview

    7.2. Forecast Factors - Relevance & Impact

        7.2.1. Top Company’s Historical Growth

        7.2.2. Per Capita Disposable Income

        7.2.3. Global Consumer Goods Industry Analysis

        7.2.4. Global Urbanization Growth outlook

        7.2.5. World internet User Statistics

    7.3. Industry Value and Supply Chain Analysis

    7.4. Market Dynamics

        7.4.1. Drivers

        7.4.2. Restraints

        7.4.3. Opportunity Analysis

    7.5. PESTLE Analysis of Market

    7.6. Investment Feasibility Matrix

    7.7. Porter’s Five Force

8. Global Market Analysis 2017 to 2021 and Forecast 2022 to 2032, by Product Type

    8.1. Introduction / Key Findings

    8.2. Historical Market Size (US$ million) and Volume Analysis by Product Type, 2017 to 2021

    8.3. Current and Future Market Size (US$ million) and Volume Analysis and Forecast by Product Type, 2022 to 2032

        8.3.1. Freestanding

        8.3.2. Built-in

    8.4. Market Attractiveness Analysis by Product Type

9. Global Market Analysis 2017 to 2021 and Forecast 2022 to 2032, by Application

    9.1. Introduction / Key Findings

    9.2. Historical Market Size (US$ million) and Volume Analysis by Application, 2017 to 2021

    9.3. Current and Future Market Size (US$ million) and Volume Analysis and Forecast by Application, 2022 to 2032

        9.3.1. Commercial

        9.3.2. Residential

    9.4. Market Attractiveness Analysis by Application

10. Global Market Analysis 2017 to 2021 and Forecast 2022 to 2032, by Capacity

    10.1. Introduction / Key Findings

    10.2. Historical Market Size (US$ million) and Volume Analysis by Capacity, 2017 to 2021

    10.3. Current and Future Market Size (US$ million) and Volume Analysis and Forecast by Capacity, 2022 to 2032

        10.3.1. 4 Place Setting

        10.3.2. 6 Place Setting

        10.3.3. 8 Place Setting

        10.3.4. 12 Place Setting

        10.3.5. Other

    10.4. Market Attractiveness Analysis by Capacity

11. Global Market Analysis 2017 to 2021 and Forecast 2022 to 2032, by Sales Channel

    11.1. Introduction / Key Findings

    11.2. Historical Market Size (US$ million) and Volume Analysis by Sales Channel, 2017 to 2021

    11.3. Current and Future Market Size (US$ million) and Volume Analysis and Forecast by Sales Channel, 2022 to 2032

        11.3.1. Wholesalers/Distributors

        11.3.2. Multi-Brand Stores

        11.3.3. Specialty Stores

        11.3.4. Hypermarkets/Supermarkets

        11.3.5. Online Retailers

        11.3.6. Other Sales Channel

    11.4. Market Attractiveness Analysis by Sales Channel

12. Global Market Analysis 2017 to 2021 and Forecast 2022 to 2032, by Region

    12.1. Introduction

    12.2. Historical Market Size (US$ million) and Volume Analysis By Region, 2017 to 2021

    12.3. Current Market Size (US$ million) and Volume Analysis and Forecast By Region, 2022 to 2032

        12.3.1. North America

        12.3.2. Latin America

        12.3.3. Europe

        12.3.4. East Asia

        12.3.5. South Asia

        12.3.6. Oceania

        12.3.7. Middle East and Africa (MEA)

    12.4. Market Attractiveness Analysis By Region

13. North America Market Analysis 2017 to 2021 and Forecast 2022 to 2032

    13.1. Introduction

    13.2. Pricing Analysis

    13.3. Historical Market Size (US$ million) and Volume Trend Analysis By Market Taxonomy, 2017 to 2021

    13.4. Market Size (US$ million) and Volume Forecast By Market Taxonomy, 2022 to 2032

        13.4.1. By Country

            13.4.1.1. The USA

            13.4.1.2. Canada

        13.4.2. By Product Type

        13.4.3. By Application

        13.4.4. By Capacity

        13.4.5. By Sales Channel

    13.5. Market Attractiveness Analysis

        13.5.1. By Country

        13.5.2. By Product Type

        13.5.3. By Application

        13.5.4. By Capacity

        13.5.5. By Sales Channel

14. Latin America Market Analysis 2017 to 2021 and Forecast 2022 to 2032

    14.1. Introduction

    14.2. Pricing Analysis

    14.3. Historical Market Size (US$ million) and Volume Trend Analysis By Market Taxonomy, 2017 to 2021

    14.4. Market Size (US$ million) and Volume Forecast By Market Taxonomy, 2022 to 2032

        14.4.1. By Country

            14.4.1.1. Brazil

            14.4.1.2. Mexico

            14.4.1.3. Rest of Latin America

        14.4.2. By Product Type

        14.4.3. By Application

        14.4.4. By Capacity

        14.4.5. By Sales Channel

    14.5. Market Attractiveness Analysis

        14.5.1. By Country

        14.5.2. By Product Type

        14.5.3. By Application

        14.5.4. By Capacity

        14.5.5. By Sales Channel

15. Europe Market Analysis 2017 to 2021 and Forecast 2022 to 2032

    15.1. Introduction

    15.2. Pricing Analysis

    15.3. Historical Market Size (US$ million) and Volume Trend Analysis By Market Taxonomy, 2017 to 2021

    15.4. Market Size (US$ million) and Volume Forecast By Market Taxonomy, 2022 to 2032

        15.4.1. By Country

            15.4.1.1. The United Kingdom

            15.4.1.2. Germany

            15.4.1.3. Italy

            15.4.1.4. Spain

            15.4.1.5. France

            15.4.1.6. Russia

            15.4.1.7. Rest of Europe

        15.4.2. By Product Type

        15.4.3. By Application

        15.4.4. By Capacity

        15.4.5. By Sales Channel

    15.5. Market Attractiveness Analysis

        15.5.1. By Country

        15.5.2. By Product Type

        15.5.3. By Application

        15.5.4. By Capacity

        15.5.5. By Sales Channel

16. East Asia Market Analysis 2017 to 2021 and Forecast 2022 to 2032

    16.1. Introduction

    16.2. Pricing Analysis

    16.3. Historical Market Size (US$ million) and Volume Trend Analysis By Market Taxonomy, 2017 to 2021

    16.4. Market Size (US$ million) and Volume Forecast By Market Taxonomy, 2022 to 2032

        16.4.1. By Country

            16.4.1.1. China

            16.4.1.2. Japan

            16.4.1.3. South Korea

        16.4.2. By Product Type

        16.4.3. By Application

        16.4.4. By Capacity

        16.4.5. By Sales Channel

    16.5. Market Attractiveness Analysis

        16.5.1. By Country

        16.5.2. By Product Type

        16.5.3. By Application

        16.5.4. By Capacity

        16.5.5. By Sales Channel

17. South Asia Market Analysis 2017 to 2021 and Forecast 2022 to 2032

    17.1. Introduction

    17.2. Pricing Analysis

    17.3. Historical Market Size (US$ million) and Volume Trend Analysis By Market Taxonomy, 2017 to 2021

    17.4. Market Size (US$ million) and Volume Forecast By Market Taxonomy, 2022 to 2032

        17.4.1. By Country

            17.4.1.1. India

            17.4.1.2. Thailand

            17.4.1.3. Malaysia

            17.4.1.4. Indonesia

            17.4.1.5. Rest of South Asia

        17.4.2. By Product Type

        17.4.3. By Application

        17.4.4. By Capacity

        17.4.5. By Sales Channel

    17.5. Market Attractiveness Analysis

        17.5.1. By Country

        17.5.2. By Product Type

        17.5.3. By Application

        17.5.4. By Capacity

        17.5.5. By Sales Channel

18. Oceania Market Analysis 2017 to 2021 and Forecast 2022 to 2032

    18.1. Introduction

    18.2. Pricing Analysis

    18.3. Historical Market Size (US$ million) and Volume Trend Analysis By Market Taxonomy, 2017 to 2021

    18.4. Market Size (US$ million) and Volume Forecast By Market Taxonomy, 2022 to 2032

        18.4.1. By Country

            18.4.1.1. Australia

            18.4.1.2. New Zealand

        18.4.2. By Product Type

        18.4.3. By Application

        18.4.4. By Capacity

        18.4.5. By Sales Channel

    18.5. Market Attractiveness Analysis

        18.5.1. By Country

        18.5.2. By Product Type

        18.5.3. By Application

        18.5.4. By Capacity

        18.5.5. By Sales Channel

19. MEA Market Analysis 2017 to 2021 and Forecast 2022 to 2032

    19.1. Introduction

    19.2. Pricing Analysis

    19.3. Historical Market Size (US$ million) and Volume Trend Analysis By Market Taxonomy, 2017 to 2021

    19.4. Market Size (US$ million) and Volume Forecast By Market Taxonomy, 2022 to 2032

        19.4.1. By Country

            19.4.1.1. GCC Countries

            19.4.1.2. South Africa

            19.4.1.3. Rest of MEA

        19.4.2. By Product Type

        19.4.3. By Application

        19.4.4. By Capacity

        19.4.5. By Sales Channel

    19.5. Market Attractiveness Analysis

        19.5.1. By Country

        19.5.2. By Product Type

        19.5.3. By Application

        19.5.4. By Capacity

        19.5.5. By Sales Channel

20. Market Structure Analysis

    20.1. Market Analysis by Tier of Companies

    20.2. Market Concentration

    20.3. Market Share Analysis of Top Players

    20.4. Market Presence Analysis

        20.4.1. By Regional footprint of Players

        20.4.2. Product foot print by Players

        20.4.3. Channel Foot Print by Players

21. Competition Analysis

    21.1. Competition Dashboard

    21.2. Pricing Analysis by Competition

    21.3. Competition Benchmarking

    21.4. Competition Deep Dive

        21.4.1. Samsung

            21.4.1.1. Overview

            21.4.1.2. Product Portfolio

            21.4.1.3. Profitability by Market Segments (Product/Channel/Region)

            21.4.1.4. Distribution Footprint

            21.4.1.5. Strategy Overview

        21.4.2. Whirlpool

            21.4.2.1. Overview

            21.4.2.2. Product Portfolio

            21.4.2.3. Profitability by Market Segments (Product/Channel/Region)

            21.4.2.4. Distribution Footprint

            21.4.2.5. Strategy Overview

        21.4.3. Robert Bosch

            21.4.3.1. Overview

            21.4.3.2. Product Portfolio

            21.4.3.3. Profitability by Market Segments (Product/Channel/Region)

            21.4.3.4. Distribution Footprint

            21.4.3.5. Strategy Overview

        21.4.4. LG

            21.4.4.1. Overview

            21.4.4.2. Product Portfolio

            21.4.4.3. Profitability by Market Segments (Product/Channel/Region)

            21.4.4.4. Distribution Footprint

            21.4.4.5. Strategy Overview

        21.4.5. Haier

            21.4.5.1. Overview

            21.4.5.2. Product Portfolio

            21.4.5.3. Profitability by Market Segments (Product/Channel/Region)

            21.4.5.4. Distribution Footprint

            21.4.5.5. Strategy Overview

        21.4.6. Electrolux AB

            21.4.6.1. Overview

            21.4.6.2. Product Portfolio

            21.4.6.3. Profitability by Market Segments (Product/Channel/Region)

            21.4.6.4. Distribution Footprint

            21.4.6.5. Strategy Overview

        21.4.7. Sears Holding corporation

            21.4.7.1. Overview

            21.4.7.2. Product Portfolio

            21.4.7.3. Profitability by Market Segments (Product/Channel/Region)

            21.4.7.4. Distribution Footprint

            21.4.7.5. Strategy Overview

        21.4.8. Asko

            21.4.8.1. Overview

            21.4.8.2. Product Portfolio

            21.4.8.3. Profitability by Market Segments (Product/Channel/Region)

            21.4.8.4. Distribution Footprint

            21.4.8.5. Strategy Overview

        21.4.9. Miele

            21.4.9.1. Overview

            21.4.9.2. Product Portfolio

            21.4.9.3. Profitability by Market Segments (Product/Channel/Region)

            21.4.9.4. Distribution Footprint

            21.4.9.5. Strategy Overview

        21.4.10. Others (As per Request)

            21.4.10.1. Overview

            21.4.10.2. Product Portfolio

            21.4.10.3. Profitability by Market Segments (Product/Channel/Region)

            21.4.10.4. Distribution Footprint

            21.4.10.5. Strategy Overview

22. Assumptions and Acronyms Used

23. Research Methodology

Don't pay for what you don't need

Customize your report by selecting specific countries or regions and save 30%!

List of Tables

Table 1: Global Market Value (US$ million) Forecast, By Product Type, 2017 to 2032

Table 2: Global Market Volume (‘000 Units) Forecast, By Product Type, 2017 to 2032

Table 3: Global Market Value (US$ million) Forecast, By Application, 2017 to 2032

Table 4: Global Market Volume (‘000 Units) Forecast, By Application, 2017 to 2032

Table 5: Global Market Value (US$ million) Forecast, By Capacity, 2017 to 2032

Table 6: Global Market Volume (‘000 Units) Forecast, By Capacity, 2017 to 2032

Table 7: Global Market Value (US$ million) Forecast, By Sales Channel, 2017 to 2032

Table 8: Global Market Volume (‘000 Units) Forecast, By Sales Channel, 2017 to 2032

Table 9: Global Market Value (US$ million) Forecast, By Region, 2017 to 2032

Table 10: Global Market Volume (‘000 Units) Forecast, By Region, 2017 to 2032

Table 11: North America Market Value (US$ million) Forecast, By Country, 2017 to 2032

Table 12: North America Market Volume (‘000 Units) Forecast, By Country, 2017 to 2032

Table 13: North America Market Value (US$ million) Forecast, By Product Type, 2017 to 2032

Table 14: North America Market Volume (‘000 Units) Forecast, By Product Type, 2017 to 2032

Table 15: North America Market Value (US$ million) Forecast, By Application, 2017 to 2032

Table 16: North America Market Volume (‘000 Units) Forecast, By Application, 2017 to 2032

Table 17: North America Market Value (US$ million) Forecast, By Capacity, 2017 to 2032

Table 18: North America Market Volume (‘000 Units) Forecast, By Capacity, 2017 to 2032

Table 19: North America Market Value (US$ million) Forecast, By Sales Channel, 2017 to 2032

Table 20: North America Market Volume (‘000 Units) Forecast, By Sales Channel, 2017 to 2032

Table 21: Latin America Market Value (US$ million) Forecast, By Country, 2017 to 2032

Table 22: Latin America Market Volume (‘000 Units) Forecast, By Country, 2017 to 2032

Table 23: Latin America Market Value (US$ million) Forecast, By Product Type, 2017 to 2032

Table 24: Latin America Market Volume (‘000 Units) Forecast, By Product Type, 2017 to 2032

Table 25: Latin America Market Value (US$ million) Forecast, By Application, 2017 to 2032

Table 26: Latin America Market Volume (‘000 Units) Forecast, By Application, 2017 to 2032

Table 27: Latin America Market Value (US$ million) Forecast, By Capacity, 2017 to 2032

Table 28: Latin America Market Volume (‘000 Units) Forecast, By Capacity, 2017 to 2032

Table 29: Latin America Market Value (US$ million) Forecast, By Sales Channel, 2017 to 2032

Table 30: Latin America Market Volume (‘000 Units) Forecast, By Sales Channel, 2017 to 2032

Table 31: Europe Market Value (US$ million) Forecast, By Country, 2017 to 2032

Table 32: Europe Market Volume (‘000 Units) Forecast, By Country, 2017 to 2032

Table 33: Europe Market Value (US$ million) Forecast, By Product Type, 2017 to 2032

Table 34: Europe Market Volume (‘000 Units) Forecast, By Product Type, 2017 to 2032

Table 35: Europe Market Value (US$ million) Forecast, By Application, 2017 to 2032

Table 36: Europe Market Volume (‘000 Units) Forecast, By Application, 2017 to 2032

Table 37: Europe Market Value (US$ million) Forecast, By Capacity, 2017 to 2032

Table 38: Europe Market Volume (‘000 Units) Forecast, By Capacity, 2017 to 2032

Table 39: Europe Market Value (US$ million) Forecast, By Sales Channel, 2017 to 2032

Table 40: Europe Market Volume (‘000 Units) Forecast, By Sales Channel, 2017 to 2032

Table 41: East Asia Market Value (US$ million) Forecast, By Country, 2017 to 2032

Table 42: East Asia Market Volume (‘000 Units) Forecast, By Country, 2017 to 2032

Table 43: East Asia Market Value (US$ million) Forecast, By Product Type, 2017 to 2032

Table 44: East Asia Market Volume (‘000 Units) Forecast, By Product Type, 2017 to 2032

Table 45: East Asia Market Value (US$ million) Forecast, By Application, 2017 to 2032

Table 46: East Asia Market Volume (‘000 Units) Forecast, By Application, 2017 to 2032

Table 47: East Asia Market Value (US$ million) Forecast, By Capacity, 2017 to 2032

Table 48: East Asia Market Volume (‘000 Units) Forecast, By Capacity, 2017 to 2032

Table 49: East Asia Market Value (US$ million) Forecast, By Sales Channel, 2017 to 2032

Table 50: East Asia Market Volume (‘000 Units) Forecast, By Sales Channel, 2017 to 2032

Table 51: South Asia Market Value (US$ million) Forecast, By Country, 2017 to 2032

Table 52: South Asia Market Volume (‘000 Units) Forecast, By Country, 2017 to 2032

Table 53: South Asia Market Value (US$ million) Forecast, By Product Type, 2017 to 2032

Table 54: South Asia Market Volume (‘000 Units) Forecast, By Product Type, 2017 to 2032

Table 55: South Asia Market Value (US$ million) Forecast, By Application, 2017 to 2032

Table 56: South Asia Market Volume (‘000 Units) Forecast, By Application, 2017 to 2032

Table 57: South Asia Market Value (US$ million) Forecast, By Capacity, 2017 to 2032

Table 58: South Asia Market Volume (‘000 Units) Forecast, By Capacity, 2017 to 2032

Table 59: South Asia Market Value (US$ million) Forecast, By Sales Channel, 2017 to 2032

Table 60: South Asia Market Volume (‘000 Units) Forecast, By Sales Channel, 2017 to 2032

Table 61: Oceania Market Value (US$ million) Forecast, By Country, 2017 to 2032

Table 62: Oceania Market Volume (‘000 Units) Forecast, By Country, 2017 to 2032

Table 63: Oceania Market Value (US$ million) Forecast, By Product Type, 2017 to 2032

Table 64: Oceania Market Volume (‘000 Units) Forecast, By Product Type, 2017 to 2032

Table 65: Oceania Market Value (US$ million) Forecast, By Application, 2017 to 2032

Table 66: Oceania Market Volume (‘000 Units) Forecast, By Application, 2017 to 2032

Table 67: Oceania Market Value (US$ million) Forecast, By Capacity, 2017 to 2032

Table 68: Oceania Market Volume (‘000 Units) Forecast, By Capacity, 2017 to 2032

Table 69: Oceania Market Value (US$ million) Forecast, By Sales Channel, 2017 to 2032

Table 70: Oceania Market Volume (‘000 Units) Forecast, By Sales Channel, 2017 to 2032

Table 71: MEA Market Value (US$ million) Forecast, By Country, 2017 to 2032

Table 72: MEA Market Volume (‘000 Units) Forecast, By Country, 2017 to 2032

Table 73: MEA Market Value (US$ million) Forecast, By Product Type, 2017 to 2032

Table 74: MEA Market Volume (‘000 Units) Forecast, By Product Type, 2017 to 2032

Table 75: MEA Market Value (US$ million) Forecast, By Application, 2017 to 2032

Table 76: MEA Market Volume (‘000 Units) Forecast, By Application, 2017 to 2032

Table 77: MEA Market Value (US$ million) Forecast, By Capacity, 2017 to 2032

Table 78: MEA Market Volume (‘000 Units) Forecast, By Capacity, 2017 to 2032

Table 79: MEA Market Value (US$ million) Forecast, By Sales Channel, 2017 to 2032

Table 80: MEA Market Volume (‘000 Units) Forecast, By Sales Channel, 2017 to 2032
Sneha Verghese
Sneha Verghese

Principal Consultant

Talk to Analyst

Find your sweet spots for generating winning opportunities in this market.

List of Charts

Figure 01: Global Market Value (US$ million) and Volume (‘000 Units) Analysis, 2017 to 2032

Figure 02: Global Market Value (US$ million) and Volume (‘000 Units) Forecast 2022 to 2032

Figure 03: Global Market Value (US$ million) and Volume (‘000 Units) , 2017 to 2032

Figure 04: Global Market Absolute $ Opportunity (US$ million) 2022 to 2032

Figure 05: Global Market Value (US$ million) Analysis by Product Type, 2017 to 2032

Figure 06: Global Market Volume (‘000 Units) Analysis by Product Type, 2017 to 2032

Figure 07: Global Market Y-o-Y Growth (%) Projections, By Product Type, 2022 to 2032

Figure 08: Global Market Attractiveness by Product Type, 2022 to 2032

Figure 09: Global Market Value (US$ million) Analysis by Application, 2017 to 2032

Figure 10: Global Market Volume (‘000 Units) Analysis by Application, 2017 to 2032

Figure 11: Global Market Y-o-Y Growth (%) Projections, By Application, 2022 to 2032

Figure 12: Global Market Attractiveness by Application, 2022 to 2032

Figure 13: Global Market Value (US$ million) Analysis by Capacity, 2017 to 2032

Figure 14: Global Market Volume (‘000 Units) Analysis by Capacity, 2017 to 2032

Figure 15: Global Market Y-o-Y Growth (%) Projections, By Capacity, 2022 to 2032

Figure 16: Global Market Attractiveness by Capacity, 2022 to 2032

Figure 17: Global Market Value (US$ million) Analysis by Sales Channel, 2017 to 2032

Figure 18: Global Market Volume (‘000 Units) Analysis by Sales Channel, 2017 to 2032

Figure 19: Global Market Y-o-Y Growth (%) Projections, By Sales Channel, 2022 to 2032

Figure 20: Global Market Attractiveness by Sales Channel, 2022 to 2032

Figure 21: Global Market Value (US$ million) Analysis by Region, 2017 to 2032

Figure 22: Global Market Volume (‘000 Units) Analysis by Region, 2017 to 2032

Figure 23: Global Market Y-o-Y Growth (%) Projections, By Region, 2022 to 2032

Figure 24: Global Market Attractiveness by Region, 2022 to 2032

Figure 25: North America Market Value (US$ million) Analysis by Country, 2017 to 2032

Figure 26: North America Market Volume (‘000 Units) Analysis by Country, 2017 to 2032

Figure 27: North America Market Y-o-Y Growth (%) Projections, By Country, 2022 to 2032

Figure 28: North America Market Attractiveness by Country, 2022 to 2032

Figure 29: North America Market Value (US$ million) Analysis by Product Type, 2017 to 2032

Figure 30: North America Market Volume (‘000 Units) Analysis by Product Type, 2017 to 2032

Figure 31: North America Market Y-o-Y Growth (%) Projections, By Product Type, 2022 to 2032

Figure 32: North America Market Attractiveness by Product Type, 2022 to 2032

Figure 33: North America Market Value (US$ million) Analysis by Application, 2017 to 2032

Figure 34: North America Market Volume (‘000 Units) Analysis by Application, 2017 to 2032

Figure 35: North America Market Y-o-Y Growth (%) Projections, By Application, 2022 to 2032

Figure 36: North America Market Attractiveness by Application, 2022 to 2032

Figure 37: North America Market Value (US$ million) Analysis by Capacity, 2017 to 2032

Figure 38: North America Market Volume (‘000 Units) Analysis by Capacity, 2017 to 2032

Figure 39: North America Market Y-o-Y Growth (%) Projections, By Capacity, 2022 to 2032

Figure 40: North America Market Attractiveness by Capacity, 2022 to 2032

Figure 41: North America Market Value (US$ million) Analysis by Sales Channel, 2017 to 2032

Figure 42: North America Market Volume (‘000 Units) Analysis by Sales Channel, 2017 to 2032

Figure 43: North America Market Y-o-Y Growth (%) Projections, By Sales Channel, 2022 to 2032

Figure 44: North America Market Attractiveness by Sales Channel, 2022 to 2032

Figure 45: Latin America Market Value (US$ million) Analysis by Country, 2017 to 2032

Figure 46: Latin America Market Volume (‘000 Units) Analysis by Country, 2017 to 2032

Figure 47: Latin America Market Y-o-Y Growth (%) Projections, By Country, 2022 to 2032

Figure 48: Latin America Market Attractiveness by Country, 2022 to 2032

Figure 49: Latin America Market Value (US$ million) Analysis by Product Type, 2017 to 2032

Figure 50: Latin America Market Volume (‘000 Units) Analysis by Product Type, 2017 to 2032

Figure 51: Latin America Market Y-o-Y Growth (%) Projections, By Product Type, 2022 to 2032

Figure 52: Latin America Market Attractiveness by Product Type, 2022 to 2032

Figure 53: Latin America Market Value (US$ million) Analysis by Application, 2017 to 2032

Figure 54: Latin America Market Volume (‘000 Units) Analysis by Application, 2017 to 2032

Figure 55: Latin America Market Y-o-Y Growth (%) Projections, By Application, 2022 to 2032

Figure 56: Latin America Market Attractiveness by Application, 2022 to 2032

Figure 57: Latin America Market Value (US$ million) Analysis by Capacity, 2017 to 2032

Figure 58: Latin America Market Volume (‘000 Units) Analysis by Sales Channel, 2017 to 2032

Figure 59: Latin America Market Y-o-Y Growth (%) Projections, By Sales Channel, 2022 to 2032

Figure 60: Latin America Market Attractiveness by Sales Channel, 2022 to 2032

Figure 61: Latin America Market Value (US$ million) Analysis by Country, 2017 to 2032

Figure 62: Latin America Market Volume (‘000 Units) Analysis by Sales Channel, 2017 to 2032

Figure 63: Latin America Market Y-o-Y Growth (%) Projections, By Sales Channel, 2022 to 2032

Figure 64: Latin America Market Attractiveness by Sales Channel, 2022 to 2032

Figure 65: Europe Market Value (US$ million) Analysis by Country, 2017 to 2032

Figure 66: Europe Market Volume (‘000 Units) Analysis by Country, 2017 to 2032

Figure 67: Europe Market Y-o-Y Growth (%) Projections, By Country, 2022 to 2032

Figure 68: Europe Market Attractiveness by Country, 2022 to 2032

Figure 69: Europe Market Value (US$ million) Analysis by Product Type, 2017 to 2032

Figure 70: Europe Market Volume (‘000 Units) Analysis by Product Type, 2017 to 2032

Figure 71: Europe Market Y-o-Y Growth (%) Projections, By Product Type, 2022 to 2032

Figure 72: Europe Market Attractiveness by Product Type, 2022 to 2032

Figure 73: Europe Market Value (US$ million) Analysis by Application, 2017 to 2032

Figure 74: Europe Market Volume (‘000 Units) Analysis by Application, 2017 to 2032

Figure 75: Europe Market Y-o-Y Growth (%) Projections, By Application, 2022 to 2032

Figure 76: Europe Market Attractiveness by Application, 2022 to 2032

Figure 77: Europe Market Value (US$ million) Analysis by Capacity, 2017 to 2032

Figure 78: Europe Market Volume (‘000 Units) Analysis by Capacity, 2017 to 2032

Figure 79: Europe Market Y-o-Y Growth (%) Projections, By Capacity, 2022 to 2032

Figure 80: Europe Market Attractiveness by Capacity, 2022 to 2032

Figure 81: Europe Market Value (US$ million) Analysis by Sales Channel, 2017 to 2032

Figure 82: Europe Market Volume (‘000 Units) Analysis by Sales Channel, 2017 to 2032

Figure 83: Europe Market Y-o-Y Growth (%) Projections, By Sales Channel, 2022 to 2032

Figure 84: Europe Market Attractiveness by Sales Channel, 2022 to 2032

Figure 85: East Asia Market Value (US$ million) Analysis by Country, 2017 to 2032

Figure 86: East Asia Market Volume (‘000 Units) Analysis by Country, 2017 to 2032

Figure 87: East Asia Market Y-o-Y Growth (%) Projections, By Country, 2022 to 2032

Figure 88: East Asia Market Attractiveness by Country, 2022 to 2032

Figure 89: East Asia Market Value (US$ million) Analysis by Product Type, 2017 to 2032

Figure 90: East Asia Market Volume (‘000 Units) Analysis by Product Type, 2017 to 2032

Figure 91: East Asia Market Y-o-Y Growth (%) Projections, By Product Type, 2022 to 2032

Figure 92: East Asia Market Attractiveness by Product Type, 2022 to 2032

Figure 93: East Asia Market Value (US$ million) Analysis by Application, 2017 to 2032

Figure 94: East Asia Market Volume (‘000 Units) Analysis by Application, 2017 to 2032

Figure 95: East Asia Market Y-o-Y Growth (%) Projections, By Application, 2022 to 2032

Figure 96: East Asia Market Attractiveness by Application, 2022 to 2032

Figure 97: East Asia Market Value (US$ million) Analysis by Capacity, 2017 to 2032

Figure 98: East Asia Market Volume (‘000 Units) Analysis by Capacity, 2017 to 2032

Figure 99: East Asia Market Y-o-Y Growth (%) Projections, By Capacity, 2022 to 2032

Figure 100: East Asia Market Attractiveness by Capacity, 2022 to 2032

Figure 101: East Asia Market Value (US$ million) Analysis by Sales Channel, 2017 to 2032

Figure 102: East Asia Market Volume (‘000 Units) Analysis by Sales Channel, 2017 to 2032

Figure 103: East Asia Market Y-o-Y Growth (%) Projections, By Sales Channel, 2022 to 2032

Figure 104: East Asia Market Attractiveness by Sales Channel, 2022 to 2032

Figure 105: South Asia Market Value (US$ million) Analysis by Country, 2017 to 2032

Figure 106: South Asia Market Volume (‘000 Units) Analysis by Country, 2017 to 2032

Figure 107: South Asia Market Y-o-Y Growth (%) Projections, By Country, 2022 to 2032

Figure 108: South Asia Market Attractiveness by Country, 2022 to 2032

Figure 109: South Asia Market Value (US$ million) Analysis by Product Type, 2017 to 2032

Figure 110: South Asia Market Volume (‘000 Units) Analysis by Product Type, 2017 to 2032

Figure 111: South Asia Market Y-o-Y Growth (%) Projections, By Product Type, 2022 to 2032

Figure 112: South Asia Market Attractiveness by Product Type, 2022 to 2032

Figure 113: South Asia Market Value (US$ million) Analysis by Application, 2017 to 2032

Figure 114: South Asia Market Volume (‘000 Units) Analysis by Application, 2017 to 2032

Figure 115: South Asia Market Y-o-Y Growth (%) Projections, By Application, 2022 to 2032

Figure 116: South Asia Market Attractiveness by Application, 2022 to 2032

Figure 117: South Asia Market Value (US$ million) Analysis by Capacity, 2017 to 2032

Figure 118: South Asia Market Volume (‘000 Units) Analysis by Capacity, 2017 to 2032

Figure 119: South Asia Market Y-o-Y Growth (%) Projections, By Capacity, 2022 to 2032

Figure 120: South Asia Market Attractiveness by Capacity, 2022 to 2032

Figure 121: South Asia Market Value (US$ million) Analysis by Sales Channel, 2017 to 2032

Figure 122: South Asia Market Volume (‘000 Units) Analysis by Sales Channel, 2017 to 2032

Figure 123: South Asia Market Y-o-Y Growth (%) Projections, By Sales Channel, 2022 to 2032

Figure 124: South Asia Market Attractiveness by Sales Channel, 2022 to 2032

Figure 125: Oceania Market Value (US$ million) Analysis by Country, 2017 to 2032

Figure 126: Oceania Market Volume (‘000 Units) Analysis by Country, 2017 to 2032

Figure 127: Oceania Market Y-o-Y Growth (%) Projections, By Country, 2022 to 2032

Figure 128: Oceania Market Attractiveness by Country, 2022 to 2032

Figure 129: Oceania Market Value (US$ million) Analysis by Product Type, 2017 to 2032

Figure 130: Oceania Market Volume (‘000 Units) Analysis by Product Type, 2017 to 2032

Figure 131: Oceania Market Y-o-Y Growth (%) Projections, By Product Type, 2022 to 2032

Figure 132: Oceania Market Attractiveness by Product Type, 2022 to 2032

Figure 133: Oceania Market Value (US$ million) Analysis by Application, 2017 to 2032

Figure 134: Oceania Market Volume (‘000 Units) Analysis by Application, 2017 to 2032

Figure 135: Oceania Market Y-o-Y Growth (%) Projections, By Application, 2022 to 2032

Figure 136: Oceania Market Attractiveness by Application, 2022 to 2032

Figure 137: Oceania Market Value (US$ million) Analysis by Capacity, 2017 to 2032

Figure 138: Oceania Market Volume (‘000 Units) Analysis by Capacity, 2017 to 2032

Figure 139: Oceania Market Y-o-Y Growth (%) Projections, By Capacity, 2022 to 2032

Figure 140: Oceania Market Attractiveness by Capacity, 2022 to 2032

Figure 141: Oceania Market Value (US$ million) Analysis by Sales Channel, 2017 to 2032

Figure 142: Oceania Market Volume (‘000 Units) Analysis by Sales Channel, 2017 to 2032

Figure 143: Oceania Market Y-o-Y Growth (%) Projections, By Sales Channel, 2022 to 2032

Figure 144: Oceania Market Attractiveness by Sales Channel, 2022 to 2032

Figure 145: MEA Market Value (US$ million) Analysis by Country, 2017 to 2032

Figure 146: MEA Market Volume (‘000 Units) Analysis by Country, 2017 to 2032

Figure 147: MEA Market Y-o-Y Growth (%) Projections, By Country, 2022 to 2032

Figure 148: MEA Market Attractiveness by Country, 2022 to 2032

Figure 149: MEA Market Value (US$ million) Analysis by Product Type, 2017 to 2032

Figure 150: MEA Market Volume (‘000 Units) Analysis by Product Type, 2017 to 2032

Figure 151: MEA Market Y-o-Y Growth (%) Projections, By Product Type, 2022 to 2032

Figure 152: MEA Market Attractiveness by Product Type, 2022 to 2032

Figure 153: MEA Market Value (US$ million) Analysis by Application, 2017 to 2032

Figure 154: MEA Market Volume (‘000 Units) Analysis by Application, 2017 to 2032

Figure 155: MEA Market Y-o-Y Growth (%) Projections, By Application, 2022 to 2032

Figure 156: MEA Market Attractiveness by Application, 2022 to 2032

Figure 157: MEA Market Value (US$ million) Analysis by Capacity, 2017 to 2032

Figure 158: MEA Market Volume (‘000 Units) Analysis by Capacity, 2017 to 2032

Figure 159: MEA Market Y-o-Y Growth (%) Projections, By Capacity, 2022 to 2032

Figure 160: MEA Market Attractiveness by Capacity, 2022 to 2032

Figure 161: MEA Market Value (US$ million) Analysis by Sales Channel, 2017 to 2032

Figure 162: MEA Market Volume (‘000 Units) Analysis by Sales Channel, 2017 to 2032

Figure 163: MEA Market Y-o-Y Growth (%) Projections, By Sales Channel, 2022 to 2032

Figure 164: MEA Market Attractiveness by Sales Channel, 2022 to 2032

Recommendations

Process Automation

Industrial Dishwasher Market

Published : December 2022

Consumer Product

Dishwasher Tablets Market

Published : October 2022

Consumer Product

Fully Integrated Dishwasher Market

Published : October 2022

Consumer Product

Residential Dishwashers Market

Published : June 2022

Explore Consumer Product Insights

View Reports

Automatic Dishwasher Market