Automatic Thermoforming Vacuum Machine Market Outlook and Forecast 2025 to 2035

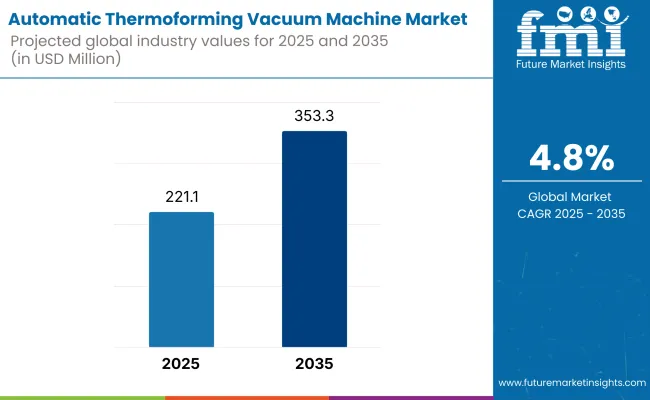
The automatic thermoforming vacuum machine market is set to expand steadily at a 4.8% CAGR from 2025 to 2035, with total market value projected to reach from USD 221.1 million in 2025 to USD 353.3 million by the end of the forecast period.
Quick Stats of Automatic Thermoforming Vacuum Machine Market

  • Market Value (2025): USD 221.1 million
  • Forecast Value (2035): USD 353.3 million
  • Forecast CAGR: 4.8%
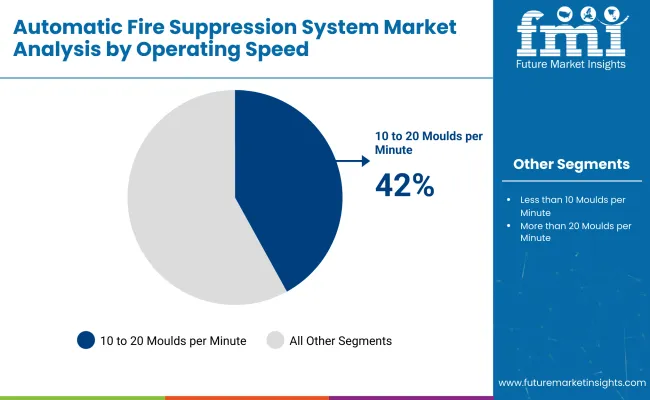
  • Operating Speed Leader in 2025: Machines with 10 to 20 Moulds per Minute (42% market share)
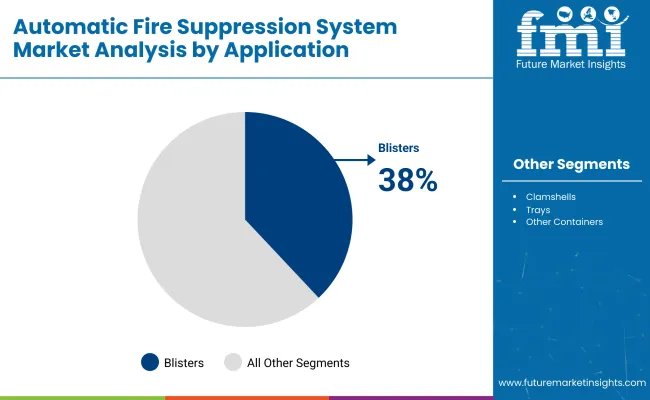
  • Top Application Segment: Blister Packaging (38% share)
  • Key Growth Region: East Asia (Japan is the fastest-growing market with 4.7% CAGR)

This growth is driven by rising demand for efficient, hygienic, and sustainable packaging solutions across food, pharmaceutical, and personal care sectors. Advancements in technologies such as servo-driven motion control, AI-powered inspection systems, and IoT-enabled sensors are key contributors to market expansion. Additionally, the increasing need for recyclable packaging materials and tool-less machine changeovers further supports market growth.

Government sustainability mandates and energy-efficiency incentives are facilitating equipment upgrades across manufacturing lines. Recent innovations in automatic thermoforming vacuum machines include the integration of servo-driven plug assist systems, which enhance material distribution and reduce scrap rates. Advanced HMI interfaces now allow real-time process monitoring, ensuring consistent product quality and faster cycle adjustments.

Metric Value
Industry Size (2025E) USD 221.1 million
Industry Value (2035F) USD 353.3 million
CAGR (2025 to 2035) 4.8%

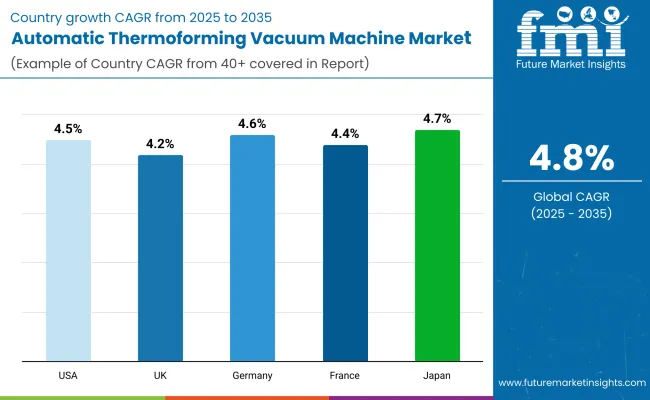
The automatic thermoforming vacuum machine market offers strong growth prospects across key segments and regions. Machines with 10 to 20 moulds per minute are expected to dominate the operating speed segment, capturing 42% of the market share by 2025. Blister packaging will lead the application segment, accounting for 38% of global demand. The USA market is forecasted to grow at a CAGR of 4.5%, while Japan and Germany will expand steadily at 4.7% and 4.6% CAGR, respectively.

Analyzing Automatic Thermoforming Vacuum Machine Market by Top Investment Segments

The automatic thermoforming vacuum machine market is segmented based on operating speed, application, end use, and region. By operating speed, the market includes machines with less than 10 moulds per minute, from 10 to 20 moulds per minute, and with more than 20 moulds per minute. By application, it is categorized into blisters, clamshells, trays, cups, and other containers (lids, bowls, medical packs, and food tubs). In terms of end use, the market serves industries such as food, pharmaceuticals, personal care & cosmetics, home care, and other industries (electronics, automotive, industrial packaging, and consumer goods). Regionally, the market is analyzed across North America, Latin America, Western Europe, Eastern Europe, East Asia, South Asia Pacific, and the Middle East and Africa.
Machines with 10 to 20 Moulds per Minute to Lead the Operating Speed Segment with 42% Market Share

Machines operating at 10 to 20 moulds per minute are projected to lead the operating speed segment, accounting for 42% of the global market share by 2025. These machines offer an ideal balance between throughput, precision, and cost-effectiveness, making them highly preferred by mid-sized packaging manufacturers across the food, pharmaceutical, and consumer goods sectors.
  • Applications requiring consistent quality are favoring this segment and moderate-to-high production output.
  • Machines in this range offer adaptability to various mold configurations, making them versatile across industries.
  • They integrate easily with automation technologies, supporting smart manufacturing setups.
  • Rising demand for flexible and semi-automated packaging lines is driving adoption in this speed range.

Blisters to Lead the Application Segment with 38% Market Share by 2025

Blister packaging is projected to command the application segment, accounting for 38% of the global market share in 2025. Its widespread use in pharmaceuticals, consumer electronics, and personal care products drives strong demand due to its protective, tamper-proof, and unit-dose features.

  • Extensively used in pharmaceutical packaging for tablets, capsules, and sterile products.
  • Preferred in retail packaging for electronics, cosmetics, and batteries due to visibility and theft resistance.
  • Compliant with FDA and EU regulations, making it ideal for regulated sectors.
  • Compatible with biodegradable and recyclable films, supporting sustainability mandates.

Food Industry to Lead the End Use Segment with 40% Market Share by 2025

The end use segment is expected to be led by the food industry, capturing 40% of the global market share in 2025, driven by increasing demand for hygienic, durable, and tamper-evident packaging solutions across fresh, frozen, and ready-to-eat products.

  • Widely used for meat, dairy, bakery, and convenience food packaging to enhance shelf life.
  • Machine adoption is being boosted by rising demand for vacuum-sealed and portion-controlled packaging.
  • Growth of e-commerce and food delivery services drives demand for lightweight, protective packaging.

Top Market Dynamics and Suppliers

The automatic thermoforming vacuum machine market is experiencing steady growth, fueled by rising demand for high-efficiency packaging solutions, sustainability-focused manufacturing, and advancements in automation technologies.

Recent Trends in This Market

  • Integration of AI and IoT in thermoforming machines for real-time quality control and predictive maintenance.
  • Surge in demand for biodegradable and recyclable material compatibility in packaging machinery.
  • Adoption of energy-efficient vacuum pumps to reduce operational costs and carbon footprint. Expansion of smart factories using Industry 4.0 technologies to enhance throughput and traceability.

Challenges

  • High initial investment costs restrict adoption among small and mid-sized manufacturers.
  • Strict packaging regulations in food and pharma demand constant machine upgrades and compliance.
  • Supply chain disruptions and raw material price volatility impact machine component availability.

Analyzing Top Countries Operating and Supplying Automatic Thermoforming Vacuum Machines

USA Automatic Thermoforming Vacuum Machines Market Analysis

The USA automatic thermoforming vacuum machine market is forecasted to grow at a CAGR of 4.5% from 2025 to 2035, driven by rising demand for advanced packaging in food, healthcare, and consumer goods. Regulatory emphasis on hygienic and sustainable packaging formats is prompting manufacturers to adopt high-precision and eco-compliant machinery.

  • Strong demand for food-safe, tamper-evident packaging.
  • High adoption of Industry 4.0 and smart factory technologies.
  • Favorable FDA guidelines supporting sterile packaging solutions.
  • Expanding pharmaceutical and medical device sectors.
  • Presence of leading automation solution providers driving innovation.

Automatic Thermoforming Vacuum Machine Sales Analysis in the UK.

The UK automatic thermoforming vacuum machine market is projected to expand at a CAGR of 4.2% during 2025-2035, supported by sustainability mandates, demand for recyclable materials, and investments in automation across food and healthcare sectors. Post-Brexit manufacturing shifts are also driving local production capacity and machine procurement.

  • Stringent EPR and recycling regulations shaping equipment needs.
  • Increasing demand for customized packaging in retail and pharma.
  • Growing consumption of frozen and ready-to-eat meals.
  • Strong emphasis on energy-efficient manufacturing practices.
  • Shift toward reshoring of packaging production post-Brexit.

Germany Automatic Thermoforming Vacuum Machine Market Analysis

Germany’s automatic thermoforming vacuum machine market is expected to witness a CAGR of 4.6% from 2025 to 2035, owing to its leadership in precision engineering and sustainable industrial practices. The country’s strong manufacturing base and commitment to recyclable packaging technologies support steady demand for thermoforming vacuum machines.

  • High investment in automation and AI-integrated machinery.
  • Compliance with EU’s single-use plastics directive.
  • Robust food and medical equipment packaging exports.
  • Growth in sustainable material processing technologies.
  • Strong presence of leading machine manufacturers and exporters.

Automatic Thermoforming Vacuum Machine Demand Analysis in France

The French automatic thermoforming vacuum machine market is anticipated to grow at a CAGR of 4.4% through 2035, driven by innovations in food processing, healthcare packaging, and regulatory-driven demand for low-waste packaging systems.

  • Increasing demand for vacuum-sealed and portioned food packaging.
  • Government incentives for eco-design in packaging lines.
  • Expanding pharmaceutical and biotech sectors requiring sterile formats.
  • Adoption of AI-based inspection and quality control systems.
  • Strong domestic production and export of packaging technologies.

Japan Automatic Thermoforming Vacuum Machine Market Analysis

Japan’s automatic thermoforming vacuum machine market demand is forecasted to grow at a CAGR of 4.7% between 2025 and 2035, supported by its advanced electronics and medical packaging industries. The country prioritizes compact, energy-efficient machinery, aligning with sustainability goals and limited factory space.

  • High reliance on smart, space-saving production systems.
  • Strict regulations driving demand for food-grade and medical packaging.
  • Increasing use of biodegradable plastics and eco-films.
  • Rapid integration of robotics and predictive maintenance systems.
  • Strong R&D investments in next-gen packaging automation.

Leading Automatic Thermoforming Vacuum Machine Suppliers and Manufacturers

The automatic thermoforming vacuum machine market is moderately consolidated, with a few prominent tier-one players and several niche-level competitors. Leading companies such as ILLIG Packaging Solutions GmbH, MULTIVAC Sepp Haggenmüller SE & Co. KG, and KIEFEL GmbH compete through relentless product innovation, pricing strategies, strategic partnerships, and global expansion. Their focus spans sustainability, modular design, automation, and Industry 4.0 integration, strengthening their offerings and market presence.

Tier-one firms continuously upgrade their portfolios with AI-powered quality control, IoT-enabled monitoring, and eco-conscious systems. In contrast, tier-two players like Formech Inc., Ridat, and Rajoo Engineers Ltd. serve smaller manufacturers with compact, cost-effective, and customizable machines.

Recent Automatic Thermoforming Vacuum Machine Industry News

In 2023, Asano Laboratories Co. Ltd. introduced a large-scale, high-speed pressure and vacuum thermoforming system equipped with a camera-based defect detection module.

Automatic Thermoforming Vacuum Machine Market - Report Scope

Report Attributes Details
Market Size (2025) USD 221.1 million
Projected Market Size (2035) USD 353.3 million
CAGR (2025 to 2035) 4.8%
Base Year for Estimation 2024
Historical Period 2020-2024
Projections Period 2025-2035
Report Parameters Revenue in USD million
By Operating Speed Analyzed With less than 10 Moulds per Minute, From 10 to 20 Moulds per Minute, and With more than 20 Moulds per Minute
By Application Analyzed Blisters, Clamshells, Trays, Cups, and Other Containers (Lids, Bowls, Medical Packs, and Food Tubs)
By End Use Analyzed Food, Pharmaceuticals, Personal Care & Cosmetics, Home Care, and Other Industries (Electronics, Automotive, Industrial Packaging, and Consumer Goods)
Regions Covered North America, Latin America, Western Europe, Eastern Europe, East Asia, South Asia Pacific, Middle East and Africa
Countries Covered United States, Canada, United Kingdom, Germany, France, China, Japan, South Korea, Brazil, Australia
Key Players Asano Laboratories Co. Ltd., FRIMO Group GmbH, Gabler Thermoform GmbH & Co. KG, Brown Machine Group Holdings LLC, Algus Packaging Inc, Webomatic Maschinenfabrik GmbH, GEISS AG, Rajoo Engineers Ltd, COMI S.p.A, GN Thermoforming Equipment, and Other Major Players
Additional Attributes Dollar sales by value, market share analysis by region, country-wise analysis.

Market Segmentation

By Operating Speed:

In terms of Operating Speed, the industry is divided into With less than 10 Moulds per Minute, From 10 to 20 Moulds per Minute, With more than 20 Moulds per Minute

By Application:

In terms of Application, the industry is divided into Blisters, Clamshells, Trays, Cups, Other Containers

By Region:

The report covers key regions, including North America, Latin America, Western Europe, Eastern Europe, East Asia, South Asia, and the Middle East and Africa (MEA).

Table of Content

  1. Executive Summary
  2. Industry Introduction, including Taxonomy and Market Definition
  3. Market Trends and Success Factors, including Macro-economic Factors, Market Dynamics, and Recent Industry Developments
  4. Global Market Demand Analysis 2020 to 2024 and Forecast 2025 to 2035, including Historical Analysis and Future Projections
  5. Pricing Analysis
  6. Global Market Analysis 2020 to 2024 and Forecast 2025 to 2035
    • Operating Speed
    • Application
    • End Use
  7. Global Market Analysis 2020 to 2024 and Forecast 2025 to 2035, By Operating Speed
    • With less than 10 Moulds per Minute
    • From 10 to 20 Moulds per Minute
    • With more than 20 Moulds per Minute
  8. Global Market Analysis 2020 to 2024 and Forecast 2025 to 2035, By Application
    • Blisters
    • Clamshells
    • Trays
    • Cups
    • Other Containers
  9. Global Market Analysis 2020 to 2024 and Forecast 2025 to 2035, By End Use
    • Food
    • Pharmaceuticals
    • Personal Care & Cosmetics
    • Home Care
    • Other Industries
  10. Global Market Analysis 2020 to 2024 and Forecast 2025 to 2035, By Region
    • North America
    • Latin America
    • Western Europe
    • Eastern Europe
    • East Asia
    • South Asia Pacific
    • Middle East and Africa
  11. North America Sales Analysis 2020 to 2024 and Forecast 2025 to 2035, by Key Segments and Countries
  12. Latin America Sales Analysis 2020 to 2024 and Forecast 2025 to 2035, by Key Segments and Countries
  13. Western Europe Sales Analysis 2020 to 2024 and Forecast 2025 to 2035, by Key Segments and Countries
  14. Eastern Europe Sales Analysis 2020 to 2024 and Forecast 2025 to 2035, by Key Segments and Countries
  15. East Asia Sales Analysis 2020 to 2024 and Forecast 2025 to 2035, by Key Segments and Countries
  16. South Asia Pacific Sales Analysis 2020 to 2024 and Forecast 2025 to 2035, by Key Segments and Countries
  17. Middle East and Africa Sales Analysis 2020 to 2024 and Forecast 2025 to 2035, by Key Segments and Countries
  18. Sales Forecast 2025 to 2035 by Operating Speed, Application, and End Use for 30 Countries
  19. Competition Outlook, including Market Structure Analysis, Company Share Analysis by Key Players, and Competition Dashboard
  20. Company Profile
    • Asano Laboratories Co. Ltd.
    • FRIMO Group GmbH
    • Gabler Thermoform GmbH & Co. KG
    • Brown Machine Group Holdings LLC
    • Algus Packaging Inc
    • Webomatic Maschinenfabrik GmbH
    • GEISS AG
    • Rajoo Engineers Ltd
    • COMI S.p.A
    • GN Thermoforming Equipment
    • Other Major Players

List of Tables

  • Table 1: Global Market Value (USD Million) Forecast by Region, 2020 to 2035
  • Table 2: Global Market Volume (Units) Forecast by Region, 2020 to 2035
  • Table 3: Global Market Value (USD Million) Forecast by Operating Speed, 2020 to 2035
  • Table 4: Global Market Volume (Units) Forecast by Operating Speed, 2020 to 2035
  • Table 5: Global Market Value (USD Million) Forecast by Application, 2020 to 2035
  • Table 6: Global Market Volume (Units) Forecast by Application, 2020 to 2035
  • Table 7: Global Market Value (USD Million) Forecast by End Use, 2020 to 2035
  • Table 8: Global Market Volume (Units) Forecast by End Use, 2020 to 2035
  • Table 9: North America Market Value (USD Million) Forecast by Country, 2020 to 2035
  • Table 10: North America Market Volume (Units) Forecast by Country, 2020 to 2035
  • Table 11: North America Market Value (USD Million) Forecast by Operating Speed, 2020 to 2035
  • Table 12: North America Market Volume (Units) Forecast by Operating Speed, 2020 to 2035
  • Table 13: North America Market Value (USD Million) Forecast by Application, 2020 to 2035
  • Table 14: North America Market Volume (Units) Forecast by Application, 2020 to 2035
  • Table 15: North America Market Value (USD Million) Forecast by End Use, 2020 to 2035
  • Table 16: North America Market Volume (Units) Forecast by End Use, 2020 to 2035
  • Table 17: Latin America Market Value (USD Million) Forecast by Country, 2020 to 2035
  • Table 18: Latin America Market Volume (Units) Forecast by Country, 2020 to 2035
  • Table 19: Latin America Market Value (USD Million) Forecast by Operating Speed, 2020 to 2035
  • Table 20: Latin America Market Volume (Units) Forecast by Operating Speed, 2020 to 2035
  • Table 21: Latin America Market Value (USD Million) Forecast by Application, 2020 to 2035
  • Table 22: Latin America Market Volume (Units) Forecast by Application, 2020 to 2035
  • Table 23: Latin America Market Value (USD Million) Forecast by End Use, 2020 to 2035
  • Table 24: Latin America Market Volume (Units) Forecast by End Use, 2020 to 2035
  • Table 25: Western Europe Market Value (USD Million) Forecast by Country, 2020 to 2035
  • Table 26: Western Europe Market Volume (Units) Forecast by Country, 2020 to 2035
  • Table 27: Western Europe Market Value (USD Million) Forecast by Operating Speed, 2020 to 2035
  • Table 28: Western Europe Market Volume (Units) Forecast by Operating Speed, 2020 to 2035
  • Table 29: Western Europe Market Value (USD Million) Forecast by Application, 2020 to 2035
  • Table 30: Western Europe Market Volume (Units) Forecast by Application, 2020 to 2035
  • Table 31: Western Europe Market Value (USD Million) Forecast by End Use, 2020 to 2035
  • Table 32: Western Europe Market Volume (Units) Forecast by End Use, 2020 to 2035
  • Table 33: Eastern Europe Market Value (USD Million) Forecast by Country, 2020 to 2035
  • Table 34: Eastern Europe Market Volume (Units) Forecast by Country, 2020 to 2035
  • Table 35: Eastern Europe Market Value (USD Million) Forecast by Operating Speed, 2020 to 2035
  • Table 36: Eastern Europe Market Volume (Units) Forecast by Operating Speed, 2020 to 2035
  • Table 37: Eastern Europe Market Value (USD Million) Forecast by Application, 2020 to 2035
  • Table 38: Eastern Europe Market Volume (Units) Forecast by Application, 2020 to 2035
  • Table 39: Eastern Europe Market Value (USD Million) Forecast by End Use, 2020 to 2035
  • Table 40: Eastern Europe Market Volume (Units) Forecast by End Use, 2020 to 2035
  • Table 41: South Asia and Pacific Market Value (USD Million) Forecast by Country, 2020 to 2035
  • Table 42: South Asia and Pacific Market Volume (Units) Forecast by Country, 2020 to 2035
  • Table 43: South Asia and Pacific Market Value (USD Million) Forecast by Operating Speed, 2020 to 2035
  • Table 44: South Asia and Pacific Market Volume (Units) Forecast by Operating Speed, 2020 to 2035
  • Table 45: South Asia and Pacific Market Value (USD Million) Forecast by Application, 2020 to 2035
  • Table 46: South Asia and Pacific Market Volume (Units) Forecast by Application, 2020 to 2035
  • Table 47: South Asia and Pacific Market Value (USD Million) Forecast by End Use, 2020 to 2035
  • Table 48: South Asia and Pacific Market Volume (Units) Forecast by End Use, 2020 to 2035
  • Table 49: East Asia Market Value (USD Million) Forecast by Country, 2020 to 2035
  • Table 50: East Asia Market Volume (Units) Forecast by Country, 2020 to 2035
  • Table 51: East Asia Market Value (USD Million) Forecast by Operating Speed, 2020 to 2035
  • Table 52: East Asia Market Volume (Units) Forecast by Operating Speed, 2020 to 2035
  • Table 53: East Asia Market Value (USD Million) Forecast by Application, 2020 to 2035
  • Table 54: East Asia Market Volume (Units) Forecast by Application, 2020 to 2035
  • Table 55: East Asia Market Value (USD Million) Forecast by End Use, 2020 to 2035
  • Table 56: East Asia Market Volume (Units) Forecast by End Use, 2020 to 2035
  • Table 57: Middle East and Africa Market Value (USD Million) Forecast by Country, 2020 to 2035
  • Table 58: Middle East and Africa Market Volume (Units) Forecast by Country, 2020 to 2035
  • Table 59: Middle East and Africa Market Value (USD Million) Forecast by Operating Speed, 2020 to 2035
  • Table 60: Middle East and Africa Market Volume (Units) Forecast by Operating Speed, 2020 to 2035
  • Table 61: Middle East and Africa Market Value (USD Million) Forecast by Application, 2020 to 2035
  • Table 62: Middle East and Africa Market Volume (Units) Forecast by Application, 2020 to 2035
  • Table 63: Middle East and Africa Market Value (USD Million) Forecast by End Use, 2020 to 2035
  • Table 64: Middle East and Africa Market Volume (Units) Forecast by End Use, 2020 to 2035

List of Figures

  • Figure 1: Global Market Value (USD Million) by Operating Speed, 2025 to 2035
  • Figure 2: Global Market Value (USD Million) by Application, 2025 to 2035
  • Figure 3: Global Market Value (USD Million) by End Use, 2025 to 2035
  • Figure 4: Global Market Value (USD Million) by Region, 2025 to 2035
  • Figure 5: Global Market Value (USD Million) Analysis by Region, 2020 to 2035
  • Figure 6: Global Market Volume (Units) Analysis by Region, 2020 to 2035
  • Figure 7: Global Market Value Share (%) and BPS Analysis by Region, 2025 to 2035
  • Figure 8: Global Market Y-o-Y Growth (%) Projections by Region, 2025 to 2035
  • Figure 9: Global Market Value (USD Million) Analysis by Operating Speed, 2020 to 2035
  • Figure 10: Global Market Volume (Units) Analysis by Operating Speed, 2020 to 2035
  • Figure 11: Global Market Value Share (%) and BPS Analysis by Operating Speed, 2025 to 2035
  • Figure 12: Global Market Y-o-Y Growth (%) Projections by Operating Speed, 2025 to 2035
  • Figure 13: Global Market Value (USD Million) Analysis by Application, 2020 to 2035
  • Figure 14: Global Market Volume (Units) Analysis by Application, 2020 to 2035
  • Figure 15: Global Market Value Share (%) and BPS Analysis by Application, 2025 to 2035
  • Figure 16: Global Market Y-o-Y Growth (%) Projections by Application, 2025 to 2035
  • Figure 17: Global Market Value (USD Million) Analysis by End Use, 2020 to 2035
  • Figure 18: Global Market Volume (Units) Analysis by End Use, 2020 to 2035
  • Figure 19: Global Market Value Share (%) and BPS Analysis by End Use, 2025 to 2035
  • Figure 20: Global Market Y-o-Y Growth (%) Projections by End Use, 2025 to 2035
  • Figure 21: Global Market Attractiveness by Operating Speed, 2025 to 2035
  • Figure 22: Global Market Attractiveness by Application, 2025 to 2035
  • Figure 23: Global Market Attractiveness by End Use, 2025 to 2035
  • Figure 24: Global Market Attractiveness by Region, 2025 to 2035
  • Figure 25: North America Market Value (USD Million) by Operating Speed, 2025 to 2035
  • Figure 26: North America Market Value (USD Million) by Application, 2025 to 2035
  • Figure 27: North America Market Value (USD Million) by End Use, 2025 to 2035
  • Figure 28: North America Market Value (USD Million) by Country, 2025 to 2035
  • Figure 29: North America Market Value (USD Million) Analysis by Country, 2020 to 2035
  • Figure 30: North America Market Volume (Units) Analysis by Country, 2020 to 2035
  • Figure 31: North America Market Value Share (%) and BPS Analysis by Country, 2025 to 2035
  • Figure 32: North America Market Y-o-Y Growth (%) Projections by Country, 2025 to 2035
  • Figure 33: North America Market Value (USD Million) Analysis by Operating Speed, 2020 to 2035
  • Figure 34: North America Market Volume (Units) Analysis by Operating Speed, 2020 to 2035
  • Figure 35: North America Market Value Share (%) and BPS Analysis by Operating Speed, 2025 to 2035
  • Figure 36: North America Market Y-o-Y Growth (%) Projections by Operating Speed, 2025 to 2035
  • Figure 37: North America Market Value (USD Million) Analysis by Application, 2020 to 2035
  • Figure 38: North America Market Volume (Units) Analysis by Application, 2020 to 2035
  • Figure 39: North America Market Value Share (%) and BPS Analysis by Application, 2025 to 2035
  • Figure 40: North America Market Y-o-Y Growth (%) Projections by Application, 2025 to 2035
  • Figure 41: North America Market Value (USD Million) Analysis by End Use, 2020 to 2035
  • Figure 42: North America Market Volume (Units) Analysis by End Use, 2020 to 2035
  • Figure 43: North America Market Value Share (%) and BPS Analysis by End Use, 2025 to 2035
  • Figure 44: North America Market Y-o-Y Growth (%) Projections by End Use, 2025 to 2035
  • Figure 45: North America Market Attractiveness by Operating Speed, 2025 to 2035
  • Figure 46: North America Market Attractiveness by Application, 2025 to 2035
  • Figure 47: North America Market Attractiveness by End Use, 2025 to 2035
  • Figure 48: North America Market Attractiveness by Country, 2025 to 2035
  • Figure 49: Latin America Market Value (USD Million) by Operating Speed, 2025 to 2035
  • Figure 50: Latin America Market Value (USD Million) by Application, 2025 to 2035
  • Figure 51: Latin America Market Value (USD Million) by End Use, 2025 to 2035
  • Figure 52: Latin America Market Value (USD Million) by Country, 2025 to 2035
  • Figure 53: Latin America Market Value (USD Million) Analysis by Country, 2020 to 2035
  • Figure 54: Latin America Market Volume (Units) Analysis by Country, 2020 to 2035
  • Figure 55: Latin America Market Value Share (%) and BPS Analysis by Country, 2025 to 2035
  • Figure 56: Latin America Market Y-o-Y Growth (%) Projections by Country, 2025 to 2035
  • Figure 57: Latin America Market Value (USD Million) Analysis by Operating Speed, 2020 to 2035
  • Figure 58: Latin America Market Volume (Units) Analysis by Operating Speed, 2020 to 2035
  • Figure 59: Latin America Market Value Share (%) and BPS Analysis by Operating Speed, 2025 to 2035
  • Figure 60: Latin America Market Y-o-Y Growth (%) Projections by Operating Speed, 2025 to 2035
  • Figure 61: Latin America Market Value (USD Million) Analysis by Application, 2020 to 2035
  • Figure 62: Latin America Market Volume (Units) Analysis by Application, 2020 to 2035
  • Figure 63: Latin America Market Value Share (%) and BPS Analysis by Application, 2025 to 2035
  • Figure 64: Latin America Market Y-o-Y Growth (%) Projections by Application, 2025 to 2035
  • Figure 65: Latin America Market Value (USD Million) Analysis by End Use, 2020 to 2035
  • Figure 66: Latin America Market Volume (Units) Analysis by End Use, 2020 to 2035
  • Figure 67: Latin America Market Value Share (%) and BPS Analysis by End Use, 2025 to 2035
  • Figure 68: Latin America Market Y-o-Y Growth (%) Projections by End Use, 2025 to 2035
  • Figure 69: Latin America Market Attractiveness by Operating Speed, 2025 to 2035
  • Figure 70: Latin America Market Attractiveness by Application, 2025 to 2035
  • Figure 71: Latin America Market Attractiveness by End Use, 2025 to 2035
  • Figure 72: Latin America Market Attractiveness by Country, 2025 to 2035
  • Figure 73: Western Europe Market Value (USD Million) by Operating Speed, 2025 to 2035
  • Figure 74: Western Europe Market Value (USD Million) by Application, 2025 to 2035
  • Figure 75: Western Europe Market Value (USD Million) by End Use, 2025 to 2035
  • Figure 76: Western Europe Market Value (USD Million) by Country, 2025 to 2035
  • Figure 77: Western Europe Market Value (USD Million) Analysis by Country, 2020 to 2035
  • Figure 78: Western Europe Market Volume (Units) Analysis by Country, 2020 to 2035
  • Figure 79: Western Europe Market Value Share (%) and BPS Analysis by Country, 2025 to 2035
  • Figure 80: Western Europe Market Y-o-Y Growth (%) Projections by Country, 2025 to 2035
  • Figure 81: Western Europe Market Value (USD Million) Analysis by Operating Speed, 2020 to 2035
  • Figure 82: Western Europe Market Volume (Units) Analysis by Operating Speed, 2020 to 2035
  • Figure 83: Western Europe Market Value Share (%) and BPS Analysis by Operating Speed, 2025 to 2035
  • Figure 84: Western Europe Market Y-o-Y Growth (%) Projections by Operating Speed, 2025 to 2035
  • Figure 85: Western Europe Market Value (USD Million) Analysis by Application, 2020 to 2035
  • Figure 86: Western Europe Market Volume (Units) Analysis by Application, 2020 to 2035
  • Figure 87: Western Europe Market Value Share (%) and BPS Analysis by Application, 2025 to 2035
  • Figure 88: Western Europe Market Y-o-Y Growth (%) Projections by Application, 2025 to 2035
  • Figure 89: Western Europe Market Value (USD Million) Analysis by End Use, 2020 to 2035
  • Figure 90: Western Europe Market Volume (Units) Analysis by End Use, 2020 to 2035
  • Figure 91: Western Europe Market Value Share (%) and BPS Analysis by End Use, 2025 to 2035
  • Figure 92: Western Europe Market Y-o-Y Growth (%) Projections by End Use, 2025 to 2035
  • Figure 93: Western Europe Market Attractiveness by Operating Speed, 2025 to 2035
  • Figure 94: Western Europe Market Attractiveness by Application, 2025 to 2035
  • Figure 95: Western Europe Market Attractiveness by End Use, 2025 to 2035
  • Figure 96: Western Europe Market Attractiveness by Country, 2025 to 2035
  • Figure 97: Eastern Europe Market Value (USD Million) by Operating Speed, 2025 to 2035
  • Figure 98: Eastern Europe Market Value (USD Million) by Application, 2025 to 2035
  • Figure 99: Eastern Europe Market Value (USD Million) by End Use, 2025 to 2035
  • Figure 100: Eastern Europe Market Value (USD Million) by Country, 2025 to 2035
  • Figure 101: Eastern Europe Market Value (USD Million) Analysis by Country, 2020 to 2035
  • Figure 102: Eastern Europe Market Volume (Units) Analysis by Country, 2020 to 2035
  • Figure 103: Eastern Europe Market Value Share (%) and BPS Analysis by Country, 2025 to 2035
  • Figure 104: Eastern Europe Market Y-o-Y Growth (%) Projections by Country, 2025 to 2035
  • Figure 105: Eastern Europe Market Value (USD Million) Analysis by Operating Speed, 2020 to 2035
  • Figure 106: Eastern Europe Market Volume (Units) Analysis by Operating Speed, 2020 to 2035
  • Figure 107: Eastern Europe Market Value Share (%) and BPS Analysis by Operating Speed, 2025 to 2035
  • Figure 108: Eastern Europe Market Y-o-Y Growth (%) Projections by Operating Speed, 2025 to 2035
  • Figure 109: Eastern Europe Market Value (USD Million) Analysis by Application, 2020 to 2035
  • Figure 110: Eastern Europe Market Volume (Units) Analysis by Application, 2020 to 2035
  • Figure 111: Eastern Europe Market Value Share (%) and BPS Analysis by Application, 2025 to 2035
  • Figure 112: Eastern Europe Market Y-o-Y Growth (%) Projections by Application, 2025 to 2035
  • Figure 113: Eastern Europe Market Value (USD Million) Analysis by End Use, 2020 to 2035
  • Figure 114: Eastern Europe Market Volume (Units) Analysis by End Use, 2020 to 2035
  • Figure 115: Eastern Europe Market Value Share (%) and BPS Analysis by End Use, 2025 to 2035
  • Figure 116: Eastern Europe Market Y-o-Y Growth (%) Projections by End Use, 2025 to 2035
  • Figure 117: Eastern Europe Market Attractiveness by Operating Speed, 2025 to 2035
  • Figure 118: Eastern Europe Market Attractiveness by Application, 2025 to 2035
  • Figure 119: Eastern Europe Market Attractiveness by End Use, 2025 to 2035
  • Figure 120: Eastern Europe Market Attractiveness by Country, 2025 to 2035
  • Figure 121: South Asia and Pacific Market Value (USD Million) by Operating Speed, 2025 to 2035
  • Figure 122: South Asia and Pacific Market Value (USD Million) by Application, 2025 to 2035
  • Figure 123: South Asia and Pacific Market Value (USD Million) by End Use, 2025 to 2035
  • Figure 124: South Asia and Pacific Market Value (USD Million) by Country, 2025 to 2035
  • Figure 125: South Asia and Pacific Market Value (USD Million) Analysis by Country, 2020 to 2035
  • Figure 126: South Asia and Pacific Market Volume (Units) Analysis by Country, 2020 to 2035
  • Figure 127: South Asia and Pacific Market Value Share (%) and BPS Analysis by Country, 2025 to 2035
  • Figure 128: South Asia and Pacific Market Y-o-Y Growth (%) Projections by Country, 2025 to 2035
  • Figure 129: South Asia and Pacific Market Value (USD Million) Analysis by Operating Speed, 2020 to 2035
  • Figure 130: South Asia and Pacific Market Volume (Units) Analysis by Operating Speed, 2020 to 2035
  • Figure 131: South Asia and Pacific Market Value Share (%) and BPS Analysis by Operating Speed, 2025 to 2035
  • Figure 132: South Asia and Pacific Market Y-o-Y Growth (%) Projections by Operating Speed, 2025 to 2035
  • Figure 133: South Asia and Pacific Market Value (USD Million) Analysis by Application, 2020 to 2035
  • Figure 134: South Asia and Pacific Market Volume (Units) Analysis by Application, 2020 to 2035
  • Figure 135: South Asia and Pacific Market Value Share (%) and BPS Analysis by Application, 2025 to 2035
  • Figure 136: South Asia and Pacific Market Y-o-Y Growth (%) Projections by Application, 2025 to 2035
  • Figure 137: South Asia and Pacific Market Value (USD Million) Analysis by End Use, 2020 to 2035
  • Figure 138: South Asia and Pacific Market Volume (Units) Analysis by End Use, 2020 to 2035
  • Figure 139: South Asia and Pacific Market Value Share (%) and BPS Analysis by End Use, 2025 to 2035
  • Figure 140: South Asia and Pacific Market Y-o-Y Growth (%) Projections by End Use, 2025 to 2035
  • Figure 141: South Asia and Pacific Market Attractiveness by Operating Speed, 2025 to 2035
  • Figure 142: South Asia and Pacific Market Attractiveness by Application, 2025 to 2035
  • Figure 143: South Asia and Pacific Market Attractiveness by End Use, 2025 to 2035
  • Figure 144: South Asia and Pacific Market Attractiveness by Country, 2025 to 2035
  • Figure 145: East Asia Market Value (USD Million) by Operating Speed, 2025 to 2035
  • Figure 146: East Asia Market Value (USD Million) by Application, 2025 to 2035
  • Figure 147: East Asia Market Value (USD Million) by End Use, 2025 to 2035
  • Figure 148: East Asia Market Value (USD Million) by Country, 2025 to 2035
  • Figure 149: East Asia Market Value (USD Million) Analysis by Country, 2020 to 2035
  • Figure 150: East Asia Market Volume (Units) Analysis by Country, 2020 to 2035
  • Figure 151: East Asia Market Value Share (%) and BPS Analysis by Country, 2025 to 2035
  • Figure 152: East Asia Market Y-o-Y Growth (%) Projections by Country, 2025 to 2035
  • Figure 153: East Asia Market Value (USD Million) Analysis by Operating Speed, 2020 to 2035
  • Figure 154: East Asia Market Volume (Units) Analysis by Operating Speed, 2020 to 2035
  • Figure 155: East Asia Market Value Share (%) and BPS Analysis by Operating Speed, 2025 to 2035
  • Figure 156: East Asia Market Y-o-Y Growth (%) Projections by Operating Speed, 2025 to 2035
  • Figure 157: East Asia Market Value (USD Million) Analysis by Application, 2020 to 2035
  • Figure 158: East Asia Market Volume (Units) Analysis by Application, 2020 to 2035
  • Figure 159: East Asia Market Value Share (%) and BPS Analysis by Application, 2025 to 2035
  • Figure 160: East Asia Market Y-o-Y Growth (%) Projections by Application, 2025 to 2035
  • Figure 161: East Asia Market Value (USD Million) Analysis by End Use, 2020 to 2035
  • Figure 162: East Asia Market Volume (Units) Analysis by End Use, 2020 to 2035
  • Figure 163: East Asia Market Value Share (%) and BPS Analysis by End Use, 2025 to 2035
  • Figure 164: East Asia Market Y-o-Y Growth (%) Projections by End Use, 2025 to 2035
  • Figure 165: East Asia Market Attractiveness by Operating Speed, 2025 to 2035
  • Figure 166: East Asia Market Attractiveness by Application, 2025 to 2035
  • Figure 167: East Asia Market Attractiveness by End Use, 2025 to 2035
  • Figure 168: East Asia Market Attractiveness by Country, 2025 to 2035
  • Figure 169: Middle East and Africa Market Value (USD Million) by Operating Speed, 2025 to 2035
  • Figure 170: Middle East and Africa Market Value (USD Million) by Application, 2025 to 2035
  • Figure 171: Middle East and Africa Market Value (USD Million) by End Use, 2025 to 2035
  • Figure 172: Middle East and Africa Market Value (USD Million) by Country, 2025 to 2035
  • Figure 173: Middle East and Africa Market Value (USD Million) Analysis by Country, 2020 to 2035
  • Figure 174: Middle East and Africa Market Volume (Units) Analysis by Country, 2020 to 2035
  • Figure 175: Middle East and Africa Market Value Share (%) and BPS Analysis by Country, 2025 to 2035
  • Figure 176: Middle East and Africa Market Y-o-Y Growth (%) Projections by Country, 2025 to 2035
  • Figure 177: Middle East and Africa Market Value (USD Million) Analysis by Operating Speed, 2020 to 2035
  • Figure 178: Middle East and Africa Market Volume (Units) Analysis by Operating Speed, 2020 to 2035
  • Figure 179: Middle East and Africa Market Value Share (%) and BPS Analysis by Operating Speed, 2025 to 2035
  • Figure 180: Middle East and Africa Market Y-o-Y Growth (%) Projections by Operating Speed, 2025 to 2035
  • Figure 181: Middle East and Africa Market Value (USD Million) Analysis by Application, 2020 to 2035
  • Figure 182: Middle East and Africa Market Volume (Units) Analysis by Application, 2020 to 2035
  • Figure 183: Middle East and Africa Market Value Share (%) and BPS Analysis by Application, 2025 to 2035
  • Figure 184: Middle East and Africa Market Y-o-Y Growth (%) Projections by Application, 2025 to 2035
  • Figure 185: Middle East and Africa Market Value (USD Million) Analysis by End Use, 2020 to 2035
  • Figure 186: Middle East and Africa Market Volume (Units) Analysis by End Use, 2020 to 2035
  • Figure 187: Middle East and Africa Market Value Share (%) and BPS Analysis by End Use, 2025 to 2035
  • Figure 188: Middle East and Africa Market Y-o-Y Growth (%) Projections by End Use, 2025 to 2035
  • Figure 189: Middle East and Africa Market Attractiveness by Operating Speed, 2025 to 2035
  • Figure 190: Middle East and Africa Market Attractiveness by Application, 2025 to 2035
  • Figure 191: Middle East and Africa Market Attractiveness by End Use, 2025 to 2035
  • Figure 192: Middle East and Africa Market Attractiveness by Country, 2025 to 2035

Frequently Asked Questions

What is the size of the automatic thermoforming vacuum machine market in 2025?

The market is projected to reach USD 221.1 million by the end of 2025.

What is the expected CAGR for the automatic thermoforming vacuum machine market from 2025 to 2035?

The market is anticipated to grow at a CAGR of 4.8% during the forecast period.

Which segment leads the automatic thermoforming vacuum machine market by operating speed?

Machines with 10 to 20 moulds per minute are expected to lead with a 42% share in 2025.

Who are the top players in the automatic thermoforming vacuum machine market?

Top players in the automatic thermoforming vacuum machine market include ILLIG, MULTIVAC, KIEFEL, Formech, Ridat, Rajoo Engineers, and Asano Laboratories.

Which region is expected to grow the fastest in automatic thermoforming vacuum machine market?

Japan is projected to be the fastest-growing region with a CAGR of 4.7%.

Explore Similar Insights

Future Market Insights

Automatic Thermoforming Vacuum Machine Market