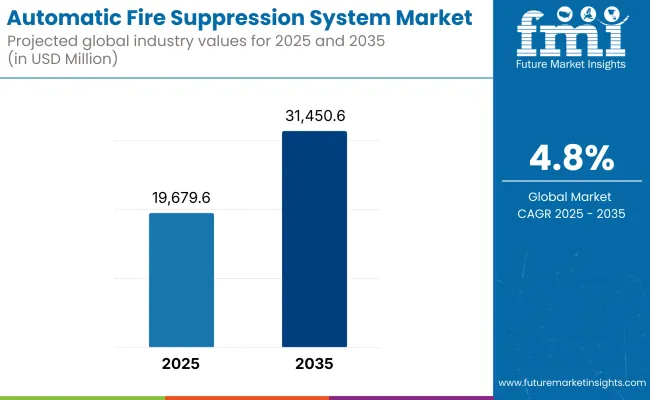
The automatic fire suppression system (AFSS) market is projected to grow robustly between 2025 and 2035, driven by increasing enforcement of fire safety regulations, expanding deployment in commercial and industrial infrastructure, and growing demand for automated risk mitigation technologies. The market is expected to be valued at USD 19,679.6 million in 2025 and is anticipated to reach USD 31,450.6 million by 2035, reflecting a CAGR of 4.8% over the forecast period.
Automatic fire suppression systems are composed of fire detectors, control panels, suppression agents, and discharge mechanisms that are designed to detect and suppress fires without human interaction. They are also gaining wide acceptance at data centers, industrial plants, public transport systems, military vehicles, mining equipment, critical infrastructure facility, etc.
Development of clean agent-based systems, AI-based detection, and integrated IoT fire safety networks helps support growth, but high installation costs, complex retrofitting, and environmental compliance from agents remain the challenges.
Some of the major trends include non-toxic suppression media, remote diagnostics & control, modular fire panels & AI-based early fire detection integrated to building management systems.
Product Type Market Share (2025)
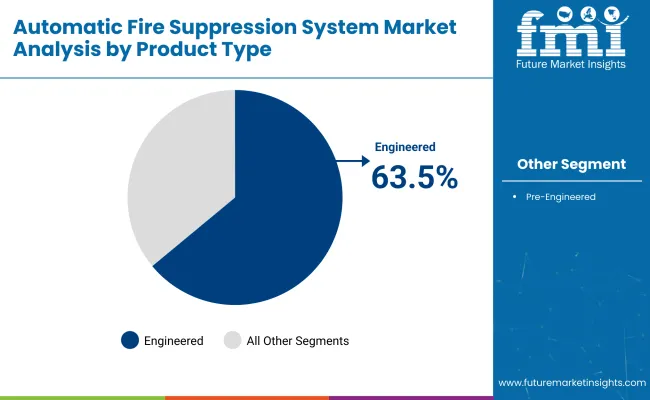
Automatic fire suppression systems engineered are expected to make up the largest share of the global AFSS market by 2025, at 63.5% of the total market value. These are designed and tailored for the fire protection needs of large, complex spaces such as an industrial facility, data center, or energy infrastructure.
In contrast to pre-engineered systems, engineered AFSS are designed following a detailed hazard analysis and risk assessment, enabling them to be integrated with advanced fire detection, ventilation, and emergency response systems. This also improves fire protection coverage, as well as regulatory compliance in sectors such as manufacturing and mining.
Demand for advanced, scalable, and high-capacity engineered AFSS is poised to continue its uphill ascent across various industries as safety regulations become more and more stringent and asset protection continues to be a priority for critical infrastructure.
End Use Industry Market Share (2025)
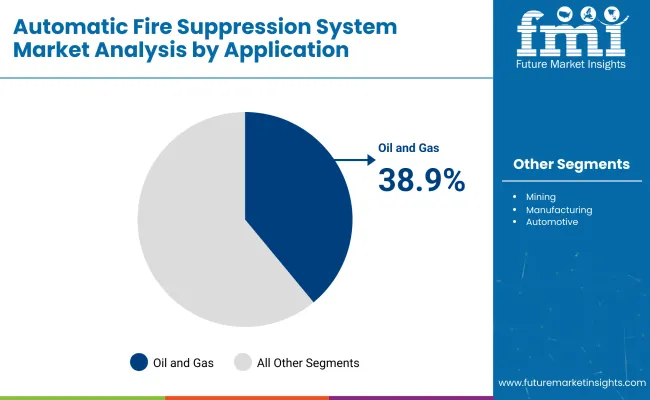
By 2025, the automatic fire suppression system market share is expected to be led by the oil and gas sector, which will capture 38.9% of the global market value. With operations around flammable materials, pressurized systems, and remote, dangerous environments, this industry depends on robust and fail-safe fire suppression technologies to deliver personnel safety and asset protection.
Sector-wise AFSS solutions are critical to onshore and offshore drilling rigs, refineries, storage operating facilities, and liquefied natural gas (LNG) terminals. Increasingly common in the field of engineered systems for fast detection and suppression of hydrocarbon fires, many systems can be suppressed early before flame escalation through clean agents, foam-based systems or inert gas technologies.
Increased focus on disaster mitigation and changing safety standards as determined by regulatory bodies is propelling continuous spending on fire protection infrastructure, which operates across upstream, midstream, and downstream operations. Hence, the oil and gas industry will continue to be the most crucial and steady end-use industry of advanced AFSS solutions in the world.
The North American market dominates due to stringent NFPA codes, valuable infrastructure, and prevalent knowledge of fire safety liability. In the USA, deployment means using it in the likes of data centers, subways and oil rigs. Regional deployments create demand for thermal runaway suppression systems and growing EV charging infrastructure. It will invest in clean agent systems for heritage buildings, telecom hubs, and remote power generation sites in Canada.
EU fire safety directives, industrial modernization, and the F-gas regulation framework’s shift to sustainable suppression agents shape Europe’s market. Also in marine, aerospace and rail, there is an increasing adoption of water mist systems, HFC-free gaseous agents, and engineered systems in Germany, the UK, France, the Netherlands, and Italy. The EU is also investing in resilient infrastructure and digital factories, which will spur growth as well.
The Asia-Pacific region is the fastest-growing area of the world, fueled by rapid urbanization, growing manufacturing and energy infrastructure, and increasing fire safety awareness in China, India, Japan, South Korea, and Southeast Asia.
China is using AFSS in mega projects, tunnels and logistics hubs, while that of India is seeing an increase in its use in commercial buildings, mining vehicles and renewable energy storage facilities. Japan and South Korea are the ones leading AFSS integration with robotics and automated factories.
Retrofitting Complexity, Agent Restrictions, and Cost Sensitivity
While demand is increasing, barriers to the adoption of refuelling stations include high upfront installation and integration costs, especially in older infrastructure. The challenges associated with space constraints, complicated wiring, and the regulatory approval of suppression agents add to this. In addition, the continued phase-out of certain HFC-based gases driven by environmental concerns requires manufacturers to innovate green thermal technology and navigate new standards.
Smart Fire Infrastructure, Green Suppression Agents, and Specialized Vehicles
New connectivity opportunities extend to smart buildings and digital twin ecosystems, where predictive suppression and risk modelling increase asset protection. Laboratory and cleanroom environments are particularly seeing an increase in demand for non-toxic and residue-free agents. Other potential high-impact applications definitely include AFSS in electric buses, specialty mining vehicles, defense platforms and battery storage enclosures, for which custom compact suppression systems can be leveraged.
The AFSS market has been witnessing steady growth from 2020 to 2024 due to increasing fire safety regulations, industrial automation, and increasing awareness regarding the protection of assets in critical infrastructure and transportation. Such demand was seen in sectors like manufacturing, mining, data centers, commercial kitchens, and military vehicles.
Dry chemical, clean agent, and water mist-based systems with integrated sensors and programmable control modules were among the most popular systems. However, retrofitting older equipment is expensive, installation in space-constrained environments can be complex, and regulatory fragmentation between regions has complicated the road to adoption.
As we head toward 2025 to 2035, the horizon will include an evolution of AI-powered fire detection, smart suppression actuation, and fully integrated fire risk analytics into the broader climate risk context. Advanced AFSS of the near future will incorporate real-time monitoring, remote system diagnostics, and cross-platform emergency response coordination with building management and security systems etc.
While sustainability and environmental regulations will drive the market with clean/low-GWP suppression agents and scalable, reusable system designs. Public and private demand for smart, nimble, and energy-efficient AFSS solutions will be further driven by urban densification, EV fleet adoption and climate-driven wildfire hazards.
Market Shifts: A Comparative Analysis 2020 to 2024 vs. 2025 to 2035
| Market Shift | 2020 to 2024 Trends |
|---|---|
| Regulatory Landscape | NFPA, FM Global, and UL compliance for commercial, industrial, and vehicle-based systems. |
| Technological Innovation | Pre-engineered mechanical and electric detection systems using dry chemical, foam, and clean agents. |
| Industry Adoption | Strong in mining vehicles, data centers, food processing, power plants, and military assets. |
| Smart & AI-Enabled Solutions | Basic alarm-suppression linkage and control panel-based logic. |
| Market Competition | It is led by Johnson Controls, Siemens, Kidde Technologies, Dafo Vehicle, and Firetrace. |
| Market Growth Drivers | Safety compliance, protection of high-value assets, automation in heavy industries, and rising fire risks. |
| Sustainability and Environmental Impact | Movement toward halon replacements and low-toxicity agents. |
| Integration of AI & Digitalization | Standalone digital panels with basic self-check systems. |
| Advancements in Product Design | Fixed and modular systems with hardwired sensors and basic agent delivery pipes. |
| Market Shift | 2025 to 2035 Projections |
|---|---|
| Regulatory Landscape | Real-time digital compliance reporting, global standards harmonization, and carbon-neutral suppression agent mandates. |
| Technological Innovation | AI-enhanced multi-sensor detection, adaptive suppression response, IoT-enabled diagnostics, and smart agent delivery optimization. |
| Industry Adoption | Expansion into electric vehicle fleets, autonomous equipment, modular server farms, urban transport hubs, and wildfire-exposed infrastructures. |
| Smart & AI-Enabled Solutions | AI-driven fire behaviour modelling, predictive failure detection, remote activation, and automated post-incident system health checks. |
| Market Competition | Growing competition from AI-native fire safety startups, green agent innovators, and integrated safety platform vendors targeting smart cities. |
| Market Growth Drivers | Growth fueled by EV safety mandates, smart city adoption, ESG-focused facility management, and rising insurance premiums linked to fire loss. |
| Sustainability and Environmental Impact | Full transition to low-GWP and eco-certified suppression agents, modular system reuse, and recyclable suppression cartridges and storage. |
| Integration of AI & Digitalization | Cloud-connected fire suppression ecosystems, AI-linked building management integration, and blockchain-verified safety compliance logs. |
| Advancements in Product Design | Wireless-enabled, self-contained units with energy-efficient valves, 360° sensor arrays, voice alert integration, and modular retrofit kits. |
The automatic fire suppression system (AFSS) market in the United States is experiencing consistent growth due to stringent fire safety regulations for commercial, industrial, and residential applications. Pre-engineered and engineered Automatic Fire Suppression System (AFSS) solutions are in high demand in data centers, warehouses, aircraft hangars, and heavy vehicles. Fire-protection technology that uses impregnated materials, electrically charged air, bio-simulation, nanotechnology, and micro-encapsulation is becoming more common.
Modern improvements in sensor technologies, remote monitoring, and actuation mechanisms are better addressing fire detection and response. Adoption is being propelled even more through NFPA code updates and insurance mandates.
| Country | CAGR (2025 to 2035) |
|---|---|
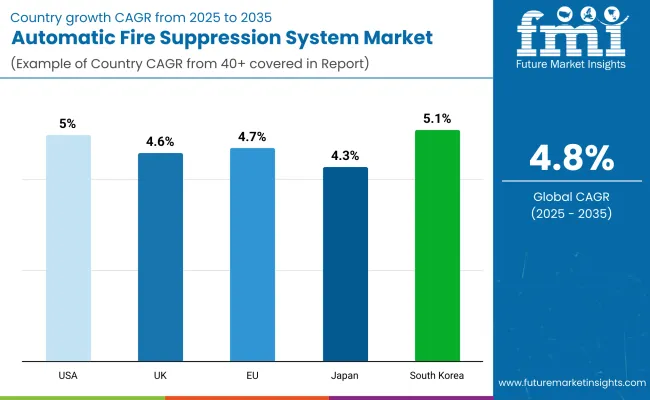
| United States | 5.0% |
There is a steady growth of the AFSS market in the UK, driven by reforms of fire regulations post-Grenfell and more money invested in fire safety in high-rise buildings and public infrastructure. The growing adoption of automatic suppression systems in transport vehicles, energy facilities, and historic buildings propels growth.
There is also increasing demand for clean agent and water mist-based AFSS in the server rooms and healthcare environments. Market growth is driven by government incentives for retrofitting old fire protection systems and greater awareness among property owners.
| Country | CAGR (2025 to 2035) |
|---|---|
| United Kingdom | 4.6% |
The European Union AFSS market is governed by Germany, France, and the Netherlands owing to robust EN fire safety regulations and increasing demand for automation in risk mitigation. Automatic suppression systems are an important adoption in industrial sites, logistics hubs, and mass transit systems. European manufacturers are emphasising green suppression agents, intelligent control panels and integrated fire and gas detection equipment platforms. This has further boosted the utilisation of this market across developed and developing EU regions, with regulatory support for retrofitting existing infrastructure with new modern AFSS.
| Region | CAGR (2025 to 2035) |
|---|---|
| European Union | 4.7% |
Japan’s AFSS market is slowly growing, driven by a strong focus on disaster prevention, strict building codes, and increased adoption of advanced fire protection in public facilities. Compact, effective suppression systems for high-density, urban environments are best-in-class, with fire suppression available with no compromises.
Japanese corporations are also searching for hybrid systems that incorporate aerosol, gas, and fine water mist systems for rapid suppression while limiting collateral damage. Continued steady growth driven by widespread use in industrial automation, rail transit and commercial kitchens.
| Country | CAGR (2025 to 2035) |
|---|---|
| Japan | 4.3% |
The market for automatic fire suppression systems in South Korea is booming, underpinned by smart city developments, industrial safety requirements, and the incorporation of advanced suppression technology in important infrastructure.
AFSS are becoming more popular in high-tech manufacturing, underground transportation, and in high-rise residential buildings. Domestic manufacturers are developing devices with wireless sensors, AI-enabled detection algorithms and energy-efficient actuation systems. The government-led modernization of aging public facilities and export-oriented industrial parks is also driving demand in the market.
| Country | CAGR (2025 to 2035) |
|---|---|
| South Korea | 5.1% |
These factors includes rising adoption of fire safety regulations, increasing smart building infrastructure, a growing focus on asset protection in high-risk environments are likely to drive growth you may see in the automatic fire suppression system (AFSS) market.
AFSS solutions use water, foam, gas, or clean agents for quick, independent fire detection and extinguishing, making them the right choice for usage in commercial buildings, data centers, transport vehicles, manufacturing settings, and mining machinery. Stringent fire codes, the rise of industrial automation, the growth of urban infrastructure, and the need for minimal human intervention during emergencies are among the key market drivers.
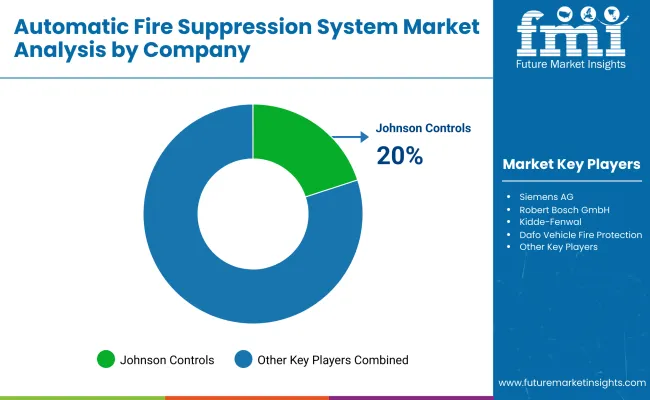
Market Share Analysis by Key Players
| Company/Organization Name | Key Offerings/Activities |
|---|---|
| Johnson Controls International | In 2024, Johnson Controls enhanced its ANSUL® and TYCO® automatic fire suppression systems with cloud-based diagnostics and hybrid clean agent systems designed for mission-critical infrastructure. |
| Siemens AG | As of 2023, Siemens launched its Cerberus™ PRO intelligent AFSS platform, integrating fire detection, suppression, and building automation for smart infrastructure applications. |
| Robert Bosch GmbH | In 2025, Bosch introduced vehicle-mounted AFSS modules for electric buses and heavy-duty fleets, featuring early thermal detection and dual-action suppression with minimal wiring. |
| Kidde-Fenwal, Inc. | In 2023, Kidde expanded its IND Series™ clean agent AFSS units , offering UL/FM-certified solutions for data centers, server rooms, and healthcare facilities with low-residue suppression. |
| Dafo Vehicle Fire Protection AB | As of 2024 , Dafo rolled out its latest AF-X Fire Suppression system tailored for off-road machinery and mining vehicles, with 24/7 auto-detection and liquid agent distribution. |
Key Market Insights
Johnson Controls (20-24%)
Market leader offering a full suite of AFSS technologies across sectors, Johnson Controls is recognized for scalable fire protection solutions backed by global service networks and compliance with NFPA and EN standards.
Siemens AG (16-20%)
A key player in integrated building safety, Siemens combines fire detection and suppression with digital control systems to deliver holistic, automated safety in smart cities and industrial facilities.
Robert Bosch GmbH (11-15%)
Bosch specializes in compact, vehicle-mounted AFSS systems for automotive and transport sectors, especially in the growing EV and public mobility markets.
Kidde-Fenwal (9-13%)
Known for clean agent and specialty suppression systems, Kidde is widely adopted in data-sensitive environments where minimal residue and fast action are critical.
Dafo Vehicle Fire Protection (6-9%)
Focuses on ruggedized AFSS systems for heavy vehicles and industrial machinery, Dafo leads in thermal hazard suppression within the mining, forestry, and construction sectors.
Other Key Players (Combined Share: 22-28%)
Numerous regional manufacturers and specialized OEM suppliers are advancing the market with compact modular systems, IoT-based suppression monitoring, and green suppression agents, including:
The overall market size for the automatic fire suppression system (AFSS) market was USD 19,679.6 million in 2025.
The automatic fire suppression system (AFSS) market is expected to reach USD 31,450.6 million in 2035.
The demand for automatic fire suppression systems will be driven by increasing fire safety regulations across industries, rising construction of commercial and residential buildings, growing need for asset protection in high-risk environments, and advancements in smart detection and suppression technologies.
The top 5 countries driving the development of the automatic fire suppression system (AFSS) market are the USA, China, Germany, Japan, and the UK
The engineered fire suppression systems segment is expected to command a significant share over the assessment period.


Full Research Suite comprises of:
Market outlook & trends analysis
Interviews & case studies
Strategic recommendations
Vendor profiles & capabilities analysis
5-year forecasts
8 regions and 60+ country-level data splits
Market segment data splits
12 months of continuous data updates
DELIVERED AS:
PDF EXCEL ONLINE
Automatic Weigh Price Labeling Machine Market Size and Share Forecast Outlook 2025 to 2035
Automatic Bending Machine Market Size and Share Forecast Outlook 2025 to 2035
Automatic Transmission Market Size and Share Forecast Outlook 2025 to 2035
Automatic Impact Testing Machine Market Size and Share Forecast Outlook 2025 to 2035
Automatic Glue Machine Market Size and Share Forecast Outlook 2025 to 2035
Automatic Floodgate Market Size and Share Forecast Outlook 2025 to 2035
Automatic Die Cutting Machines Market Size and Share Forecast Outlook 2025 to 2035
Automatic Silver Sintering Die Attach Machine Market Size and Share Forecast Outlook 2025 to 2035
Automatic Emergency Braking (AEB) Market Size and Share Forecast Outlook 2025 to 2035
Automatic Identification and Data Capture Market Size and Share Forecast Outlook 2025 to 2035
Automatic Transfer Switch Market Size and Share Forecast Outlook 2025 to 2035
Automatic Weapons Market Size and Share Forecast Outlook 2025 to 2035
Automatic Bottle Opener Market Size and Share Forecast Outlook 2025 to 2035
Automatic Hog Feeder Market Size and Share Forecast Outlook 2025 to 2035
Automatic Goat Waterer Market Size and Share Forecast Outlook 2025 to 2035
Automatic Wine Dispensers Market Size and Share Forecast Outlook 2025 to 2035
Automatic Content Recognition Market Size and Share Forecast Outlook 2025 to 2035
Automatic Coffee Machine Market Analysis – Size, Share & Forecast 2025 to 2035
Automatic Dishwasher Market Size and Share Forecast Outlook 2025 to 2035
Automatic Dicing Saw Market Analysis - Size, Share, and Forecast Outlook 2025 to 2035

Thank you!
You will receive an email from our Business Development Manager. Please be sure to check your SPAM/JUNK folder too.
Chat With
MaRIA