The automatic weigh price labeling machine market is projected to grow from USD 351.1 million in 2025 to USD 677.9 million by 2035, at a CAGR of 6.8%. The demand is closely tied to increasing automation in food processing, pharmaceutical, and logistics industries, where these machines enhance operational efficiency, labeling accuracy, and compliance with food safety standards. The 13 to 60 kg load capacity segment dominates the market, accounting for 44% of the market share in 2025, supported by its ability to handle a wide range of products while maintaining precision in labeling.
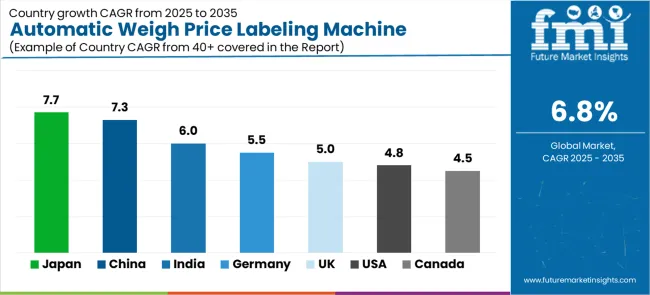
The food and beverages sector leads the end-use applications, commanding 35% of the market share in 2025, driven by regulatory enforcement and consumer demand for product traceability. Pharmaceutical applications represent the second-largest segment, benefiting from the need for precise dosage labeling and FDA compliance. The 13 to 60 kg load capacity segment's popularity stems from its adaptability across diverse industrial applications, from packaged goods to bulk items. Regionally, East Asia, North America, and Western Europe lead market growth, with Japan (7.7% CAGR) and China (7.3% CAGR) taking prominent roles due to industrial automation and stringent food safety regulations.
In Europe, Germany holds the largest market share, driven by its industrial automation infrastructure, while emerging markets such as India (6.0% CAGR) show steady growth, supported by expanding food processing and pharmaceutical manufacturing. The United States (4.8% CAGR) and Canada (4.5% CAGR) are focused on regulatory compliance and e-commerce logistics, showing steady demand for automation solutions across food and pharmaceutical sectors.
As consumer expectations for quick and accurate labeling increase, retailers and online marketplaces are turning to automated solutions to streamline their operations. Automatic weigh price labeling machines enable retailers to automatically weigh products, generate price labels based on weight and price, and apply them to items, reducing the time spent on manual labor and improving overall workflow efficiency. Additionally, the rise of fresh food and perishable goods sales, which often require weight-based pricing, is fueling the adoption of these machines in grocery stores, supermarkets, and distribution centers.
The growing trend of automation in manufacturing and packaging industries also contributes to the market's growth. In food processing, consumer goods manufacturing, and logistics, automatic weigh price labeling machines help businesses optimize packaging processes, improve labeling accuracy, and ensure compliance with regulatory standards. Manufacturers increasingly require reliable, high-speed labeling solutions for mass-produced products that need to be labeled quickly, efficiently, and consistently. With businesses under pressure to reduce operational costs and increase throughput, the adoption of automated systems, such as weigh price labeling machines, is becoming increasingly critical in maintaining competitive advantage.
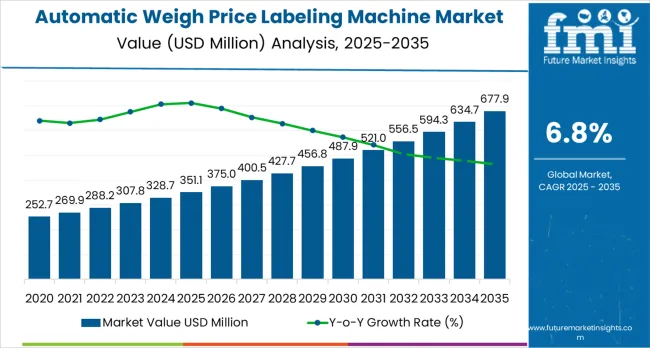
Between 2025 and 2030, the automatic weigh price labeling machine market is projected to expand from USD 351.1 million to USD 487.9 million, resulting in a value increase of USD 136.8 million, which represents 41.8% of the total forecast growth for the decade. This phase of development will be shaped by rising demand for automation across food and beverage, pharmaceutical, and logistics industries, technological advancements including digital touch-screen interfaces and smart labeling features, as well as expanding integration with Industry 4.0 and IoT technologies. Companies are establishing competitive positions through investment in advanced manufacturing technologies, high-speed throughput systems, and strategic market expansion across food processing, pharmaceuticals, and e-commerce logistics applications.
From 2030 to 2035, the market is forecast to grow from USD 487.9 million to USD 677.9 million, adding another USD 190.7 million, which constitutes 58.2% of the ten-year expansion. This period is expected to be characterized by the proliferation of AI-enabled smart labeling systems, including advanced QR code integration and augmented reality capabilities tailored for enhanced traceability requirements, strategic collaborations between equipment manufacturers and end-user industries, and an enhanced focus on regulatory compliance and operational efficiency. The growing emphasis on supply chain transparency and automated production processes will drive demand for advanced, high-performance automatic weigh price labeling solutions across diverse industrial applications.
| Metric | Value |
|---|---|
| Market Value (2025) | USD 351.1 million |
| Market Forecast Value (2035) | USD 677.9 million |
| Forecast CAGR (2025-2035) | 6.8% |
The automatic weigh price labeling machine market grows by enabling manufacturers to achieve superior operational efficiency and accuracy in product weighing, pricing, and labeling processes across food processing, pharmaceutical, and logistics facilities.
Industrial manufacturers face mounting pressure to improve automation and regulatory compliance, with automatic weigh price labeling solutions typically providing 85-95% improvement in labeling accuracy and processing speed compared to manual systems, making advanced automated solutions essential for competitive manufacturing operations.
The food and beverage industry's need for precise product information and traceability creates demand for advanced labeling solutions that can minimize errors, enhance throughput, and ensure consistent performance across diverse operational conditions. Government initiatives promoting food safety standards and supply chain transparency drive adoption in food processing, pharmaceutical manufacturing, and logistics applications, where operational performance has a direct impact on compliance and consumer safety.
High initial capital investment and the complexity of integrating automated systems with existing production lines may limit adoption rates among smaller manufacturers and developing regions with limited technical infrastructure.
The market is segmented by throughput rate, load capacity, end-use, and region. By throughput rate, the market is divided into below 50 ppm, 50 to 150 ppm, and above 150 ppm. Based on load capacity, the market is categorized into below 12 kg, 13 to 60 kg, and above 60 kg.
By end-use, the market is segmented into food and beverages, dairy products, flesh foods, agricultural produce, ready to use, bakery and confectionery, pharmaceutical use, personal care products, logistics and packaging, and others. Regionally, the market is divided into North America, Latin America, Western Europe, Eastern Europe, East Asia, South Asia Pacific, and Middle East &Africa.
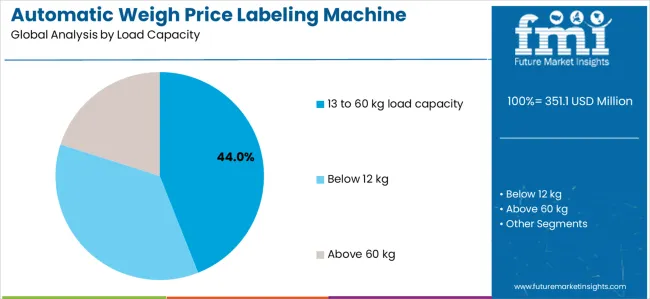
The 13 to 60 kg load capacity segment represents the dominant force in the automatic weigh price labeling machine market, capturing approximately 44% of total market share in 2025. This medium-capacity category encompasses applications featuring optimal balance between handling capacity and operational flexibility, including enhanced versatility for diverse product types and optimized performance combinations that enable superior processing efficiency and adaptability across various industrial applications.
The 13 to 60 kg segment's market leadership stems from its exceptional applicability in medium-weight product processing, with machines capable of handling a wide range of packaged goods, bulk items, and industrial components while maintaining consistent accuracy and operational reliability across diverse manufacturing environments.
The below 12 kg segment maintains a substantial market share, serving manufacturers who require precise labeling solutions for smaller products and lightweight applications. These machines offer reliable performance for specialty food products, pharmaceutical items, and consumer goods while providing sufficient accuracy to meet regulatory requirements in food processing and pharmaceutical manufacturing applications.
Key technological advantages driving the 13 to 60 kg segment include:
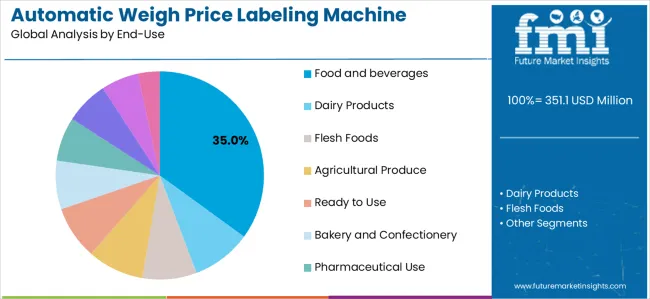
Food and beverages applications dominate the automatic weigh price labeling machine market with approximately 35% market share in 2025, reflecting the critical role of accurate labeling in food safety compliance and consumer transparency requirements. The food and beverage segment's market leadership is reinforced by increasing regulatory enforcement, standardized labeling requirements, and rising consumer demand for product traceability that directly correlates with quality assurance and brand reputation.
The pharmaceutical use segment represents the second-largest end-use category, capturing significant market share through specialized requirements for precise dosage labeling, regulatory compliance, and quality control applications. This segment benefits from growing demand for automated systems that meet stringent pharmaceutical manufacturing standards and FDA compliance requirements.
The logistics and packaging segment accounts for substantial market share, serving distribution centers and e-commerce facilities requiring high-speed labeling solutions. The personal care products segment captures market shares through specialized labeling applications, while other end-use categories represent emerging market segments.
Key market dynamics supporting end-use growth include:
The market is driven by three concrete demand factors tied to industrial automation and regulatory compliance outcomes. First, increasing automation requirements across food processing, pharmaceutical, and logistics industries create growing demand for high-precision labeling solutions, with global e-commerce projected to continue expanding rapidly, requiring specialized equipment solutions for maximum operational efficiency.
Second, regulatory compliance requirements and food safety standards drive the adoption of automated labeling technologies, with manufacturers seeking 85-95% improvement in accuracy and regulatory compliance enhancement. Third, technological advancements in digital interfaces and smart labeling technologies enable more effective and reliable equipment solutions that reduce manual errors while improving long-term operational efficiency and cost-effectiveness.
Market restraints include high initial capital investment that can impact adoption rates and profitability margins, particularly for smaller manufacturers or facilities with limited automation budgets affecting key equipment components and implementation costs. Technical complexity in system integration poses another significant challenge, as achieving consistent performance standards across different production environments and equipment configurations requires specialized technical expertise and comprehensive training programs, potentially causing installation delays and increased operational costs.
Maintenance requirements and the need for skilled technicians create additional challenges for manufacturers, demanding ongoing investment in technical support capabilities and compliance with varying regional operational standards.
Key trends indicate accelerated adoption in emerging markets, particularly China, India, and Brazil, where rapid industrial modernization and food processing expansion drive comprehensive automation system development. Technology advancement trends toward AI integration with enhanced predictive maintenance, real-time data analytics, and multi-functional smart labeling capabilities enable next-generation product development that addresses multiple operational requirements simultaneously. The market thesis could face disruption if alternative labeling technologies or significant changes in regulatory requirements minimize reliance on traditional automatic weigh price labeling solutions.
| Country | CAGR (2025-2035) |
|---|---|
| Japan | 7.7% |
| China | 7.3% |
| India | 6.0% |
| Germany | 5.5% |
| United Kingdom | 5.0% |
| United States | 4.8% |
| Canada | 4.5% |
The automatic weigh price labeling machine market is gaining momentum worldwide, with Japan taking the lead thanks to advanced manufacturing technologies and strong consumer demand for convenience foods. Close behind, China benefits from rapid industrial automation and stringent food safety regulations, positioning itself as a strategic growth hub in the Asia Pacific region.
India shows steady advancement, where expanding food processing industry and pharmaceutical manufacturing strengthen its role in the South Asian market development. Germany is focusing on Industry 4.0 initiatives and EU regulatory compliance, signaling an ambition to capitalize on growing opportunities in European automation markets.
Meanwhile, the United States stands out for its federal compliance mandates and e-commerce logistics expansion, recording consistent progress in industrial automation advancement. Together, Japan and China anchor the global expansion story, while other markets build stability and diversity into the market's growth path.
The report provides an in-depth analysis of over 40 countries, with top-performing countries highlighted below.
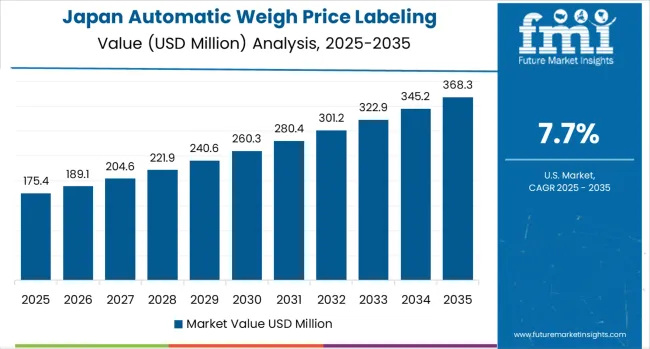
Japan demonstrates the strongest growth potential in the automatic weigh price labeling machine market with a CAGR of 7.7% through 2035. The country's leadership position stems from advanced manufacturing technologies, strong consumer preference for ready-to-eat products, and comprehensive quality control requirements driving the adoption of high-precision labeling systems.
Growth is concentrated in major industrial regions, including Tokyo, Osaka, Nagoya, and Kyushu, where food manufacturers and pharmaceutical companies are implementing advanced automated labeling solutions for enhanced production performance and regulatory compliance.
Distribution channels through established equipment suppliers and direct manufacturer relationships expand deployment across food processing facilities and pharmaceutical manufacturing centers. The country's technology innovation strategy provides policy support for advanced manufacturing development, including automated equipment system adoption.
Key market factors:
The automatic weigh price labeling machine market demonstrates strong growth momentum with a CAGR of 7.3% through 2035, linked to comprehensive manufacturing capacity expansion and increasing focus on export quality compliance solutions. In Beijing, Shanghai, Guangzhou, and Shenzhen, the adoption of automatic weigh price labeling systems is accelerating across food processing facilities and pharmaceutical manufacturing centers, driven by food safety regulations and government industrial automation initiatives.
Chinese manufacturers are implementing advanced automated labeling systems and quality control platforms to enhance production performance while meeting growing demand for processed foods and pharmaceutical products in domestic and international markets. The country's industrial modernization programs create increased demand for high-performance automation solutions, while increasing emphasis on supply chain transparency drives adoption of advanced labeling and tracking technologies.
The automatic weigh price labeling machine market maintains steady growth through focus on industrial modernization and manufacturing competitiveness, with a CAGR of 6.0% through 2035.The expanding food processing industry in India demonstrates sophisticated implementation of automatic weigh price labeling systems, with documented case studies showing efficiency improvements in pharmaceutical and food applications through optimized automation solutions.
The country's manufacturing infrastructure in major industrial centers, including Mumbai, Delhi, Bangalore, and Chennai, showcases integration of advanced labeling technologies with existing production systems, leveraging expertise in pharmaceutical manufacturing and food processing. Indian manufacturers emphasize regulatory compliance and export quality standards, creating demand for high-performance automated solutions that support pharmaceutical exports and food safety initiatives.
Key development areas:
The market expansion in Germany is driven by diverse industrial demand, including food processing in Bavaria and Baden-Württemberg regions, pharmaceutical manufacturing in North Rhine-Westphalia and Hesse, and comprehensive automation implementation across multiple manufacturing sectors.
The country demonstrates promising growth potential with a CAGR of 5.5% through 2035, supported by Industry 4.0 initiatives and European Union regulatory compliance requirements. German manufacturers face implementation challenges related to integration complexity and technical expertise requirements, requiring equipment upgrade approaches and comprehensive training programs.
Growing automation targets and manufacturing efficiency requirements create compelling business cases for automatic weigh price labeling system adoption, particularly in food processing and pharmaceutical manufacturing regions where precision has a direct impact on product quality and regulatory compliance.
Market characteristics:
The United Kingdom's market expansion is supported by comprehensive regulatory framework and growing demand for automated solutions in food processing and pharmaceutical sectors. The market demonstrates steady growth with a CAGR of 5.0% through 2035, driven by Brexit-related supply chain optimization and increasing emphasis on domestic manufacturing capabilities.
Growth is concentrated in major industrial regions, including England's Midlands, Northern manufacturing centers, and Scottish food processing facilities, where manufacturers are implementing advanced labeling systems for enhanced operational efficiency and regulatory compliance. British manufacturers emphasize quality standards and traceability requirements, creating demand for high-performance automated solutions that support export competitiveness and food safety initiatives.
Key development areas:
The United States market leads in advanced industrial automation based on integration with next-generation manufacturing technologies and sophisticated processing applications for enhanced operational characteristics. The country shows solid potential with a CAGR of 4.8% through 2035, driven by federal regulatory compliance requirements and advanced manufacturing initiatives across major industrial regions, including California, Texas, Illinois, and New York.
American manufacturers are adopting advanced automated labeling systems for regulatory compliance and operational optimization, particularly in regions with FDA mandates and advanced processing facilities requiring superior product differentiation. Technology deployment channels through established equipment distributors and direct manufacturer relationships expand coverage across food processing and pharmaceutical manufacturing facilities.
Leading market segments:
The automatic weigh price labeling machine market expansion in Canada is driven by a comprehensive regulatory framework promoting supply chain transparency and growing demand for automated solutions in food processing and pharmaceutical manufacturing. The market demonstrates consistent growth with a CAGR of 4.5% through 2035, supported by cross-border trade requirements and increasing emphasis on organic and specialty food processing capabilities.
Growth is concentrated in major industrial regions, including Ontario, Quebec, and British Columbia, where manufacturers are implementing advanced automated labeling systems for enhanced export competitiveness and regulatory compliance. Canadian manufacturers emphasize quality standards and environmental compliance, creating demand for energy-efficient automated solutions that support food safety initiatives and pharmaceutical manufacturing standards.
Market characteristics:
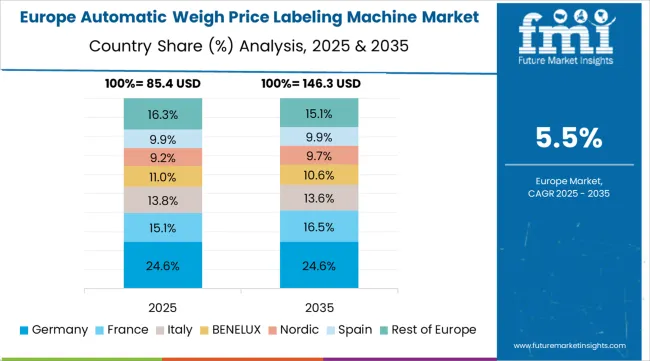
The automatic weigh price labeling machine market in Europe is projected to grow from USD 98.3 million in 2025 to USD 142.7 million by 2035, registering a CAGR of 3.8% over the forecast period. Germany is expected to maintain its leadership position with a 32.1% market share in 2025, declining slightly to 31.8% by 2035, supported by its extensive industrial automation infrastructure and major manufacturing centers, including Bavaria, North Rhine-Westphalia, and Baden-Württemberg production facilities.
France follows with a 24.2% share in 2025, projected to reach 24.6% by 2035, driven by comprehensive food processing development programs and advanced manufacturing initiatives implementing automated labeling technologies. Italy holds a 18.9% share in 2025, expected to maintain 18.5% by 2035 through ongoing industrial facility upgrades and food processing technology development.
United Kingdom commands a 14.3% share, while Spain accounts for 7.2% in 2025. The Rest of Europe region is anticipated to gain momentum, expanding its collective share from 3.3% to 4.8% by 2035, attributed to increasing automatic weigh price labeling machine adoption in Nordic countries and emerging Eastern European manufacturing facilities implementing advanced automation programs.
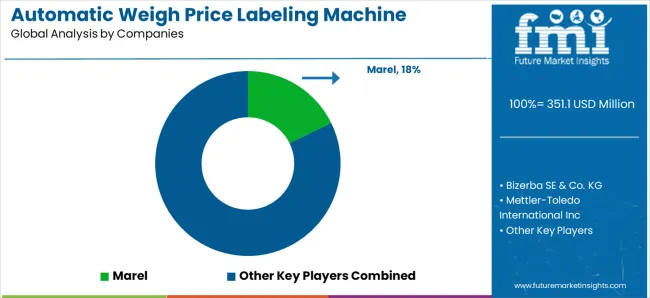
The automatic weigh price labeling machine market is composed of 10–15 key players, with the top five companies controlling around 55–60% of global market share, driven by their technological innovation, product quality, and established customer relationships in retail, food processing, and packaging industries. Competition is centered around machine accuracy, speed, ease of integration, and cost-effectiveness, rather than price alone. Marel leads the market with an 18% share, supported by its extensive product portfolio and strong presence in the food processing industry, providing highly efficient and automated labeling solutions.
Market leaders such as Marel, Bizerba SE & Co. KG, Mettler-Toledo International Inc., and Ishida Co., Ltd. maintain their dominance through advanced technologies that combine accurate weighing with automatic price labeling, which are crucial for sectors like retail and food processing. These companies leverage their vast global networks, R&D capabilities, and deep industry expertise to offer tailored solutions that meet specific regulatory standards and customer requirements.
Challengers such as Teraoka Seiko Co., Ltd., SF Engineering, and iXAPACK GLOBAL focus on providing cost-effective, reliable, and flexible labeling systems designed for smaller-scale operations or niche markets. Regional players like Wedderburn, NEMESIS srl, and R.S. Bilance S.r.l. strengthen their position by offering customized solutions and localized customer support, catering to specific regional needs and expanding their presence in emerging markets.
Automatic weigh price labeling machines represent specialized industrial equipment that enable manufacturers to achieve 85-95% improvement in labeling accuracy compared to manual systems, delivering superior operational performance and efficiency enhancement with advanced automation capabilities in demanding food processing, pharmaceutical, and logistics applications.
With the market projected to grow from USD 351.1 million in 2025 to USD 677.9 million by 2035 at a 6.8% CAGR, these automation systems offer compelling advantages - enhanced processing accuracy, customizable throughput configurations, and operational reliability - making them essential for food processing applications, pharmaceutical manufacturing operations, and logistics facilities seeking alternatives to manual labeling systems that compromise efficiency through human error and inconsistent performance.
Scaling market adoption and technological advancement requires coordinated action across regulatory policy, industrial standards development, equipment manufacturers, end-user industries, and automation technology investment capital.
| Items | Values |
|---|---|
| Quantitative Units | USD 351.1 million |
| Throughput Rate | Below 50 ppm, 50 to 150 ppm, Above 150 ppm |
| Load Capacity | Below 12 kg, 13 to 60 kg, Above 60 kg |
| End-Use | Food and Beverages, Dairy Products, Flesh Foods, Agricultural Produce, Ready to Use, Bakery and Confectionery, Pharmaceutical Use, Personal Care Products, Logistics and Packaging, Others |
| Regions Covered | North America, Latin America, Western Europe, Eastern Europe, East Asia, South Asia Pacific, Middle East &Africa |
| Country Covered | Japan, China, India, Germany, United Kingdom, United States, Canada, and 40+ countries |
| Key Companies Profiled | Marel, Bizerba SE & Co. KG, Mettler-Toledo International Inc, Ishida Co., Ltd., Teraoka Seiko Co., Ltd., SF Engineering, iXAPACK GLOBAL, Wedderburn, NEMESIS srl, and R.S. Bilance S.r.l. |
| Additional Attributes | Dollar sales by throughput rate and load capacity categories, regional adoption trends across East Asia, North America, and Western Europe, competitive landscape with equipment providers and technology integrators, manufacturing facility requirements and specifications, integration with industrial automation and quality control systems, innovations in smart labeling technology and manufacturing systems, and development of specialized configurations with accuracy and efficiency capabilities. |
The global automatic weigh price labeling machine market is estimated to be valued at USD 351.1 million in 2025.
The market size for the automatic weigh price labeling machine market is projected to reach USD 677.9 million by 2035.
The automatic weigh price labeling machine market is expected to grow at a 6.8% CAGR between 2025 and 2035.
The key product types in automatic weigh price labeling machine market are 13 to 60 kg load capacity , below 12 kg and above 60 kg.
In terms of end-use, food and beverages segment to command 35.0% share in the automatic weigh price labeling machine market in 2025.


Our Research Products

The "Full Research Suite" delivers actionable market intel, deep dives on markets or technologies, so clients act faster, cut risk, and unlock growth.

The Leaderboard benchmarks and ranks top vendors, classifying them as Established Leaders, Leading Challengers, or Disruptors & Challengers.

Locates where complements amplify value and substitutes erode it, forecasting net impact by horizon

We deliver granular, decision-grade intel: market sizing, 5-year forecasts, pricing, adoption, usage, revenue, and operational KPIs—plus competitor tracking, regulation, and value chains—across 60 countries broadly.

Spot the shifts before they hit your P&L. We track inflection points, adoption curves, pricing moves, and ecosystem plays to show where demand is heading, why it is changing, and what to do next across high-growth markets and disruptive tech

Real-time reads of user behavior. We track shifting priorities, perceptions of today’s and next-gen services, and provider experience, then pace how fast tech moves from trial to adoption, blending buyer, consumer, and channel inputs with social signals (#WhySwitch, #UX).

Partner with our analyst team to build a custom report designed around your business priorities. From analysing market trends to assessing competitors or crafting bespoke datasets, we tailor insights to your needs.
Supplier Intelligence
Discovery & Profiling
Capacity & Footprint
Performance & Risk
Compliance & Governance
Commercial Readiness
Who Supplies Whom
Scorecards & Shortlists
Playbooks & Docs
Category Intelligence
Definition & Scope
Demand & Use Cases
Cost Drivers
Market Structure
Supply Chain Map
Trade & Policy
Operating Norms
Deliverables
Buyer Intelligence
Account Basics
Spend & Scope
Procurement Model
Vendor Requirements
Terms & Policies
Entry Strategy
Pain Points & Triggers
Outputs
Pricing Analysis
Benchmarks
Trends
Should-Cost
Indexation
Landed Cost
Commercial Terms
Deliverables
Brand Analysis
Positioning & Value Prop
Share & Presence
Customer Evidence
Go-to-Market
Digital & Reputation
Compliance & Trust
KPIs & Gaps
Outputs
Full Research Suite comprises of:
Market outlook & trends analysis
Interviews & case studies
Strategic recommendations
Vendor profiles & capabilities analysis
5-year forecasts
8 regions and 60+ country-level data splits
Market segment data splits
12 months of continuous data updates
DELIVERED AS:
PDF EXCEL ONLINE
Automatic Glue Machine Market Size and Share Forecast Outlook 2025 to 2035
Automatic Checkweigher Market Growth & Outlook 2025 to 2035
Automatic Coffee Machine Market Analysis – Size, Share & Forecast 2025 to 2035
Automatic Bending Machine Market Size and Share Forecast Outlook 2025 to 2035
Automatic Filling Machine Market Analysis - Size, Growth, and Forecast 2025 to 2035
Automatic Capping Machine Market - Size, Share, and Forecast 2025 to 2035
Automatic Banding Machine Market Insights - Growth & Forecast 2025 to 2035
Automatic Ducting Machine Market Growth - Trends & Forecast 2025 to 2035
Automatic Grilling Machine Market
Slide Labeling Machine Market Size and Share Forecast Outlook 2025 to 2035
Automatic Die Cutting Machines Market Size and Share Forecast Outlook 2025 to 2035
Automatic Case Erecting Machine Market Size, Trend & Forecast 2024-2034
Automatic Powder Forming Machine Market Forecast and Outlook 2025 to 2035
Automatic Impact Testing Machine Market Size and Share Forecast Outlook 2025 to 2035
Automatic Powder Filling Machines Market
Automatic Liquid Filling Machines Market
Automatic Chicken Deboning Machine Market Size and Share Forecast Outlook 2025 to 2035
Automatic Clay Brick Making Machine Market
Automated Labeling Machines Market Size and Share Forecast Outlook 2025 to 2035
Semi Automatic Labelling Machines Market Size and Share Forecast Outlook 2025 to 2035

Thank you!
You will receive an email from our Business Development Manager. Please be sure to check your SPAM/JUNK folder too.
Chat With
MaRIA