Automatic Paper Cutter Market Outlook (2023 to 2033)

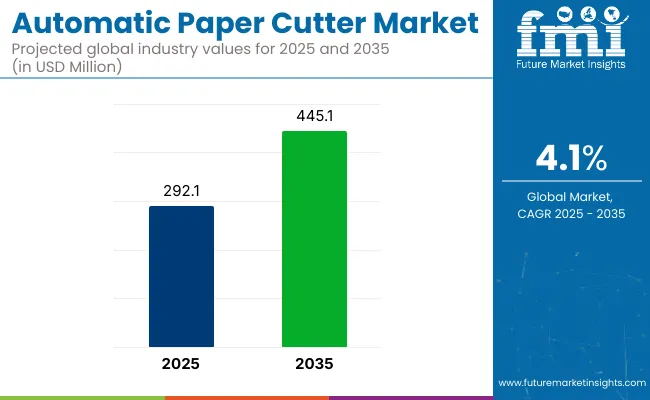
The global automatic paper cutter market size is likely to be evaluated at US$ 268.5 million in 2023. The market is expected to reach US$ 386.1 million in 2033 and exhibit immense growth at a CAGR of 3.7% in the forecast period.

The user-friendliness of automatic paper cutters makes them highly compatible for personal use and in corporate offices, which is likely to significantly increase their demand amongst consumers and increase the automatic paper cutter market growth. However, the easy availability of substitutes for paper cutters is a major restraint that suppresses the market's growth.

Conversely, disposing of confidential information of large-size multinational corporations (MNCs) requires the deployment of automatic paper cutters in this sector and is likely to propel the market share.

Attributes Details
Automatic Paper Cutter Market Size (2023) US$ 268.5 million
Automatic Paper Cutter Market Size (2033) US$ 386.1 million
Automatic Paper Cutter Market CAGR 3.7%

The strip-cut and cross-cut paper cutters are the two most popular types available in the market. Consumers prefer strip-cut commercial paper shredders as they are faster and have more cutting teeth for precision in paper shredding.

Governments are implementing strict regulations on sustaining and protecting the environment. This is likely to surge the demand for automatic paper cutters, as it eliminates the burning of unwanted paper material, which increases pollution.

There has been a rise in specialty stores, convenience stores, supermarkets, etc. Therefore, the delivery processes provided by these stores, as well as the ease of purchasing and quality check of products, are subject to contribute to the offline sales of automatic paper cutters.

Don't pay for what you don't need

Customize your report by selecting specific countries or regions and save 30%!

Scout, The Significant Drivers That Boost The Automatic Paper Cutter Market

There is a strong preference for paper cutters to destroy unwanted paper, financial systems, loyalty cards, confidential prints, credit cards, etc. Moreover, rising environmental concerns around the world, along with an increase in paper production, are expected to increase the adoption of automatic paper cutters.

There has been a rising consumer awareness of shedding paper products, along with stringent regulations that are likely to be pivotal drivers for market share growth. This is attributed to proper trash management and the reduction of waste size for easier disposal.

Reducing labor expenses and maintaining the protection of personal documents are likely to increase the deployment of automatic paper cutter machines. Hence, certain municipal corporations benefit from automatic paper cutters to properly dispose of data trash without relying on third-party services.

The automatic paper cutters are easy to operate owing to their simpler working process. Furthermore, the costs of most paper shredders are inexpensive. These factors are anticipated to significantly push the sales of the product, which in turn supports market growth.

Restraints Likely to Curb the Growth of the Automatic Paper Cutter Market

Advanced automatic paper cutters can be expensive for personal use. Furthermore, there has been a growth in the usage of soft copies for documentation. These factors are expected to hinder the market size.

The rise of digitization and e-commerce may pose severe challenges for the market and its local players. Additionally, the constant fluctuation in the prices of raw materials is another significant barrier to the automatic paper cutters market growth.

Nikhil Kaitwade
Nikhil Kaitwade

Principal Consultant

Talk to Analyst

Find your sweet spots for generating winning opportunities in this market.

Creative Scopes For Manufacturers Of The Automatic Paper Cutter Market

Automatic paper cutters secure confidential documents in large government and commercial spaces, which increases its demand in the market share. Likewise, the deployment of paper cutters in various organizations further supports its demand.

There has been a rising focus on confidentiality and data security, as well as growing compliance with international security standards. These are estimated to boost product demand and provide future revenue opportunities for manufacturers.

How is the Performance of the Europe Automatic Paper Cutter Market?

Europe is expected to hold the largest share of the automatic paper cutter market, with a revenue of 26%. This is owing to the evolution in the paper mills and flourishing print media.

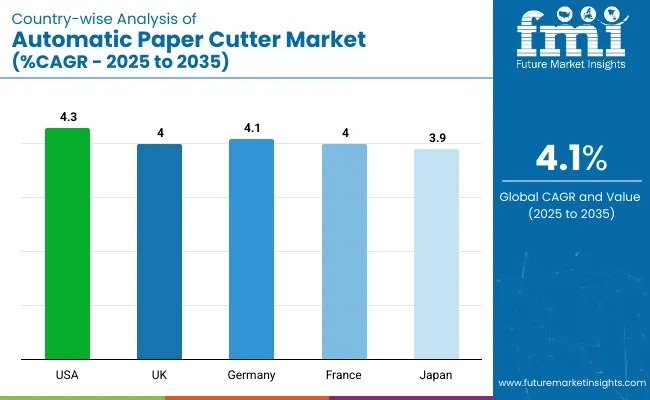
Germany and France are the leading automatic paper cutter markets in this region. Moreover, the packaging industry and the need to discard confidential data in corporate offices are likely to expand the global automatic paper cutter market size.

With a revenue of 21%, North America is the second leading automatic paper cutter market. This is attributed to the use of different technologies and therefore increasing the adoption of laser paper-cutting processes.

Get the data you need at a Fraction of the cost

Personalize your report by choosing insights you need
and save 40%!

How Is The Start-up Ecosystem In The Automatic Paper Cutter Market?

Paper disposal is an overlooked process, which - if not done with care, can contribute to environmental pollution. Furthermore, burning unwanted paper material releases harmful carbon emissions into the atmosphere.

The production of paper cutters has made this process not only easy but environmentally friendly. The paper scraps can also be reused or recycled for other purposes if required.

There are several types of paper cutters that are available in the market, such as strip-cut and cross-cut paper cutter machines. Start-up companies aim to manufacture paper cutters that mostly cater to their customer's requirements, whether for office, small and large industries, business, or commercial use.

Top 5 Key Organizations Revolutionizing The Automatic Paper Cutter Masks Market Space

The market growth of automatic paper cutters has been decent in recent years. This is attributed to the presence of high bombers of participants, which effectively makes the market highly competitive. Therefore, providing revenue options for the key players.

Key Market Players of the Automatic Paper Cutter Market:

  • Faldo Ltd. - Their paper cutters are apt for cutting and molding. The gadget is a requirement for any organization that uses paper as their fundamental yield or item. They offer various cutter choices for diverse plans, guaranteeing that clients can get the best item that fits their needs. From slicing substantial sheets to littler estimated arrangements to modifying the shape for particular purposes, their choices guarantee that the client gets the right results for their business.
  • PaperFolder Co. - They provide expert advice in selecting from a large inventory of quality paper-processing machines suitable for office or print shop use at modest prices. These machines are hard to find outside very large cities, and often the selection and expertise are not great.
  • Spiraltech Ltd. - They deliver simple, safe, and easy to operate machines. They are focused on implementing newly automated processes and set-up procedures. At the same time, these user-friendly controls and HMIs make better use of graphics and include features such as online help and quick user guides.
  • Legacy Feeders & Cutters LLC. - They are manufacturers of material processing equipment, including feeders, cutters, sheeters, slitters, and roll storage equipment.
  • Machine Craft Tools Pvt. Ltd. - They are a 3rd generation family-run plastic processing machinery & tooling manufacturer. They have 30+ years of experience working with Thermoforming technology.

Other Market Participants of the Automatic Paper Cutter Market

  • R.C. Systems Co. Inc.
  • ITOTEC CO. LTD.
  • Vecoplan LLC
  • Zhengzhou Huahong Machinery Equipment Co. Ltd.
  • Widesky Machinery Co. Ltd.
  • Franssons
  • Allegheny Shredders Inc.
  • WEIMA Maschinenbau GmbH
  • Zhangjiagang Sevenstars Machinery Co. Ltd.
  • Fellowes Brands
  • Krug & Priester GmbH & Co. KG.
  • HSM
  • Intimus Shredder
  • Meiko Shokai
  • ACCO Brands
  • Martin Yale Industries
  • ElcomanSrl
  • Kobra Shredder
  • ANDRITZ
  • Insignia Products
  • Resideo Technologies Inc.

Some of the recent developments in the automatic paper cutter market are:

  • Polar-Mohr Introduces High-Speed Automatic Paper Cutter: Polar-Mohr, a renowned manufacturer in the automatic paper cutter industry, recently launched a new model called the Speedmaster XL 106. This cutting-edge machine boasts an impressive cutting speed of 18,000 sheets per hour, setting a new benchmark for efficiency and productivity in the market.
  • Perfecta Unveils Integrated Software Solution for Automatic Paper Cutters: Perfecta, a leading provider of cutting solutions, introduced a cutting-edge software solution called Perfecta Cut Center. This comprehensive software seamlessly integrates with their automatic paper cutter models, offering advanced features such as optimization algorithms, waste reduction tools, and real-time production monitoring.

Scope Of The Report

Report Attributes Details
Growth Rate CAGR of 3.7% from 2023 to 2033
The base year for estimation 2023
Historical data 2018 to 2022
Forecast period 2023 to 2033
Quantitative units Revenue in US$ million, volume in kilotons, and CAGR from 2023 to 2033
Report Coverage Revenue forecast, volume forecast, company ranking, competitive landscape, growth factors and trends, Pricing Analysis
Segments Covered Model, Application, and Region.
Regional scope North America; Western Europe; Eastern Europe; Middle East; Africa; ASEAN; South Asia; Rest of Asia; Australia; and New Zealand
Country scope USA, Canada, Mexico, Germany, United Kingdom, France, Italy, Spain, Russia, Belgium, Poland, Czech Republic, China, India, Japan, Australia, Brazil, Argentina, Colombia, Saudi Arabia, United Arab Emirates, Iran, South Africa
Key companies profiled Faldo Ltd.; PaperFolder Co.; Spiraltech Ltd.; Legacy Feeders & Cutters LLC.; Machine Craft Tools Pvt. Ltd.; R.C. Systems Co. Inc.; ITOTEC CO. LTD.; Vecoplan LLC; Zhengzhou Huahong Machinery Equipment Co. Ltd.; Widesky Machinery Co. Ltd.; Franssons; Allegheny Shredders Inc.; WEIMA Maschinenbau GmbH; Zhangjiagang Sevenstars Machinery Co. Ltd.; Fellowes Brands; Krug & Priester GmbH & Co. KG.; HSM; Intimus Shredder; Meiko Shokai; ACCO Brands; Martin Yale Industries; ElcomanSrl; Kobra Shredder; ANDRITZ; Insignia Products; Resideo Technologies Inc. etc.
Customization scope Free report customization (equivalent to 8 analysts' working days) with purchase. Addition or alteration to country, regional & segment scope.
Pricing and purchase options Avail customized purchase options to meet your exact research needs.

Key Segments Profiled In The Automatic Paper Cutter Market Survey

By Model:

  • Semi-Automatic Paper Cutters
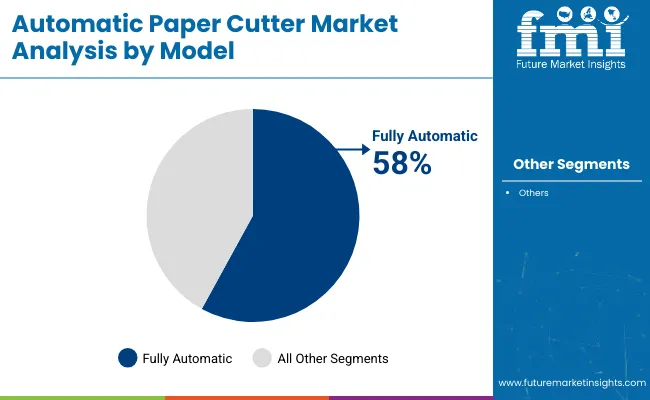
  • Fully Automatic Paper Cutters

By Application:

  • Pre-Press Printing
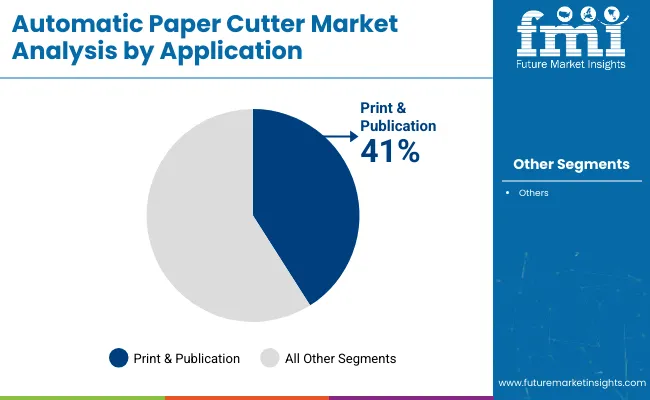
  • Print & Publication
  • Paper Mills Processing
  • Paper Packaging

By Region:

  • North America
  • Latin America
  • Asia Pacific
  • Middle East and Africa
  • Europe

Frequently Asked Questions

How Big is the Automatic Paper Cutter market?

The market is valued at US$ 268.5 million in 2023.

What is Restraining the Market Growth?

Increasing digitization and high device costs hamper the market growth.

Which Model Type is Predicted to Expand?

Fully automatic paper cutters are expected to expand.

What is the value estimated for the Market in 2033?

The market is projected to reach US$ 386.1 million by 2033.

How does Europe fare in terms of Market Share?

Europe is projected to register at a 26% share until 2033.

Table of Content
1. Executive Summary

    1.1. Global Market Outlook

    1.2. Demand-side Trends

    1.3. Supply-side Trends

    1.4. Technology Roadmap Analysis

    1.5. Analysis and Recommendations

2. Market Overview

    2.1. Market Coverage / Taxonomy

    2.2. Market Definition / Scope / Limitations

3. Market Background

    3.1. Market Dynamics

        3.1.1. Drivers

        3.1.2. Restraints

        3.1.3. Opportunity

        3.1.4. Trends

    3.2. Scenario Forecast

        3.2.1. Demand in Optimistic Scenario

        3.2.2. Demand in Likely Scenario

        3.2.3. Demand in Conservative Scenario

    3.3. Opportunity Map Analysis

    3.4. Product Life Cycle Analysis

    3.5. Supply Chain Analysis

        3.5.1. Supply Side Participants and their Roles

            3.5.1.1. Producers

            3.5.1.2. Mid-Level Participants (Traders/ Agents/ Brokers)

            3.5.1.3. Wholesalers and Distributors

        3.5.2. Value Added and Value Created at Node in the Supply Chain

        3.5.3. List of Raw Material Suppliers

        3.5.4. List of Existing and Potential Buyer’s

    3.6. Investment Feasibility Matrix

    3.7. Value Chain Analysis

        3.7.1. Profit Margin Analysis

        3.7.2. Wholesalers and Distributors

        3.7.3. Retailers

    3.8. PESTLE and Porter’s Analysis

    3.9. Regulatory Landscape

        3.9.1. By Key Regions

        3.9.2. By Key Countries

    3.10. Regional Parent Market Outlook

    3.11. Production and Consumption Statistics

    3.12. Import and Export Statistics

4. Global Market Analysis 2018 to 2022 and Forecast, 2023 to 2033

    4.1. Historical Market Size Value (US$ Million) & Volume (Units) Analysis, 2018 to 2022

    4.2. Current and Future Market Size Value (US$ Million) & Volume (Units) Projections, 2023 to 2033

        4.2.1. Y-o-Y Growth Trend Analysis

        4.2.2. Absolute $ Opportunity Analysis

5. Global Market Analysis 2018 to 2022 and Forecast 2023 to 2033, By Model

    5.1. Introduction / Key Findings

    5.2. Historical Market Size Value (US$ Million) & Volume (Units) Analysis By Model, 2018 to 2022

    5.3. Current and Future Market Size Value (US$ Million) & Volume (Units) Analysis and Forecast By Model, 2023 to 2033

        5.3.1. Semi-Automatic Paper Cutters

        5.3.2. Fully Automatic Paper Cutters

    5.4. Y-o-Y Growth Trend Analysis By Model, 2018 to 2022

    5.5. Absolute $ Opportunity Analysis By Model, 2023 to 2033

6. Global Market Analysis 2018 to 2022 and Forecast 2023 to 2033, By Application

    6.1. Introduction / Key Findings

    6.2. Historical Market Size Value (US$ Million) & Volume (Units) Analysis By Application, 2018 to 2022

    6.3. Current and Future Market Size Value (US$ Million) & Volume (Units) Analysis and Forecast By Application, 2023 to 2033

        6.3.1. Pre-Press Printing

        6.3.2. Print & Publication

        6.3.3. Paper Mills Processing

        6.3.4. Paper Packaging

    6.4. Y-o-Y Growth Trend Analysis By Application, 2018 to 2022

    6.5. Absolute $ Opportunity Analysis By Application, 2023 to 2033

7. Global Market Analysis 2018 to 2022 and Forecast 2023 to 2033, By Region

    7.1. Introduction

    7.2. Historical Market Size Value (US$ Million) & Volume (Units) Analysis By Region, 2018 to 2022

    7.3. Current Market Size Value (US$ Million) & Volume (Units) Analysis and Forecast By Region, 2023 to 2033

        7.3.1. North America

        7.3.2. Latin America

        7.3.3. Western Europe

        7.3.4. Eastern Europe

        7.3.5. South Asia and Pacific

        7.3.6. East Asia

        7.3.7. Middle East and Africa

    7.4. Market Attractiveness Analysis By Region

8. North America Market Analysis 2018 to 2022 and Forecast 2023 to 2033, By Country

    8.1. Historical Market Size Value (US$ Million) & Volume (Units) Trend Analysis By Market Taxonomy, 2018 to 2022

    8.2. Market Size Value (US$ Million) & Volume (Units) Forecast By Market Taxonomy, 2023 to 2033

        8.2.1. By Country

            8.2.1.1. USA.

            8.2.1.2. Canada

        8.2.2. By Model

        8.2.3. By Application

    8.3. Market Attractiveness Analysis

        8.3.1. By Country

        8.3.2. By Model

        8.3.3. By Application

    8.4. Key Takeaways

9. Latin America Market Analysis 2018 to 2022 and Forecast 2023 to 2033, By Country

    9.1. Historical Market Size Value (US$ Million) & Volume (Units) Trend Analysis By Market Taxonomy, 2018 to 2022

    9.2. Market Size Value (US$ Million) & Volume (Units) Forecast By Market Taxonomy, 2023 to 2033

        9.2.1. By Country

            9.2.1.1. Brazil

            9.2.1.2. Mexico

            9.2.1.3. Rest of Latin America

        9.2.2. By Model

        9.2.3. By Application

    9.3. Market Attractiveness Analysis

        9.3.1. By Country

        9.3.2. By Model

        9.3.3. By Application

    9.4. Key Takeaways

10. Western Europe Market Analysis 2018 to 2022 and Forecast 2023 to 2033, By Country

    10.1. Historical Market Size Value (US$ Million) & Volume (Units) Trend Analysis By Market Taxonomy, 2018 to 2022

    10.2. Market Size Value (US$ Million) & Volume (Units) Forecast By Market Taxonomy, 2023 to 2033

        10.2.1. By Country

            10.2.1.1. Germany

            10.2.1.2. United Kingdom.

            10.2.1.3. France

            10.2.1.4. Spain

            10.2.1.5. Italy

            10.2.1.6. Rest of Western Europe

        10.2.2. By Model

        10.2.3. By Application

    10.3. Market Attractiveness Analysis

        10.3.1. By Country

        10.3.2. By Model

        10.3.3. By Application

    10.4. Key Takeaways

11. Eastern Europe Market Analysis 2018 to 2022 and Forecast 2023 to 2033, By Country

    11.1. Historical Market Size Value (US$ Million) & Volume (Units) Trend Analysis By Market Taxonomy, 2018 to 2022

    11.2. Market Size Value (US$ Million) & Volume (Units) Forecast By Market Taxonomy, 2023 to 2033

        11.2.1. By Country

            11.2.1.1. Poland

            11.2.1.2. Russia

            11.2.1.3. Czech Republic

            11.2.1.4. Romania

            11.2.1.5. Rest of Eastern Europe

        11.2.2. By Model

        11.2.3. By Application

    11.3. Market Attractiveness Analysis

        11.3.1. By Country

        11.3.2. By Model

        11.3.3. By Application

    11.4. Key Takeaways

12. South Asia and Pacific Market Analysis 2018 to 2022 and Forecast 2023 to 2033, By Country

    12.1. Historical Market Size Value (US$ Million) & Volume (Units) Trend Analysis By Market Taxonomy, 2018 to 2022

    12.2. Market Size Value (US$ Million) & Volume (Units) Forecast By Market Taxonomy, 2023 to 2033

        12.2.1. By Country

            12.2.1.1. India

            12.2.1.2. Bangladesh

            12.2.1.3. Australia

            12.2.1.4. New Zealand

            12.2.1.5. Rest of South Asia and Pacific

        12.2.2. By Model

        12.2.3. By Application

    12.3. Market Attractiveness Analysis

        12.3.1. By Country

        12.3.2. By Model

        12.3.3. By Application

    12.4. Key Takeaways

13. East Asia Market Analysis 2018 to 2022 and Forecast 2023 to 2033, By Country

    13.1. Historical Market Size Value (US$ Million) & Volume (Units) Trend Analysis By Market Taxonomy, 2018 to 2022

    13.2. Market Size Value (US$ Million) & Volume (Units) Forecast By Market Taxonomy, 2023 to 2033

        13.2.1. By Country

            13.2.1.1. China

            13.2.1.2. Japan

            13.2.1.3. South Korea

        13.2.2. By Model

        13.2.3. By Application

    13.3. Market Attractiveness Analysis

        13.3.1. By Country

        13.3.2. By Model

        13.3.3. By Application

    13.4. Key Takeaways

14. Middle East and Africa Market Analysis 2018 to 2022 and Forecast 2023 to 2033, By Country

    14.1. Historical Market Size Value (US$ Million) & Volume (Units) Trend Analysis By Market Taxonomy, 2018 to 2022

    14.2. Market Size Value (US$ Million) & Volume (Units) Forecast By Market Taxonomy, 2023 to 2033

        14.2.1. By Country

            14.2.1.1. GCC Countries

            14.2.1.2. South Africa

            14.2.1.3. Israel

            14.2.1.4. Rest of MEA

        14.2.2. By Model

        14.2.3. By Application

    14.3. Market Attractiveness Analysis

        14.3.1. By Country

        14.3.2. By Model

        14.3.3. By Application

    14.4. Key Takeaways

15. Key Countries Market Analysis

    15.1. USA.

        15.1.1. Pricing Analysis

        15.1.2. Market Share Analysis, 2022

            15.1.2.1. By Model

            15.1.2.2. By Application

    15.2. Canada

        15.2.1. Pricing Analysis

        15.2.2. Market Share Analysis, 2022

            15.2.2.1. By Model

            15.2.2.2. By Application

    15.3. Brazil

        15.3.1. Pricing Analysis

        15.3.2. Market Share Analysis, 2022

            15.3.2.1. By Model

            15.3.2.2. By Application

    15.4. Mexico

        15.4.1. Pricing Analysis

        15.4.2. Market Share Analysis, 2022

            15.4.2.1. By Model

            15.4.2.2. By Application

    15.5. Germany

        15.5.1. Pricing Analysis

        15.5.2. Market Share Analysis, 2022

            15.5.2.1. By Model

            15.5.2.2. By Application

    15.6. United Kingdom.

        15.6.1. Pricing Analysis

        15.6.2. Market Share Analysis, 2022

            15.6.2.1. By Model

            15.6.2.2. By Application

    15.7. France

        15.7.1. Pricing Analysis

        15.7.2. Market Share Analysis, 2022

            15.7.2.1. By Model

            15.7.2.2. By Application

    15.8. Spain

        15.8.1. Pricing Analysis

        15.8.2. Market Share Analysis, 2022

            15.8.2.1. By Model

            15.8.2.2. By Application

    15.9. Italy

        15.9.1. Pricing Analysis

        15.9.2. Market Share Analysis, 2022

            15.9.2.1. By Model

            15.9.2.2. By Application

    15.10. Poland

        15.10.1. Pricing Analysis

        15.10.2. Market Share Analysis, 2022

            15.10.2.1. By Model

            15.10.2.2. By Application

    15.11. Russia

        15.11.1. Pricing Analysis

        15.11.2. Market Share Analysis, 2022

            15.11.2.1. By Model

            15.11.2.2. By Application

    15.12. Czech Republic

        15.12.1. Pricing Analysis

        15.12.2. Market Share Analysis, 2022

            15.12.2.1. By Model

            15.12.2.2. By Application

    15.13. Romania

        15.13.1. Pricing Analysis

        15.13.2. Market Share Analysis, 2022

            15.13.2.1. By Model

            15.13.2.2. By Application

    15.14. India

        15.14.1. Pricing Analysis

        15.14.2. Market Share Analysis, 2022

            15.14.2.1. By Model

            15.14.2.2. By Application

    15.15. Bangladesh

        15.15.1. Pricing Analysis

        15.15.2. Market Share Analysis, 2022

            15.15.2.1. By Model

            15.15.2.2. By Application

    15.16. Australia

        15.16.1. Pricing Analysis

        15.16.2. Market Share Analysis, 2022

            15.16.2.1. By Model

            15.16.2.2. By Application

    15.17. New Zealand

        15.17.1. Pricing Analysis

        15.17.2. Market Share Analysis, 2022

            15.17.2.1. By Model

            15.17.2.2. By Application

    15.18. China

        15.18.1. Pricing Analysis

        15.18.2. Market Share Analysis, 2022

            15.18.2.1. By Model

            15.18.2.2. By Application

    15.19. Japan

        15.19.1. Pricing Analysis

        15.19.2. Market Share Analysis, 2022

            15.19.2.1. By Model

            15.19.2.2. By Application

    15.20. South Korea

        15.20.1. Pricing Analysis

        15.20.2. Market Share Analysis, 2022

            15.20.2.1. By Model

            15.20.2.2. By Application

    15.21. GCC Countries

        15.21.1. Pricing Analysis

        15.21.2. Market Share Analysis, 2022

            15.21.2.1. By Model

            15.21.2.2. By Application

    15.22. South Africa

        15.22.1. Pricing Analysis

        15.22.2. Market Share Analysis, 2022

            15.22.2.1. By Model

            15.22.2.2. By Application

    15.23. Israel

        15.23.1. Pricing Analysis

        15.23.2. Market Share Analysis, 2022

            15.23.2.1. By Model

            15.23.2.2. By Application

16. Market Structure Analysis

    16.1. Competition Dashboard

    16.2. Competition Benchmarking

    16.3. Market Share Analysis of Top Players

        16.3.1. By Regional

        16.3.2. By Model

        16.3.3. By Application

17. Competition Analysis

    17.1. Competition Deep Dive

        17.1.1. R.C. Systems Co. Inc.

            17.1.1.1. Overview

            17.1.1.2. Product Portfolio

            17.1.1.3. Profitability by Market Segments

            17.1.1.4. Sales Footprint

            17.1.1.5. Strategy Overview

                17.1.1.5.1. Marketing Strategy

                17.1.1.5.2. Product Strategy

                17.1.1.5.3. Channel Strategy

        17.1.2. ITOTEC CO. LTD.

            17.1.2.1. Overview

            17.1.2.2. Product Portfolio

            17.1.2.3. Profitability by Market Segments

            17.1.2.4. Sales Footprint

            17.1.2.5. Strategy Overview

                17.1.2.5.1. Marketing Strategy

                17.1.2.5.2. Product Strategy

                17.1.2.5.3. Channel Strategy

        17.1.3. Vecoplan LLC

            17.1.3.1. Overview

            17.1.3.2. Product Portfolio

            17.1.3.3. Profitability by Market Segments

            17.1.3.4. Sales Footprint

            17.1.3.5. Strategy Overview

                17.1.3.5.1. Marketing Strategy

                17.1.3.5.2. Product Strategy

                17.1.3.5.3. Channel Strategy

        17.1.4. Zhengzhou Huahong Machinery Equipment Co. Ltd.

            17.1.4.1. Overview

            17.1.4.2. Product Portfolio

            17.1.4.3. Profitability by Market Segments

            17.1.4.4. Sales Footprint

            17.1.4.5. Strategy Overview

                17.1.4.5.1. Marketing Strategy

                17.1.4.5.2. Product Strategy

                17.1.4.5.3. Channel Strategy

        17.1.5. Widesky Machinery Co. Ltd.

            17.1.5.1. Overview

            17.1.5.2. Product Portfolio

            17.1.5.3. Profitability by Market Segments

            17.1.5.4. Sales Footprint

            17.1.5.5. Strategy Overview

                17.1.5.5.1. Marketing Strategy

                17.1.5.5.2. Product Strategy

                17.1.5.5.3. Channel Strategy

        17.1.6. Franssons

            17.1.6.1. Overview

            17.1.6.2. Product Portfolio

            17.1.6.3. Profitability by Market Segments

            17.1.6.4. Sales Footprint

            17.1.6.5. Strategy Overview

                17.1.6.5.1. Marketing Strategy

                17.1.6.5.2. Product Strategy

                17.1.6.5.3. Channel Strategy

        17.1.7. Allegheny Shredders Inc.

            17.1.7.1. Overview

            17.1.7.2. Product Portfolio

            17.1.7.3. Profitability by Market Segments

            17.1.7.4. Sales Footprint

            17.1.7.5. Strategy Overview

                17.1.7.5.1. Marketing Strategy

                17.1.7.5.2. Product Strategy

                17.1.7.5.3. Channel Strategy

        17.1.8. WEIMA Maschinenbau GmbH

            17.1.8.1. Overview

            17.1.8.2. Product Portfolio

            17.1.8.3. Profitability by Market Segments

            17.1.8.4. Sales Footprint

            17.1.8.5. Strategy Overview

                17.1.8.5.1. Marketing Strategy

                17.1.8.5.2. Product Strategy

                17.1.8.5.3. Channel Strategy

        17.1.9. Zhangjiagang Sevenstars Machinery Co. Ltd.

            17.1.9.1. Overview

            17.1.9.2. Product Portfolio

            17.1.9.3. Profitability by Market Segments

            17.1.9.4. Sales Footprint

            17.1.9.5. Strategy Overview

                17.1.9.5.1. Marketing Strategy

                17.1.9.5.2. Product Strategy

                17.1.9.5.3. Channel Strategy

        17.1.10. Fellowes Brands

            17.1.10.1. Overview

            17.1.10.2. Product Portfolio

            17.1.10.3. Profitability by Market Segments

            17.1.10.4. Sales Footprint

            17.1.10.5. Strategy Overview

                17.1.10.5.1. Marketing Strategy

                17.1.10.5.2. Product Strategy

                17.1.10.5.3. Channel Strategy

        17.1.11. Krug & Priester GmbH & Co. KG.

            17.1.11.1. Overview

            17.1.11.2. Product Portfolio

            17.1.11.3. Profitability by Market Segments

            17.1.11.4. Sales Footprint

            17.1.11.5. Strategy Overview

                17.1.11.5.1. Marketing Strategy

                17.1.11.5.2. Product Strategy

                17.1.11.5.3. Channel Strategy

        17.1.12. HSM

            17.1.12.1. Overview

            17.1.12.2. Product Portfolio

            17.1.12.3. Profitability by Market Segments

            17.1.12.4. Sales Footprint

            17.1.12.5. Strategy Overview

                17.1.12.5.1. Marketing Strategy

                17.1.12.5.2. Product Strategy

                17.1.12.5.3. Channel Strategy

        17.1.13. Intimus Shredder

            17.1.13.1. Overview

            17.1.13.2. Product Portfolio

            17.1.13.3. Profitability by Market Segments

            17.1.13.4. Sales Footprint

            17.1.13.5. Strategy Overview

                17.1.13.5.1. Marketing Strategy

                17.1.13.5.2. Product Strategy

                17.1.13.5.3. Channel Strategy

        17.1.14. Meiko Shokai

            17.1.14.1. Overview

            17.1.14.2. Product Portfolio

            17.1.14.3. Profitability by Market Segments

            17.1.14.4. Sales Footprint

            17.1.14.5. Strategy Overview

                17.1.14.5.1. Marketing Strategy

                17.1.14.5.2. Product Strategy

                17.1.14.5.3. Channel Strategy

        17.1.15. ACCO Brands

            17.1.15.1. Overview

            17.1.15.2. Product Portfolio

            17.1.15.3. Profitability by Market Segments

            17.1.15.4. Sales Footprint

            17.1.15.5. Strategy Overview

                17.1.15.5.1. Marketing Strategy

                17.1.15.5.2. Product Strategy

                17.1.15.5.3. Channel Strategy

        17.1.16. Martin Yale Industries

            17.1.16.1. Overview

            17.1.16.2. Product Portfolio

            17.1.16.3. Profitability by Market Segments

            17.1.16.4. Sales Footprint

            17.1.16.5. Strategy Overview

                17.1.16.5.1. Marketing Strategy

                17.1.16.5.2. Product Strategy

                17.1.16.5.3. Channel Strategy

        17.1.17. ElcomanSrl

            17.1.17.1. Overview

            17.1.17.2. Product Portfolio

            17.1.17.3. Profitability by Market Segments

            17.1.17.4. Sales Footprint

            17.1.17.5. Strategy Overview

                17.1.17.5.1. Marketing Strategy

                17.1.17.5.2. Product Strategy

                17.1.17.5.3. Channel Strategy

        17.1.18. Kobra Shredder

            17.1.18.1. Overview

            17.1.18.2. Product Portfolio

            17.1.18.3. Profitability by Market Segments

            17.1.18.4. Sales Footprint

            17.1.18.5. Strategy Overview

                17.1.18.5.1. Marketing Strategy

                17.1.18.5.2. Product Strategy

                17.1.18.5.3. Channel Strategy

        17.1.19. ANDRITZ

            17.1.19.1. Overview

            17.1.19.2. Product Portfolio

            17.1.19.3. Profitability by Market Segments

            17.1.19.4. Sales Footprint

            17.1.19.5. Strategy Overview

                17.1.19.5.1. Marketing Strategy

                17.1.19.5.2. Product Strategy

                17.1.19.5.3. Channel Strategy

        17.1.20. Insignia Products

            17.1.20.1. Overview

            17.1.20.2. Product Portfolio

            17.1.20.3. Profitability by Market Segments

            17.1.20.4. Sales Footprint

            17.1.20.5. Strategy Overview

                17.1.20.5.1. Marketing Strategy

                17.1.20.5.2. Product Strategy

                17.1.20.5.3. Channel Strategy

18. Assumptions & Acronyms Used

19. Research Methodology
Recommendations

Industrial Automation

Paper Moisture Meter Market

March 2022

REP-GB-884

June 2022

250 pages

Explore Industrial Automation Insights

View Reports
Future Market Insights

Automatic Paper Cutter Market