Automatic Banding Machine Market Size and Share Forecast Outlook 2025 to 2035

The global automatic banding machine market is poised for steady expansion, projected to grow from USD 3.8 billion in 2025 to approximately USD 5.6 billion by 2035, reflecting a CAGR of around 4.0% during this period. In 2024, sales reached USD 3.6 billion, underpinned by rising adoption of automation, sustainability, and smart packaging solutions across logistics, food & beverage, pharmaceuticals, and printing sectors. Automated banding systems are being incorporated to reduce material use, ensure secure bundling, and align with eco-friendly packaging strategies.
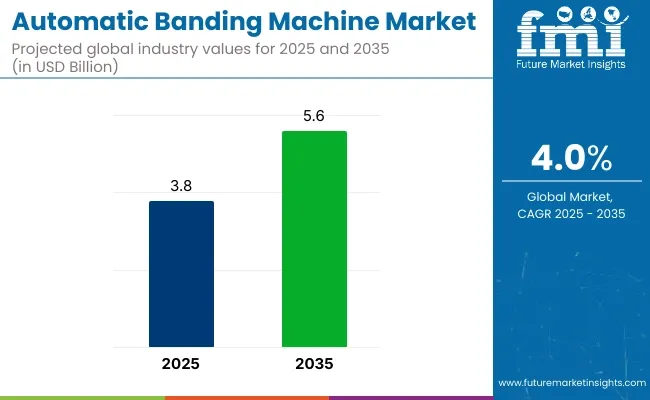
Automatic Banding Machine Market

Metric Value
Market Size (2025E) USD 3.8 Billion
Market Value (2035F) USD 5.6 Billion
CAGR (2025 to 2035) 4.0%

Key innovations are steering market direction. Programmable logic controllers (PLCs) and touchscreen interfaces are being integrated to enhance line efficiency and minimize changeover times. Furthermore, energy-efficient motors, low-noise operation, and heat-free sealing technologies have started to gain traction in 2025, highlighting a commitment to operational excellence and worker safety.

A notable shift has been seen toward paper banding systems. These compostable solutions are being implemented to eliminate adhesives and shrink films. Manufacturers are adopting them in response to tightening regulations and growing corporate sustainability commitments. In Europe, several major producers have begun pilot programs using paper bands for shipment bundles and pallet stabilization.

The trend towards digital integration is also evident. Smart controls and IoT-enabled monitoring are being used to enable predictive maintenance and real-time diagnostics. These features are reducing downtime and extending machine lifespan. As packaging lines become increasingly digitized, banding machines are now being designed to integrate seamlessly with MES (Manufacturing Execution Systems) and WMS (Warehouse Management Systems).

The market is expected to generate an incremental opportunity of USD 1.8 billion by 2035. Companies that invest in customization, sustainability, and digital integration are expected to benefit most. Regulatory pressure to reduce plastic use and enhance automation in logistics are reinforcing the long-term outlook for automatic banding systems. Capital intensity remains a challenge for small to mid-size enterprises. Additionally, tech integration complexity and regional regulatory fragmentation persist.

However, manufacturers such as PackTech, Apex Packaging, and Fachin are strategically focusing on eco-friendly materials, modular designs, and smart features to drive next-gen automation. The automatic banding machine market is being reshaped by sustainability mandates, digital transformation, and demand for operational efficiency. Through 2035, companies that balance eco-friendly materials with automation and intelligent controls are expected to lead this evolving sector.

Analyzing Automatic Banding Machine Market by Top Investment Segments

Fully Automatic Banding Machines to Lead the Market in 2025 Driven by Operational Efficiency and Labor Savings

Fully automatic banding machines are expected to dominate the machine type segment with an estimated 64.5% market share by 2025, fueled by increasing demand for automation, speed, and minimal human intervention across manufacturing and packaging industries.

These machines integrate seamlessly into high-throughput production lines, automatically detecting, aligning, and banding items without operator assistance, significantly reducing labor costs and errors. Fully automatic machines are widely used in sectors such as food and beverage, pharmaceuticals, printing, logistics, and consumer electronics, where precise bundling, labeling, and tamper-evidence are critical. Equipped with programmable logic controllers (PLCs), user-friendly HMIs, and integration capabilities with smart factory systems, these machines support Industry 4.0 initiatives and real-time data monitoring.
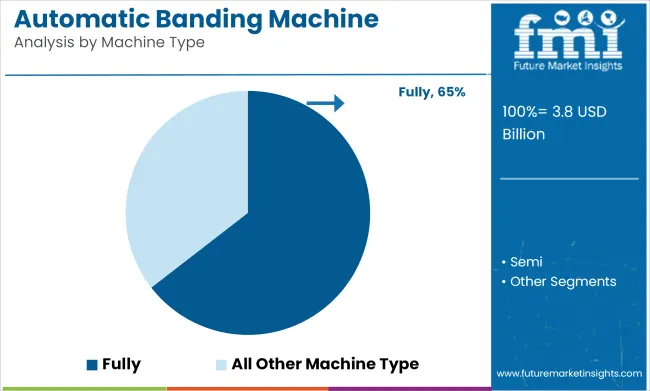
Automatic Banding Machine Market Analysis By Machine Type

Additionally, they offer flexibility in banding materials ranging from paper to poly film making them suitable for both branding and protective purposes. As labor shortages and cost pressures persist globally, businesses are increasingly adopting fully automatic banding machines to boost throughput, ensure product consistency, and enhance packaging aesthetics. Their ability to reduce downtime, improve precision, and streamline logistics ensures their leadership in the banding equipment market well into 2025 and beyond.

Food & Beverages Industry Expected to Dominate due to Hygiene Standards and High Volume Output

The food and beverages industry is projected to hold the largest share of the automatic banding machine market by 2025, with an estimated 24.8% share, owing to its high-volume packaging requirements, stringent hygiene protocols, and increasing focus on sustainable bundling methods.

Automatic Banding Machine Market Analysis By  end Use

Banding machines have been utilized for unitizing multipacks, closing trays, and bundling primary packages for secondary logistics while minimizing the use of shrink wrap and excess packaging. Automatic banding equipment has enabled brands to meet food-grade compliance through the use of heat-free, adhesive-free paper or film bands that provide secure sealing without damaging sensitive surfaces or labeling. Banding has also been used for tamper-evidence, allergen labeling, and traceability marking, which are increasingly regulated in global food distribution channels.

Ready-to-eat meals, bottled drinks, meat trays, and produce packaging have benefited from machine-based banding, which provides not only product integrity but also shelf-ready appearance. Integration into high-speed food lines has further enhanced operational efficiency and throughput in packaging facilities.

As food manufacturers invest in automation to meet growing demand while cutting down on packaging waste, the adoption of automatic banding machines is expected to accelerate, keeping this sector at the forefront of end-use applications in the market.

Challenges and Opportunities

Challenges

High Initial Costs and Maintenance Requirements

Automatic banding machines necessitate significant capital investment, which can be a barrier for small and mid-sized firms. When it comes to such advanced machines with high-speed capabilities, in addition to IoT-enabled features, high upfront costs can make it difficult for businesses on a budget to make the investment. The total cost of ownership is also higher due to the need for ongoing maintenance and technical expertise to operate automated systems. In response to these challenges, producers are concentrating on producing affordable, modular banding solutions with decreased operational costs easily integrated into existing production lines.

Opportunities

Integration of Smart Automation and Sustainable Banding Solutions

Market growth opportunities are present due to the growing demand for smart packaging automation in addition to increasing need sustainable banding materials. Furthermore, the incorporation of AI-driven tracking, near real-time data analysis, and predictive maintenance within banding machines is enhancing productivity while minimizing downtime.

Moreover, the move towards biodegradable banding materials like paper bands and biodegradable adhesives is in line with global sustainability objectives. Manufacturers that adopt intelligent, energy-efficient banding technologies with integrated smart automation are likely to find themselves at a competitive advantage in this changing landscape.

Country wise analysis

Country Wise Analysis Of Automatic Banding Machine Market

United States

Automatic banding machines and the United States is the primary market, growing with the level of automation in the packaging and logistics industry. Increasing demand for efficient, secure, and sustainable bundling solutions in various industries including food & beverage, pharmaceuticals, and e-commerce is driving the growth of bundling materials market.

The requirement for precise banding with little waste also appeals with the country’s sustainability programs, and boosting adoption. To improve operational efficiency for meeting stringent packaging regulations, manufacturers are emphasizing smart sensors, IoT and AI embedded advanced banding machine in their production processes.

Country CAGR (2025 to 2035)
United States 3.8%

United Kingdom

The market in the United Kingdom is expected to grow at a significant rate owing to the growth of retail, logistics and pharmaceuticals. As the pressure increases to address plastic packaging waste, companies are seeking paper-based and biodegradable banding solutions. Technological advancements such as the growth in e-commerce as well as the increasing inclination of end users towards automated warehouse operations are also expected to boost the demand for high-speed banding machines. In addition, the increasing implementation of Industry 4.0 technologies such as smart automation and remote supervision is also hastening the growth of the market.

Country CAGR (2025 to 2035)
United Kingdom 3.7%

European Union

Increased demand is aiding the expansion of the automatic banding machines market in Europe, as well, with Germany, France, and Italy being the top three countries that are adopting automatic banding machines. Robust regulatory framework in the region that promotes sustainable packaging practices is fuelling investments by the industries for eco-friendly banding solutions. Growing pharmaceutical and food processing industries and continuous automation in manufacturing are fuelling the demand for high precision banding systems. Moreover, increasing usage of automated banding solutions for enhanced product safety and optimized supply chain processes by logistics and warehousing facilities is expected to drive the demand for the market.

Region CAGR (2025 to 2035)
European Union (EU) 3.9%

Japan

Japan is the fastest-growing banding machine market in Asia because of the country’s high standards of packaging quality and attention to industrial automation. Trends Observed in the Industry Robotics, AI-driven quality control, smart packaging solutions are among the major trends shaping the industry. The food packaging industry, specifically, is leveraging sophisticated banding machines that adhere to regulations and meet market demands for less and eco-friendly packaging. Also, Japan has an extremely sophisticated logistics industry that uses automatic banding machines to improve efficiency of supply chain management.

Country CAGR (2025 to 2035)
Japan 4.1%

South Korea

Increase in demand for packaging services in sectors like electronics, cosmetics, and food, among others, has theorem to the increasing use of machinery automatic banding machine in South Korea. There are some strong advanced technologies by the country in category of smart packaging systems and automated production lines fuelling the growth of the market. Moreover, the growing requirement for secure bundling solutions across export-oriented sectors is propelling the investments in high-efficiency banding machines. Additionally, the rapid development of e-commerce and last-mile logistics services is driving the proliferation of automated banding systems in packaging and distribution centres.

Country CAGR (2025 to 2035)
South Korea 3.9%

Competitive Outlook: Automatic Banding Machine Market

As industries look for sustainable, economical, and high-speed packaging solutions, the automatic banding machine market flourishes. Tension control integrated with AI, smart automation, energy-efficient banding technologies are innovative solutions introduced by companies to improve accuracy and operational efficiency. Banding solutions: Paper, plastic and biodegradable banding solutions that optimize logistics, retail, food packaging, and pharmaceutical applications.
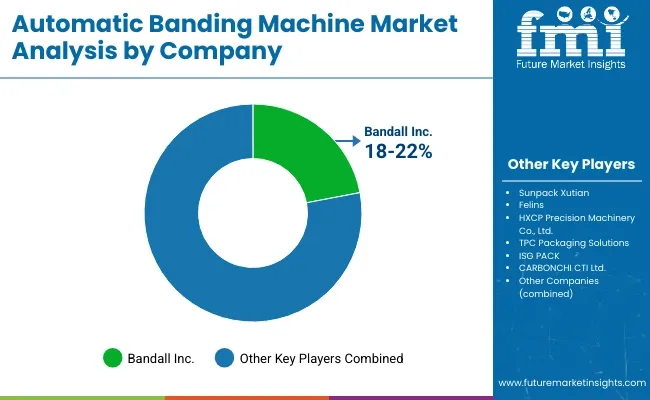
Key Company Insights

Automatic Banding Machine Market Analysis By Company

Bandall Inc. (18-22%)

Bandall Inc. leads the market with eco-friendly, precision banding solutions, integrating biodegradable banding materials and smart automation.

Sunpack Xutian (12-16%)

Sunpack Xutian develops customizable high-speed banding systems, optimizing banding efficiency for industrial packaging.

Felins (10-14%)

Felins specializes in sustainable, heat-sealed banding machines, offering smart automation for retail and food packaging.

HXCP Precision Machinery Co., Ltd. (8-12%)

HXCP enhances sensor-based banding technology, ensuring secure tension control and automated band feed.

TPC Packaging Solutions (7-11%)

TPC integrates AI-driven banding automation, improving packaging efficiency for large-scale industries.

ISG PACK (6-10%)

ISG PACK produces compact banding machines, ideal for pharmaceutical and food processing applications.

CARBONCHI CTI Ltd. (5-9%)

CARBONCHI innovates IoT-powered banding machines, enhancing automated tension monitoring and precision control.

Bandpak (4-8%)

Bandpak provides portable and modular banding solutions, catering to e-commerce, logistics, and bulk packaging sectors.

EAM-MOSCA CORPORATION (3-7%)

EAM-MOSCA delivers automated plastic and paper banding systems, integrating smart material tracking.

StraPack, Corp. (3-6%)

StraPack enhances heavy-duty automatic banding machines, optimizing high-speed industrial packaging.

Other Key Players (30-40% Combined)

Emerging companies introduce AI-integrated banding, biodegradable material innovations, and energy-efficient automation. Notable players include:

  • Cyklop (Advanced paper and plastic banding machines for logistics and food industries)
  • ATS-Tanner (High-speed banding solutions with fully automated material adjustment)
  • Mosca (Smart strapping and banding technologies integrating predictive maintenance)
  • Cousins Packaging (Customizable banding and bundling solutions for automated production lines)
  • Plexpack (High-speed semi-automated banding solutions with energy-efficient designs)

Top Segments Profiled in the Global Automatic Banding Machine Market Research Report

By Machine Type:

  • Semi
  • Fully

By Capacity:

  • Less than 20 bundles/min
  • 20-30 bundles/min
  • More than 30 bundles/min

By End Use:

  • E-commerce
  • Banking
  • Pharmaceuticals
  • Printing
  • Food & Beverages
  • Consumer Goods
  • Electrical & Electronics
  • Automotive
  • Chemicals
  • Others (Toys, Textiles, etc.)

Region:

  • North America
  • Latin America
  • Western Europe
  • Eastern Europe
  • South Asia and Pacific
  • East Asia
  • Middle East and Africa (MEA)

Table of Content

  1. Executive Summary
  2. Industry Introduction, including Taxonomy and Market Definition
  3. Market Trends and Success Factors, including Macro-economic Factors, Market Dynamics, Recent Industry Developments
  4. Market Demand Analysis 2020 to 2024 and Forecast 2025 to 2035, including Historical Analysis, Future Projections
  5. Pricing Analysis
  6. Market Analysis 2020 to 2024 and Forecast 2025 to 2035
    • Machine Type
    • Capacity
    • End Use
  7. Market Analysis 2020 to 2024 and Forecast 2025 to 2035, By Machine Type
    • Semi
    • Fully
  8. Market Analysis 2020 to 2024 and Forecast 2025 to 2035, By Capacity
    • Less than 20 bundles/min
    • 20-30 bundles/min
    • More than 30 bundles/min
    • Cryopreservation
    • Others
  9. Market Analysis 2020 to 2024 and Forecast 2025 to 2035, By End Use
    • E-commerce
    • Banking
    • Pharmaceuticals
    • Printing
    • Food & Beverages
    • Consumer Goods
    • Electrical & Electronics
    • Automotive
    • Chemicals
    • Others (Toys, Textiles, etc.)
  10. Market Analysis 2020 to 2024 and Forecast 2025 to 2035, By Region
    • North America
    • Latin America
    • Western Europe
    • Eastern Europe
    • East Asia
    • South Asia Pacific
    • Middle East and Africa
  11. North America Sales Analysis 2020 to 2024 and Forecast 2025 to 2035, by Key Segments and Countries
  12. Latin America Sales Analysis 2020 to 2024 and Forecast 2025 to 2035, by Key Segments and Countries
  13. Western Europe Sales Analysis 2020 to 2024 and Forecast 2025 to 2035, by Key Segments and Countries
  14. Eastern Europe Sales Analysis 2020 to 2024 and Forecast 2025 to 2035, by Key Segments and Countries
  15. East Asia Sales Analysis 2020 to 2024 and Forecast 2025 to 2035, by Key Segments and Countries
  16. South Asia Pacific Sales Analysis 2020 to 2024 and Forecast 2025 to 2035, by Key Segments and Countries
  17. Middle East and Africa Sales Analysis 2020 to 2024 and Forecast 2025 to 2035, by Key Segments and Countries
  18. Sales Forecast 2025 to 2035 by Machine Type, Capacity, and End Use for 30 Countries
  19. Competition Outlook, including Market Structure Analysis, Company Share Analysis by Key Players, Competition Dashboard
  20. Company Profile
    • Bandall Inc.
    • Sunpack Xutian
    • Felins
    • HXCP Precision Machinery Co., Ltd.
    • TPC Packaging Solutions
    • ISG PACK
    • CARBONCHI CTI Ltd
    • Bandpak
    • EAM-MOSCA CORPORATION
    • StraPack, Corp.

List of Tables

  • Table 1: Global Market Value (US$ Million) Forecast by Region, 2020 to 2035
  • Table 2: Global Market Volume (Units) Forecast by Region, 2020 to 2035
  • Table 3: Global Market Value (US$ Million) Forecast by Machine Type, 2020 to 2035
  • Table 4: Global Market Volume (Units) Forecast by Machine Type, 2020 to 2035
  • Table 5: Global Market Value (US$ Million) Forecast by Capacity, 2020 to 2035
  • Table 6: Global Market Volume (Units) Forecast by Capacity, 2020 to 2035
  • Table 7: Global Market Value (US$ Million) Forecast by End Use, 2020 to 2035
  • Table 8: Global Market Volume (Units) Forecast by End Use, 2020 to 2035
  • Table 9: North America Market Value (US$ Million) Forecast by Country, 2020 to 2035
  • Table 10: North America Market Volume (Units) Forecast by Country, 2020 to 2035
  • Table 11: North America Market Value (US$ Million) Forecast by Machine Type, 2020 to 2035
  • Table 12: North America Market Volume (Units) Forecast by Machine Type, 2020 to 2035
  • Table 13: North America Market Value (US$ Million) Forecast by Capacity, 2020 to 2035
  • Table 14: North America Market Volume (Units) Forecast by Capacity, 2020 to 2035
  • Table 15: North America Market Value (US$ Million) Forecast by End Use, 2020 to 2035
  • Table 16: North America Market Volume (Units) Forecast by End Use, 2020 to 2035
  • Table 17: Latin America Market Value (US$ Million) Forecast by Country, 2020 to 2035
  • Table 18: Latin America Market Volume (Units) Forecast by Country, 2020 to 2035
  • Table 19: Latin America Market Value (US$ Million) Forecast by Machine Type, 2020 to 2035
  • Table 20: Latin America Market Volume (Units) Forecast by Machine Type, 2020 to 2035
  • Table 21: Latin America Market Value (US$ Million) Forecast by Capacity, 2020 to 2035
  • Table 22: Latin America Market Volume (Units) Forecast by Capacity, 2020 to 2035
  • Table 23: Latin America Market Value (US$ Million) Forecast by End Use, 2020 to 2035
  • Table 24: Latin America Market Volume (Units) Forecast by End Use, 2020 to 2035
  • Table 25: Western Europe Market Value (US$ Million) Forecast by Country, 2020 to 2035
  • Table 26: Western Europe Market Volume (Units) Forecast by Country, 2020 to 2035
  • Table 27: Western Europe Market Value (US$ Million) Forecast by Machine Type, 2020 to 2035
  • Table 28: Western Europe Market Volume (Units) Forecast by Machine Type, 2020 to 2035
  • Table 29: Western Europe Market Value (US$ Million) Forecast by Capacity, 2020 to 2035
  • Table 30: Western Europe Market Volume (Units) Forecast by Capacity, 2020 to 2035
  • Table 31: Western Europe Market Value (US$ Million) Forecast by End Use, 2020 to 2035
  • Table 32: Western Europe Market Volume (Units) Forecast by End Use, 2020 to 2035
  • Table 33: Eastern Europe Market Value (US$ Million) Forecast by Country, 2020 to 2035
  • Table 34: Eastern Europe Market Volume (Units) Forecast by Country, 2020 to 2035
  • Table 35: Eastern Europe Market Value (US$ Million) Forecast by Machine Type, 2020 to 2035
  • Table 36: Eastern Europe Market Volume (Units) Forecast by Machine Type, 2020 to 2035
  • Table 37: Eastern Europe Market Value (US$ Million) Forecast by Capacity, 2020 to 2035
  • Table 38: Eastern Europe Market Volume (Units) Forecast by Capacity, 2020 to 2035
  • Table 39: Eastern Europe Market Value (US$ Million) Forecast by End Use, 2020 to 2035
  • Table 40: Eastern Europe Market Volume (Units) Forecast by End Use, 2020 to 2035
  • Table 41: South Asia and Pacific Market Value (US$ Million) Forecast by Country, 2020 to 2035
  • Table 42: South Asia and Pacific Market Volume (Units) Forecast by Country, 2020 to 2035
  • Table 43: South Asia and Pacific Market Value (US$ Million) Forecast by Machine Type, 2020 to 2035
  • Table 44: South Asia and Pacific Market Volume (Units) Forecast by Machine Type, 2020 to 2035
  • Table 45: South Asia and Pacific Market Value (US$ Million) Forecast by Capacity, 2020 to 2035
  • Table 46: South Asia and Pacific Market Volume (Units) Forecast by Capacity, 2020 to 2035
  • Table 47: South Asia and Pacific Market Value (US$ Million) Forecast by End Use, 2020 to 2035
  • Table 48: South Asia and Pacific Market Volume (Units) Forecast by End Use, 2020 to 2035
  • Table 49: East Asia Market Value (US$ Million) Forecast by Country, 2020 to 2035
  • Table 50: East Asia Market Volume (Units) Forecast by Country, 2020 to 2035
  • Table 51: East Asia Market Value (US$ Million) Forecast by Machine Type, 2020 to 2035
  • Table 52: East Asia Market Volume (Units) Forecast by Machine Type, 2020 to 2035
  • Table 53: East Asia Market Value (US$ Million) Forecast by Capacity, 2020 to 2035
  • Table 54: East Asia Market Volume (Units) Forecast by Capacity, 2020 to 2035
  • Table 55: East Asia Market Value (US$ Million) Forecast by End Use, 2020 to 2035
  • Table 56: East Asia Market Volume (Units) Forecast by End Use, 2020 to 2035
  • Table 57: Middle East and Africa Market Value (US$ Million) Forecast by Country, 2020 to 2035
  • Table 58: Middle East and Africa Market Volume (Units) Forecast by Country, 2020 to 2035
  • Table 59: Middle East and Africa Market Value (US$ Million) Forecast by Machine Type, 2020 to 2035
  • Table 60: Middle East and Africa Market Volume (Units) Forecast by Machine Type, 2020 to 2035
  • Table 61: Middle East and Africa Market Value (US$ Million) Forecast by Capacity, 2020 to 2035
  • Table 62: Middle East and Africa Market Volume (Units) Forecast by Capacity, 2020 to 2035
  • Table 63: Middle East and Africa Market Value (US$ Million) Forecast by End Use, 2020 to 2035
  • Table 64: Middle East and Africa Market Volume (Units) Forecast by End Use, 2020 to 2035

List of Figures

  • Figure 1: Global Market Value (US$ Million) by Machine Type, 2025 to 2035
  • Figure 2: Global Market Value (US$ Million) by Capacity, 2025 to 2035
  • Figure 3: Global Market Value (US$ Million) by End Use, 2025 to 2035
  • Figure 4: Global Market Value (US$ Million) by Region, 2025 to 2035
  • Figure 5: Global Market Value (US$ Million) Analysis by Region, 2020 to 2035
  • Figure 6: Global Market Volume (Units) Analysis by Region, 2020 to 2035
  • Figure 7: Global Market Value Share (%) and BPS Analysis by Region, 2025 to 2035
  • Figure 8: Global Market Y-o-Y Growth (%) Projections by Region, 2025 to 2035
  • Figure 9: Global Market Value (US$ Million) Analysis by Machine Type, 2020 to 2035
  • Figure 10: Global Market Volume (Units) Analysis by Machine Type, 2020 to 2035
  • Figure 11: Global Market Value Share (%) and BPS Analysis by Machine Type, 2025 to 2035
  • Figure 12: Global Market Y-o-Y Growth (%) Projections by Machine Type, 2025 to 2035
  • Figure 13: Global Market Value (US$ Million) Analysis by Capacity, 2020 to 2035
  • Figure 14: Global Market Volume (Units) Analysis by Capacity, 2020 to 2035
  • Figure 15: Global Market Value Share (%) and BPS Analysis by Capacity, 2025 to 2035
  • Figure 16: Global Market Y-o-Y Growth (%) Projections by Capacity, 2025 to 2035
  • Figure 17: Global Market Value (US$ Million) Analysis by End Use, 2020 to 2035
  • Figure 18: Global Market Volume (Units) Analysis by End Use, 2020 to 2035
  • Figure 19: Global Market Value Share (%) and BPS Analysis by End Use, 2025 to 2035
  • Figure 20: Global Market Y-o-Y Growth (%) Projections by End Use, 2025 to 2035
  • Figure 21: Global Market Attractiveness by Machine Type, 2025 to 2035
  • Figure 22: Global Market Attractiveness by Capacity, 2025 to 2035
  • Figure 23: Global Market Attractiveness by End Use, 2025 to 2035
  • Figure 24: Global Market Attractiveness by Region, 2025 to 2035
  • Figure 25: North America Market Value (US$ Million) by Machine Type, 2025 to 2035
  • Figure 26: North America Market Value (US$ Million) by Capacity, 2025 to 2035
  • Figure 27: North America Market Value (US$ Million) by End Use, 2025 to 2035
  • Figure 28: North America Market Value (US$ Million) by Country, 2025 to 2035
  • Figure 29: North America Market Value (US$ Million) Analysis by Country, 2020 to 2035
  • Figure 30: North America Market Volume (Units) Analysis by Country, 2020 to 2035
  • Figure 31: North America Market Value Share (%) and BPS Analysis by Country, 2025 to 2035
  • Figure 32: North America Market Y-o-Y Growth (%) Projections by Country, 2025 to 2035
  • Figure 33: North America Market Value (US$ Million) Analysis by Machine Type, 2020 to 2035
  • Figure 34: North America Market Volume (Units) Analysis by Machine Type, 2020 to 2035
  • Figure 35: North America Market Value Share (%) and BPS Analysis by Machine Type, 2025 to 2035
  • Figure 36: North America Market Y-o-Y Growth (%) Projections by Machine Type, 2025 to 2035
  • Figure 37: North America Market Value (US$ Million) Analysis by Capacity, 2020 to 2035
  • Figure 38: North America Market Volume (Units) Analysis by Capacity, 2020 to 2035
  • Figure 39: North America Market Value Share (%) and BPS Analysis by Capacity, 2025 to 2035
  • Figure 40: North America Market Y-o-Y Growth (%) Projections by Capacity, 2025 to 2035
  • Figure 41: North America Market Value (US$ Million) Analysis by End Use, 2020 to 2035
  • Figure 42: North America Market Volume (Units) Analysis by End Use, 2020 to 2035
  • Figure 43: North America Market Value Share (%) and BPS Analysis by End Use, 2025 to 2035
  • Figure 44: North America Market Y-o-Y Growth (%) Projections by End Use, 2025 to 2035
  • Figure 45: North America Market Attractiveness by Machine Type, 2025 to 2035
  • Figure 46: North America Market Attractiveness by Capacity, 2025 to 2035
  • Figure 47: North America Market Attractiveness by End Use, 2025 to 2035
  • Figure 48: North America Market Attractiveness by Country, 2025 to 2035
  • Figure 49: Latin America Market Value (US$ Million) by Machine Type, 2025 to 2035
  • Figure 50: Latin America Market Value (US$ Million) by Capacity, 2025 to 2035
  • Figure 51: Latin America Market Value (US$ Million) by End Use, 2025 to 2035
  • Figure 52: Latin America Market Value (US$ Million) by Country, 2025 to 2035
  • Figure 53: Latin America Market Value (US$ Million) Analysis by Country, 2020 to 2035
  • Figure 54: Latin America Market Volume (Units) Analysis by Country, 2020 to 2035
  • Figure 55: Latin America Market Value Share (%) and BPS Analysis by Country, 2025 to 2035
  • Figure 56: Latin America Market Y-o-Y Growth (%) Projections by Country, 2025 to 2035
  • Figure 57: Latin America Market Value (US$ Million) Analysis by Machine Type, 2020 to 2035
  • Figure 58: Latin America Market Volume (Units) Analysis by Machine Type, 2020 to 2035
  • Figure 59: Latin America Market Value Share (%) and BPS Analysis by Machine Type, 2025 to 2035
  • Figure 60: Latin America Market Y-o-Y Growth (%) Projections by Machine Type, 2025 to 2035
  • Figure 61: Latin America Market Value (US$ Million) Analysis by Capacity, 2020 to 2035
  • Figure 62: Latin America Market Volume (Units) Analysis by Capacity, 2020 to 2035
  • Figure 63: Latin America Market Value Share (%) and BPS Analysis by Capacity, 2025 to 2035
  • Figure 64: Latin America Market Y-o-Y Growth (%) Projections by Capacity, 2025 to 2035
  • Figure 65: Latin America Market Value (US$ Million) Analysis by End Use, 2020 to 2035
  • Figure 66: Latin America Market Volume (Units) Analysis by End Use, 2020 to 2035
  • Figure 67: Latin America Market Value Share (%) and BPS Analysis by End Use, 2025 to 2035
  • Figure 68: Latin America Market Y-o-Y Growth (%) Projections by End Use, 2025 to 2035
  • Figure 69: Latin America Market Attractiveness by Machine Type, 2025 to 2035
  • Figure 70: Latin America Market Attractiveness by Capacity, 2025 to 2035
  • Figure 71: Latin America Market Attractiveness by End Use, 2025 to 2035
  • Figure 72: Latin America Market Attractiveness by Country, 2025 to 2035
  • Figure 73: Western Europe Market Value (US$ Million) by Machine Type, 2025 to 2035
  • Figure 74: Western Europe Market Value (US$ Million) by Capacity, 2025 to 2035
  • Figure 75: Western Europe Market Value (US$ Million) by End Use, 2025 to 2035
  • Figure 76: Western Europe Market Value (US$ Million) by Country, 2025 to 2035
  • Figure 77: Western Europe Market Value (US$ Million) Analysis by Country, 2020 to 2035
  • Figure 78: Western Europe Market Volume (Units) Analysis by Country, 2020 to 2035
  • Figure 79: Western Europe Market Value Share (%) and BPS Analysis by Country, 2025 to 2035
  • Figure 80: Western Europe Market Y-o-Y Growth (%) Projections by Country, 2025 to 2035
  • Figure 81: Western Europe Market Value (US$ Million) Analysis by Machine Type, 2020 to 2035
  • Figure 82: Western Europe Market Volume (Units) Analysis by Machine Type, 2020 to 2035
  • Figure 83: Western Europe Market Value Share (%) and BPS Analysis by Machine Type, 2025 to 2035
  • Figure 84: Western Europe Market Y-o-Y Growth (%) Projections by Machine Type, 2025 to 2035
  • Figure 85: Western Europe Market Value (US$ Million) Analysis by Capacity, 2020 to 2035
  • Figure 86: Western Europe Market Volume (Units) Analysis by Capacity, 2020 to 2035
  • Figure 87: Western Europe Market Value Share (%) and BPS Analysis by Capacity, 2025 to 2035
  • Figure 88: Western Europe Market Y-o-Y Growth (%) Projections by Capacity, 2025 to 2035
  • Figure 89: Western Europe Market Value (US$ Million) Analysis by End Use, 2020 to 2035
  • Figure 90: Western Europe Market Volume (Units) Analysis by End Use, 2020 to 2035
  • Figure 91: Western Europe Market Value Share (%) and BPS Analysis by End Use, 2025 to 2035
  • Figure 92: Western Europe Market Y-o-Y Growth (%) Projections by End Use, 2025 to 2035
  • Figure 93: Western Europe Market Attractiveness by Machine Type, 2025 to 2035
  • Figure 94: Western Europe Market Attractiveness by Capacity, 2025 to 2035
  • Figure 95: Western Europe Market Attractiveness by End Use, 2025 to 2035
  • Figure 96: Western Europe Market Attractiveness by Country, 2025 to 2035
  • Figure 97: Eastern Europe Market Value (US$ Million) by Machine Type, 2025 to 2035
  • Figure 98: Eastern Europe Market Value (US$ Million) by Capacity, 2025 to 2035
  • Figure 99: Eastern Europe Market Value (US$ Million) by End Use, 2025 to 2035
  • Figure 100: Eastern Europe Market Value (US$ Million) by Country, 2025 to 2035
  • Figure 101: Eastern Europe Market Value (US$ Million) Analysis by Country, 2020 to 2035
  • Figure 102: Eastern Europe Market Volume (Units) Analysis by Country, 2020 to 2035
  • Figure 103: Eastern Europe Market Value Share (%) and BPS Analysis by Country, 2025 to 2035
  • Figure 104: Eastern Europe Market Y-o-Y Growth (%) Projections by Country, 2025 to 2035
  • Figure 105: Eastern Europe Market Value (US$ Million) Analysis by Machine Type, 2020 to 2035
  • Figure 106: Eastern Europe Market Volume (Units) Analysis by Machine Type, 2020 to 2035
  • Figure 107: Eastern Europe Market Value Share (%) and BPS Analysis by Machine Type, 2025 to 2035
  • Figure 108: Eastern Europe Market Y-o-Y Growth (%) Projections by Machine Type, 2025 to 2035
  • Figure 109: Eastern Europe Market Value (US$ Million) Analysis by Capacity, 2020 to 2035
  • Figure 110: Eastern Europe Market Volume (Units) Analysis by Capacity, 2020 to 2035
  • Figure 111: Eastern Europe Market Value Share (%) and BPS Analysis by Capacity, 2025 to 2035
  • Figure 112: Eastern Europe Market Y-o-Y Growth (%) Projections by Capacity, 2025 to 2035
  • Figure 113: Eastern Europe Market Value (US$ Million) Analysis by End Use, 2020 to 2035
  • Figure 114: Eastern Europe Market Volume (Units) Analysis by End Use, 2020 to 2035
  • Figure 115: Eastern Europe Market Value Share (%) and BPS Analysis by End Use, 2025 to 2035
  • Figure 116: Eastern Europe Market Y-o-Y Growth (%) Projections by End Use, 2025 to 2035
  • Figure 117: Eastern Europe Market Attractiveness by Machine Type, 2025 to 2035
  • Figure 118: Eastern Europe Market Attractiveness by Capacity, 2025 to 2035
  • Figure 119: Eastern Europe Market Attractiveness by End Use, 2025 to 2035
  • Figure 120: Eastern Europe Market Attractiveness by Country, 2025 to 2035
  • Figure 121: South Asia and Pacific Market Value (US$ Million) by Machine Type, 2025 to 2035
  • Figure 122: South Asia and Pacific Market Value (US$ Million) by Capacity, 2025 to 2035
  • Figure 123: South Asia and Pacific Market Value (US$ Million) by End Use, 2025 to 2035
  • Figure 124: South Asia and Pacific Market Value (US$ Million) by Country, 2025 to 2035
  • Figure 125: South Asia and Pacific Market Value (US$ Million) Analysis by Country, 2020 to 2035
  • Figure 126: South Asia and Pacific Market Volume (Units) Analysis by Country, 2020 to 2035
  • Figure 127: South Asia and Pacific Market Value Share (%) and BPS Analysis by Country, 2025 to 2035
  • Figure 128: South Asia and Pacific Market Y-o-Y Growth (%) Projections by Country, 2025 to 2035
  • Figure 129: South Asia and Pacific Market Value (US$ Million) Analysis by Machine Type, 2020 to 2035
  • Figure 130: South Asia and Pacific Market Volume (Units) Analysis by Machine Type, 2020 to 2035
  • Figure 131: South Asia and Pacific Market Value Share (%) and BPS Analysis by Machine Type, 2025 to 2035
  • Figure 132: South Asia and Pacific Market Y-o-Y Growth (%) Projections by Machine Type, 2025 to 2035
  • Figure 133: South Asia and Pacific Market Value (US$ Million) Analysis by Capacity, 2020 to 2035
  • Figure 134: South Asia and Pacific Market Volume (Units) Analysis by Capacity, 2020 to 2035
  • Figure 135: South Asia and Pacific Market Value Share (%) and BPS Analysis by Capacity, 2025 to 2035
  • Figure 136: South Asia and Pacific Market Y-o-Y Growth (%) Projections by Capacity, 2025 to 2035
  • Figure 137: South Asia and Pacific Market Value (US$ Million) Analysis by End Use, 2020 to 2035
  • Figure 138: South Asia and Pacific Market Volume (Units) Analysis by End Use, 2020 to 2035
  • Figure 139: South Asia and Pacific Market Value Share (%) and BPS Analysis by End Use, 2025 to 2035
  • Figure 140: South Asia and Pacific Market Y-o-Y Growth (%) Projections by End Use, 2025 to 2035
  • Figure 141: South Asia and Pacific Market Attractiveness by Machine Type, 2025 to 2035
  • Figure 142: South Asia and Pacific Market Attractiveness by Capacity, 2025 to 2035
  • Figure 143: South Asia and Pacific Market Attractiveness by End Use, 2025 to 2035
  • Figure 144: South Asia and Pacific Market Attractiveness by Country, 2025 to 2035
  • Figure 145: East Asia Market Value (US$ Million) by Machine Type, 2025 to 2035
  • Figure 146: East Asia Market Value (US$ Million) by Capacity, 2025 to 2035
  • Figure 147: East Asia Market Value (US$ Million) by End Use, 2025 to 2035
  • Figure 148: East Asia Market Value (US$ Million) by Country, 2025 to 2035
  • Figure 149: East Asia Market Value (US$ Million) Analysis by Country, 2020 to 2035
  • Figure 150: East Asia Market Volume (Units) Analysis by Country, 2020 to 2035
  • Figure 151: East Asia Market Value Share (%) and BPS Analysis by Country, 2025 to 2035
  • Figure 152: East Asia Market Y-o-Y Growth (%) Projections by Country, 2025 to 2035
  • Figure 153: East Asia Market Value (US$ Million) Analysis by Machine Type, 2020 to 2035
  • Figure 154: East Asia Market Volume (Units) Analysis by Machine Type, 2020 to 2035
  • Figure 155: East Asia Market Value Share (%) and BPS Analysis by Machine Type, 2025 to 2035
  • Figure 156: East Asia Market Y-o-Y Growth (%) Projections by Machine Type, 2025 to 2035
  • Figure 157: East Asia Market Value (US$ Million) Analysis by Capacity, 2020 to 2035
  • Figure 158: East Asia Market Volume (Units) Analysis by Capacity, 2020 to 2035
  • Figure 159: East Asia Market Value Share (%) and BPS Analysis by Capacity, 2025 to 2035
  • Figure 160: East Asia Market Y-o-Y Growth (%) Projections by Capacity, 2025 to 2035
  • Figure 161: East Asia Market Value (US$ Million) Analysis by End Use, 2020 to 2035
  • Figure 162: East Asia Market Volume (Units) Analysis by End Use, 2020 to 2035
  • Figure 163: East Asia Market Value Share (%) and BPS Analysis by End Use, 2025 to 2035
  • Figure 164: East Asia Market Y-o-Y Growth (%) Projections by End Use, 2025 to 2035
  • Figure 165: East Asia Market Attractiveness by Machine Type, 2025 to 2035
  • Figure 166: East Asia Market Attractiveness by Capacity, 2025 to 2035
  • Figure 167: East Asia Market Attractiveness by End Use, 2025 to 2035
  • Figure 168: East Asia Market Attractiveness by Country, 2025 to 2035
  • Figure 169: Middle East and Africa Market Value (US$ Million) by Machine Type, 2025 to 2035
  • Figure 170: Middle East and Africa Market Value (US$ Million) by Capacity, 2025 to 2035
  • Figure 171: Middle East and Africa Market Value (US$ Million) by End Use, 2025 to 2035
  • Figure 172: Middle East and Africa Market Value (US$ Million) by Country, 2025 to 2035
  • Figure 173: Middle East and Africa Market Value (US$ Million) Analysis by Country, 2020 to 2035
  • Figure 174: Middle East and Africa Market Volume (Units) Analysis by Country, 2020 to 2035
  • Figure 175: Middle East and Africa Market Value Share (%) and BPS Analysis by Country, 2025 to 2035
  • Figure 176: Middle East and Africa Market Y-o-Y Growth (%) Projections by Country, 2025 to 2035
  • Figure 177: Middle East and Africa Market Value (US$ Million) Analysis by Machine Type, 2020 to 2035
  • Figure 178: Middle East and Africa Market Volume (Units) Analysis by Machine Type, 2020 to 2035
  • Figure 179: Middle East and Africa Market Value Share (%) and BPS Analysis by Machine Type, 2025 to 2035
  • Figure 180: Middle East and Africa Market Y-o-Y Growth (%) Projections by Machine Type, 2025 to 2035
  • Figure 181: Middle East and Africa Market Value (US$ Million) Analysis by Capacity, 2020 to 2035
  • Figure 182: Middle East and Africa Market Volume (Units) Analysis by Capacity, 2020 to 2035
  • Figure 183: Middle East and Africa Market Value Share (%) and BPS Analysis by Capacity, 2025 to 2035
  • Figure 184: Middle East and Africa Market Y-o-Y Growth (%) Projections by Capacity, 2025 to 2035
  • Figure 185: Middle East and Africa Market Value (US$ Million) Analysis by End Use, 2020 to 2035
  • Figure 186: Middle East and Africa Market Volume (Units) Analysis by End Use, 2020 to 2035
  • Figure 187: Middle East and Africa Market Value Share (%) and BPS Analysis by End Use, 2025 to 2035
  • Figure 188: Middle East and Africa Market Y-o-Y Growth (%) Projections by End Use, 2025 to 2035
  • Figure 189: Middle East and Africa Market Attractiveness by Machine Type, 2025 to 2035
  • Figure 190: Middle East and Africa Market Attractiveness by Capacity, 2025 to 2035
  • Figure 191: Middle East and Africa Market Attractiveness by End Use, 2025 to 2035
  • Figure 192: Middle East and Africa Market Attractiveness by Country, 2025 to 2035

Frequently Asked Questions

What was the overall size of the Automatic Banding Machine Market in 2025?

The overall market size for the Automatic Banding Machine Market was USD 3.8 Billion in 2025.

How big is the Automatic Banding Machine Market expected to be in 2035?

The Automatic Banding Machine Market is expected to reach USD 5.6 Billion in 2035.

What will drive the demand for the Automatic Banding Machine Market during the forecast period?

The demand is driven by increasing automation in packaging, rising e-commerce activities, growing demand for efficient product bundling, and stringent regulations on sustainable packaging solutions.

List the top 5 countries contributing to the Automatic Banding Machine Market?

The top 5 countries driving market growth are USA, UK, Europe, Japan, and South Korea.

Which segment is expected to lead in the Automatic Banding Machine Market?

Automatic Banding Machines is expected to command a significant share over the assessment period.

Explore Similar Insights

Future Market Insights

Automatic Banding Machine Market