Reports

- Global Locations -

Headquarters

Future Market Insights, Inc.

Christiana Corporate, 200
Continental Drive, Suite 401,
Newark, Delaware - 19713,
United States

T: +1-845-579-5705

Americas

Future Market Insights, Inc.

616 Corporate Way, Suite 2-9018,
Valley Cottage, NY 10989, United States

T: +1-347-918-3531

MEA

Future Market Insights

1602-6 Jumeirah Bay X2 Tower, Plot No: JLT-PH2-X2A,
Jumeirah Lakes Towers, Dubai,
United Arab Emirates

Europe

Future Market Insights

3rd Floor, 207 Regent Street,
W1B 3HH London
United Kingdom

T: + 44 (0) 20 8123 9659
D: +44 (0) 20 3287 4268

Asia Pacific

Future Market Insights

IndiaLand Global Tech Park, Unit UG-1, Behind Grand HighStreet, Phase 1, Hinjawadi, MH, Pune – 411057, India

Smart Packaging Market Outlook (2023 to 2033)

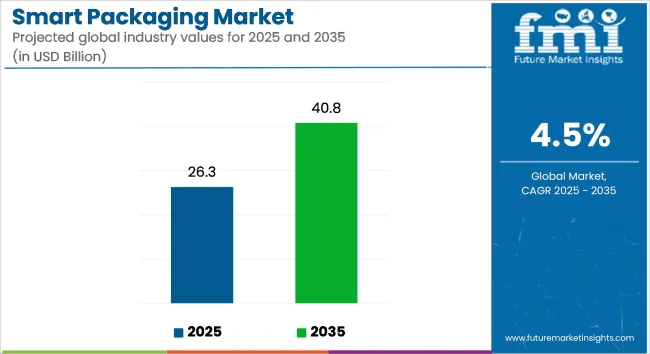
The smart packaging market is likely to be valued at US$ 24.6 billion in 2023 and is estimated to value at US$ 38.3 billion in 2033. From 2023 to 2033, the smart packaging industry is projected to expand at a CAGR of 4.5%.

Smart packaging is a synthesis of specialized materials, science, and technology that improves the functioning of conventional packaging by including active and intelligent packaging. In addition to enhancing the flavor, aroma, and other qualities of food products, it aids in brand protection, premium pricing, and waste reduction.

The growing proportion of older people and changes in consumer lifestyle is contributing to increasing demand for advanced packaging solutions from the food processing and pharmaceutical sectors. The growing consumer concern about food waste reduction and the demand for smart and functional packaging are also factors accelerating market growth for smart packaging.

The market is projected to be driven by the developing e-commerce market and rising industrialization in emerging economies, as well as increased demand for superior logistics and supply chain management.

Better packaging is expensive as compared to traditional forms of packaging due to the expense of sensors and radio frequency identification (RFID) used for packaging applications, which are causing failures in mass applications for packaging systems. It leads to the collection of customer data, which, according to the smart packaging manufacturers, may lead to manipulative situations that confine the smart packaging market.

The Promising Future of Smart Packaging

  • Smart packaging improves supply chain efficiency by allowing for better inventory management and lowering product waste.
  • The incorporation of augmented reality (AR) and virtual reality (VR) in packaging provides consumers with immersive and interactive experiences.
  • The growing e-commerce industry, as well as the demand for secure and effective packaging solutions, is driving the smart packaging market.
  • The use of intelligent labels and tags equipped with temperature and humidity sensors protects the freshness and quality of perishable commodities.
  • With a great emphasis on anti-counterfeiting measures, smart packaging solutions with unique identification elements are being implemented.
  • Through targeted messages and promotions, smart packaging solutions offer personalized marketing and consumer involvement.
  • Innovations in printed electronics and flexible packaging technologies drive the creation of novel smart packaging solutions.

Smart Packaging Market (2018 to 2022)

Market HCAGR 5.4%
Market Size - 2018 US$ 19.62 billion
Market Size - 2022 US$ 23.4 billion

Smart Packaging Market (2023 to 2033)

Market CAGR 4.5%
Market Size - 2023 US$ 24.6 billion
Market Size - 2033 US$ 38.3 billion

Don't pay for what you don't need

Customize your report by selecting specific countries or regions and save 30%!

Historical Comparison of the Smart Packaging Market from 2018 to 2022 and 2023 to 2033

The smart packaging market has seen considerable growth and advancements in recent years. Between 2018 and 2022, the market saw a steady increase in usage and technological innovation.

Companies from various industries recognized the potential of smart packaging to improve product safety, traceability, and consumer involvement. Further, technology like RFID, QR codes, and sensors grew increasingly common during this time, allowing for better inventory control and supply chain visibility.

The smart packaging industry is predicted to develop significantly between 2023 and 2033. This can be ascribed to many factors, including rising customer expectations for product transparency and incorporating Internet of Things (IoT) technologies into packaging.

Smart packaging is expected to become intelligent and interactive during this period. Temperature monitoring, freshness indications, and personalized content distribution may become standard features. Smart packaging may be critical in preventing counterfeiting and ensuring product authenticity.

The smart packaging market is expected to increase notably between 2023 and 2033, owing to technology advancements, customer preferences, and the need for improved supply chain efficiency.

Strengths

  • Automated solutions have a high growth potential.
  • Cost reductions and increased efficiency
  • Usability and tracking

Weaknesses

  • A lack of standardization in packing methods
  • Data security risk
  • High initial investment cost

Opportunities

  • There is an increasing desire for automated and traceable solutions.
  • IoT and AI are examples of advanced technology.
  • Emerging markets have a lot of promise.

Threats

  • Traditional packaging solutions are becoming competitive.
  • Inadequate awareness and technical knowledge
  • Environmental and regulatory constraints

Catalysts of Smart Packaging Market Evolution

Customers' Evolving Lifestyles

The smart packaging business is expanding due to quick urbanization and rising customer demand for single-use personal products with cutting-edge integrated innovation. The undeveloped geographic areas that offer tremendous open doors for market rivals are crucial to the global packaging industry business.

The Advancements in Printing Technologies

The advancement of printing technology in various industries is another market driver. Printed technologies have proven effective in the processing and presentation of data on paper and other surfaces. As a result, a lot of recent scientific research has been done on printed electronics and RFID technology, laying the groundwork for the future creation of applications for smart packaging.

Nanotechnology Research and Development

The smart packaging industry is growing due to research into numerous food and beverage applications for nanotechnology, retailer and manufacturer need for shelf-stable and sustainable packaging choices, and increased packaged food product consumption.

Ismail Sutaria
Ismail Sutaria

Principal Consultant

Talk to Analyst

Find your sweet spots for generating winning opportunities in this market.

Strategies for Conquering Market Challenges

Insufficient knowledge

The lack of consumer knowledge, which results in a lack of desire for these clever solutions, is expected to limit the smart packaging market development rate and make it difficult for the market to grow.

Expensive Technologies for a Futuristic World

The significant challenge for companies in the smart packaging industry is figuring out how to put expensive new technology into the packaging without raising or cutting customer prices. Additional challenges include educating clients about the benefits of smart packaging and developing inventive production procedures for technologically advanced sensors that can comply with current packaging regulations.

Price of Capital

Several factors limit and challenge the progress of the smart packaging market, including the high cost of capital for installation and security issues. The developments of new techniques for producing sensors and indications compliant with current packaging requirements, along with customer awareness, pose challenges to the market's advancement.

Unearthing Lucrative Market Opportunities

Innovating Packaging for the Healthcare Sector

In the healthcare industry, intelligent packaging is crucial. Some equipment and drugs require special packaging and temperature-controlled shipment. The surge in smart packaging demand has experienced a significant boost.

The adoption of smart packaging services has increased due to the prevalence of chronic illness and the aging population's increased demand for over-the-counter medications.

Tapping into the Leading Market

Several companies in the smart packaging industry are encouraged by the market's great CAGR. The smart packaging industry's profitability entices them. They are significantly investing in research and development to produce new technologies that allow them to design and market environmentally friendly smart packaging.

The demand for smart packaging is to expand dramatically in the future as a result. These companies' next packaging may be safe and hygienic owing to advancements in printing technology.

Meeting the Growing Demand for Temperature Controlled Packaging

The food, beverage, and pharmaceutical industries are placing a great emphasis on temperature-controlled packaging due to their contents' sensitivity to temperature. Further, the smart packaging business is growing as a result of this. Enterprises in this sector now brand and identify parts with labels, increasing product demand. Moreover, the high initial costs of manufacture and execution can constrain the market's expansion rate.

Get the data you need at a Fraction of the cost

Personalize your report by choosing insights you need
and save 40%!

Comparative View of the Adjacent Smart Packaging Industry

Smart Packaging Market:

Attributes Smart Packaging Market
CAGR (From 2023 to 2033) 4.5%
Market Value (2023) US$ 24.6 billion
Growth Factor Sustainable packaging surge drives the smart market growth.
Opportunity Advanced tech boosts real-time tracking in smart packaging.
Key Trends Consumer demand fuels smart packaging adoption for authenticity and safety.

Nano-enabled Packaging Market:

Attributes Nano-enabled Packaging Market
CAGR (From 2023 to 2033) 12.7%
Market Value (2023) US$ 21.47 billion
Growth Factor Nano packaging improves food safety and extends shelf life.
Opportunity Smart features in Nano packaging enhance monitoring and quality control.
Key Trends Sustainable Nano packaging supports eco-friendly solutions and recycling.

Active, Smart, and Intelligent Packaging Market:

Attributes Active, Smart, and Intelligent Packaging Market
CAGR (From 2023 to 2033) 9.8%
Market Value (2023) US$ 29.76 billion
Growth Factor IoT and RFID integration for real-time product tracking in active packaging.
Opportunity Eco-friendly packaging driving intelligent material and design adoption.
Key Trends Smart packaging enhances personalized consumer experiences with AR and NFC.

Country–wise Insights

Enhancing Consumer Experience: The Evolution of North America Smart Packaging

Attributes Details
The United States Market Size - 2032 US$ 6.0 billion
The United States Market Absolute Dollar Growth US$ 1.7 billion
CAGR % 2018 to 2022 2.4%
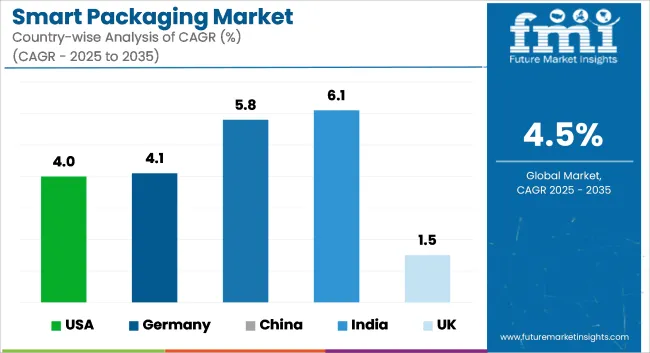
CAGR % 2023 to 2033 3.4%

The smart packaging industry in North America is expanding and innovating significantly. Advanced technology, including RFID tags, sensors, and data transmission systems, are incorporated into smart packaging to improve product safety, traceability, and consumer interaction. Moreover, increasing customer desire for convenience and product information, growing consumer concern about product authenticity, and strict laws for product safety are the reasons surging the industry.

Several industries, including food and beverage, healthcare, and logistics, have used smart packaging technologies. North America’s smart packaging market is expected to increase in the next years due to continued technology advancements and an increasing focus on sustainability.

Embracing the Digital Era: Europe's Shift toward Smart Packaging

Attributes Details
The United Kingdom Market Size - 2032 US$ 1.0 billion
The United Kingdom Market Absolute Dollar Growth US$ 247.5 million
CAGR % 2018 to 2022 1.0%
CAGR % 2023 to 2033 3.0%

The smart packaging industry in Europe is expanding significantly due to the growing demand for creative packaging solutions across numerous industries. Smart packaging merges cutting-edge technologies, including RFID tags, sensors, and printed electronics, to provide product tracking, temperature monitoring, and tamper detection features. Further, with this technology, supply chain efficiency, product safety, and customer experience may all be improved.

The smart packaging industry is being driven by the rising popularity of e-commerce and the increased focus on sustainability. To produce unique packaging solutions and create profitable prospects for market expansion, key players in Europe smart packaging market are concentrating on research and development initiatives.

Trailblazing the Future: Asia Pacific's Journey toward Innovation and Sustainability

Attributes China Market
Market Size - 2033 US$ 9.7 billion
Market Absolute Dollar Growth US$ 4.2 billion
CAGR % 2018 to 2022 7.5%
CAGR % 2023 to 2033 5.9%
Attributes Japan Market
Market Size - 2033 US$ 6.0 billion
Market Absolute Dollar Growth US$ 2.2 billion
CAGR % 2018 to 2022 5.6%
CAGR % 2023 to 2033 4.7%
Attributes South Korea Market
Market Size - 2033 US$ 2.3 billion
Market Absolute Dollar Growth US$ 888.2 million
CAGR % 2018 to 2022 6.8%
CAGR % 2023 to 2033 4.9%

The smart packaging business in Asia Pacific is expanding quickly and is projected to continue. Smart packaging refers to integrating cutting-edge technology into package materials and designs to improve functionality and offer value-added benefits.

The implementation of smart packaging solutions is being sped up by the region's developing e-commerce industry, increased customer demand for convenience, and growing environmental concerns. Among other things, these solutions include temperature indicators, intelligent labeling, and active packaging.

Strong investments are being made in research and developments, technological improvements, and smart packaging player partnerships in Asia Pacific Smart Packaging market. The smart packaging industry is anticipated to experience consistent growth in the following years due to the growing emphasis on sustainability and supply chain efficiency.

Category – Wise Insights

A Fresh Perspective on Type Outlook

Attributes Details
Top Type Modified Atmosphere Packaging
CAGR % 2018 to 2022 5.2%
CAGR % 2023 to 2033 4.4%

Based on type, in 2023, the modified atmosphere packaging category was expected to have a hefty smart packaging market share. The rising demand for fresh and high-quality packaged food items such as bread, fruits and vegetables, processed meat, fish, and dairy goods is mostly to blame for this segment's leading position.

The demand for modified atmosphere packaging is driven by an on-the-go lifestyle, a move toward simple and easy-to-handle packaging, and emerging markets. Gas packing equipment and supplies are expensive when utilized in modified environment packaging. This can impede the market expansion of smart packaging for changed atmospheres.

Navigating the End-user Outlook

Attributes Details
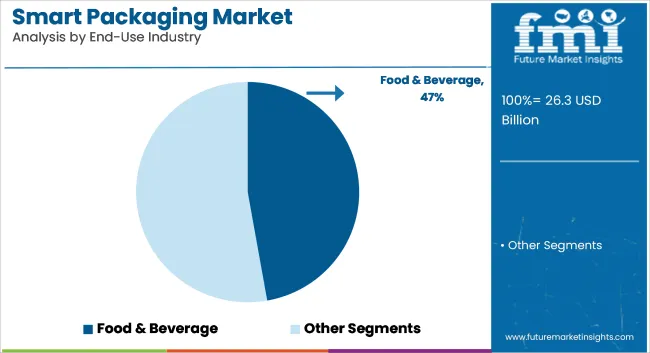
Top End-user Food & Beverage
CAGR % 2018 to 2022 5.0%
CAGR % 2023 to 2033 4.3%

Based on type, in 2023, the modified atmosphere packaging category was expected to have a big smart packaging market share. The rising demand for fresh and high-quality packaged food items such as bread, fruits, vegetables, processed meat, fish, and dairy goods is mostly to blame for this segment's leading position.

An on-the-go lifestyle drives the demand for modified atmosphere packaging, a move toward simple and easy-to-handle packaging, and emerging markets. Gas packing equipment and supplies are expensive when utilized in modified environment packaging. This can impede the market expansion of smart packaging for changed atmospheres.

How can Manufacturers Scale their Businesses in the Smart Packaging Market?

  • Embrace technological advancements and integrate smart packaging solutions into their production processes.
  • Collaborate with technology providers to develop innovative and customizable smart packaging solutions.
  • Invest in research and development to continuously improve and expand their smart packaging product offerings.
  • Build strategic partnerships with retailers and e-commerce platforms to increase market reach and accessibility.
  • Implement efficient supply chain management systems to streamline the production and distribution of smart packaging products.
  • Conduct market research to identify emerging trends and consumer demands in the smart packaging market.

Competitive Landscape

Leading smart packaging manufacturers are investing a lot of money in research and development to expand their product offerings, which may stimulate market expansion for smart packaging. With significant industry changes like product releases, agreements, mergers and acquisitions, investments, and collaboration with other organizations, market participants are undertaking various strategic activities to expand their footprint.

Participants in the smart packaging industry need to provide cost-effective offerings to prosper and excel within an increasingly competitive and expanding market landscape. The key smart packaging manufacturers are hugely spending on their product lines, which propels the market expansion for smart packaging. Further, the smart packaging manufacturers in the sector must provide affordable products to grow and prosper in a market environment that is becoming more competitive and expanding.

Essential Key Smart Packaging Manufacturers

  • 3M
  • BASF SE,
  • Crown
  • Avery Dennison Corporation
  • Ball Corporation
  • Sysco Corporation
  • Zebra Technologies Corp. (Temptime Corporation)
  • International Paper
  • R.R. Donnelley & Sons Company
  • Stora Enso

Latest Innovations and Developments

Company Kellogg's
Strategy Innovative Kellogg's Cereal Boxes Enable Accessibility for the Blind
Details After a successful trial on Coco Pops boxes with UK grocer Co-op, Kellogg's permanently modified all of its cereal boxes for blind and partially sighted consumers in August 2021. The inclusive cereal boxes are coded on the outside so that cellphones can read the labeling and allergen information and play it back to users. According to the report, the NaviLens technology is comparable to a QR code but can be read up to three meters away in a quarter of the time.
Company Avery Dennison Corporation
Strategy Enhanced Tyre Tracking Made Easy with Avery Dennison's AD Maxdura Tyre Tag
Details Avery Dennison Corporation introduced its AD Maxdura Tire Tag for the tire sector in September 2021. The new solution makes it simple to identify tires at warehouses and dealerships and allows tracking and tracing along the logistic chain.
Company Stora Enso
Strategy Launch
Details In April 2021, Stora Enso unveiled the first microwave-safe sustainable RFID in the world. It aids in ready-made meals and item-level labeling.
Company BASF
Strategy HolyGrail 2.0: BASF and Partners Harness Digital Watermarking for Smart Packaging
Details May 2021 saw BASF join the "HolyGrail 2.0" Digital Watermark Initiative for recycling smart packaging. The European Brands Association, BASF, and more than 120 businesses and organizations from the packaging value chain collaborated on the project to demonstrate the potential of digital watermarking technology for precise sorting and the business case on a broad scale. The effort was sponsored by AIM.

Frequently Asked Questions

What is the Present Valuation of the Smart Packaging Market?

The smart packaging market holds a valuation of US$ 24.6 billion in 2023.

What is the Smart Packaging Market Size Projected by 2033?

The projected value of the smart packaging market is anticipated to attain US$ 38.3 billion by 2033.

What is the CAGR Prediction for the Smart Packaging Market?

The smart packaging market is anticipated to register a CAGR of 4.5% through 2033.

Which Country Holds High Lucrativeness for Smart Packaging?

China is a prime hub for the smart packaging market, set to hit US$ 9.7 billion by 2033.

How was the Historical Performance of the Smart Packaging Market?

In 2022, the smart packaging market held a valuation of US$ 23.4 billion, exhibiting a CAGR of 5.4%.

Table of Content

1. Executive Summary

    1.1. Global Market Outlook

    1.2. Demand-side Trends

    1.3. Supply-side Trends

    1.4. Technology Roadmap Analysis

    1.5. Analysis and Recommendations

2. Market Overview

    2.1. Market Coverage / Taxonomy

    2.2. Market Definition / Scope / Limitations

3. Market Background

    3.1. Market Dynamics

        3.1.1. Drivers

        3.1.2. Restraints

        3.1.3. Opportunity

        3.1.4. Trends

    3.2. Scenario Forecast

        3.2.1. Demand in Optimistic Scenario

        3.2.2. Demand in Likely Scenario

        3.2.3. Demand in Conservative Scenario

    3.3. Opportunity Map Analysis

    3.4. Investment Feasibility Matrix

    3.5. PESTLE and Porter’s Analysis

    3.6. Regulatory Landscape

        3.6.1. By Key Regions

        3.6.2. By Key Countries

    3.7. Regional Parent Market Outlook

4. Global Market Analysis 2018 to 2022 and Forecast, 2023 to 2033

    4.1. Historical Market Size Value (US$ Million) Analysis, 2018 to 2022

    4.2. Current and Future Market Size Value (US$ Million) Projections, 2023 to 2033

        4.2.1. Y-o-Y Growth Trend Analysis

        4.2.2. Absolute $ Opportunity Analysis

5. Global Market Analysis 2018 to 2022 and Forecast 2023 to 2033, By Type

    5.1. Introduction / Key Findings

    5.2. Historical Market Size Value (US$ Million) Analysis By Type, 2018 to 2022

    5.3. Current and Future Market Size Value (US$ Million) Analysis and Forecast By Type, 2023 to 2033

        5.3.1. Active Packaging

        5.3.2. Intelligent Packaging

        5.3.3. Modified Atmosphere Packaging

    5.4. Y-o-Y Growth Trend Analysis By Type, 2018 to 2022

    5.5. Absolute $ Opportunity Analysis By Type, 2023 to 2033

6. Global Market Analysis 2018 to 2022 and Forecast 2023 to 2033, By End-user

    6.1. Introduction / Key Findings

    6.2. Historical Market Size Value (US$ Million) Analysis By End-user, 2018 to 2022

    6.3. Current and Future Market Size Value (US$ Million) Analysis and Forecast By End-user, 2023 to 2033

        6.3.1. Food & Beverage

        6.3.2. Personal Care

        6.3.3. Healthcare

        6.3.4. Automotive

        6.3.5. Others

    6.4. Y-o-Y Growth Trend Analysis By End-user, 2018 to 2022

    6.5. Absolute $ Opportunity Analysis By End-user, 2023 to 2033

7. Global Market Analysis 2018 to 2022 and Forecast 2023 to 2033, By Material

    7.1. Introduction / Key Findings

    7.2. Historical Market Size Value (US$ Million) Analysis By Material, 2018 to 2022

    7.3. Current and Future Market Size Value (US$ Million) Analysis and Forecast By Material, 2023 to 2033

        7.3.1. Solid

        7.3.2. Liquid

    7.4. Y-o-Y Growth Trend Analysis By Material, 2018 to 2022

    7.5. Absolute $ Opportunity Analysis By Material, 2023 to 2033

8. Global Market Analysis 2018 to 2022 and Forecast 2023 to 2033, By Region

    8.1. Introduction

    8.2. Historical Market Size Value (US$ Million) Analysis By Region, 2018 to 2022

    8.3. Current Market Size Value (US$ Million) Analysis and Forecast By Region, 2023 to 2033

        8.3.1. North America

        8.3.2. Latin America

        8.3.3. Europe

        8.3.4. Asia Pacific

        8.3.5. MEA

    8.4. Market Attractiveness Analysis By Region

9. North America Market Analysis 2018 to 2022 and Forecast 2023 to 2033, By Country

    9.1. Historical Market Size Value (US$ Million) Trend Analysis By Market Taxonomy, 2018 to 2022

    9.2. Market Size Value (US$ Million) Forecast By Market Taxonomy, 2023 to 2033

        9.2.1. By Country

            9.2.1.1. U.S.

            9.2.1.2. Canada

        9.2.2. By Type

        9.2.3. By End-user

        9.2.4. By Material

    9.3. Market Attractiveness Analysis

        9.3.1. By Country

        9.3.2. By Type

        9.3.3. By End-user

        9.3.4. By Material

    9.4. Key Takeaways

10. Latin America Market Analysis 2018 to 2022 and Forecast 2023 to 2033, By Country

    10.1. Historical Market Size Value (US$ Million) Trend Analysis By Market Taxonomy, 2018 to 2022

    10.2. Market Size Value (US$ Million) Forecast By Market Taxonomy, 2023 to 2033

        10.2.1. By Country

            10.2.1.1. Brazil

            10.2.1.2. Mexico

            10.2.1.3. Rest of Latin America

        10.2.2. By Type

        10.2.3. By End-user

        10.2.4. By Material

    10.3. Market Attractiveness Analysis

        10.3.1. By Country

        10.3.2. By Type

        10.3.3. By End-user

        10.3.4. By Material

    10.4. Key Takeaways

11. Europe Market Analysis 2018 to 2022 and Forecast 2023 to 2033, By Country

    11.1. Historical Market Size Value (US$ Million) Trend Analysis By Market Taxonomy, 2018 to 2022

    11.2. Market Size Value (US$ Million) Forecast By Market Taxonomy, 2023 to 2033

        11.2.1. By Country

            11.2.1.1. Germany

            11.2.1.2. U.K.

            11.2.1.3. France

            11.2.1.4. Spain

            11.2.1.5. Italy

            11.2.1.6. Rest of Europe

        11.2.2. By Type

        11.2.3. By End-user

        11.2.4. By Material

    11.3. Market Attractiveness Analysis

        11.3.1. By Country

        11.3.2. By Type

        11.3.3. By End-user

        11.3.4. By Material

    11.4. Key Takeaways

12. Asia Pacific Market Analysis 2018 to 2022 and Forecast 2023 to 2033, By Country

    12.1. Historical Market Size Value (US$ Million) Trend Analysis By Market Taxonomy, 2018 to 2022

    12.2. Market Size Value (US$ Million) Forecast By Market Taxonomy, 2023 to 2033

        12.2.1. By Country

            12.2.1.1. China

            12.2.1.2. Japan

            12.2.1.3. South Korea

            12.2.1.4. Singapore

            12.2.1.5. Thailand

            12.2.1.6. Indonesia

            12.2.1.7. Australia

            12.2.1.8. New Zealand

            12.2.1.9. Rest of Asia Pacific

        12.2.2. By Type

        12.2.3. By End-user

        12.2.4. By Material

    12.3. Market Attractiveness Analysis

        12.3.1. By Country

        12.3.2. By Type

        12.3.3. By End-user

        12.3.4. By Material

    12.4. Key Takeaways

13. MEA Market Analysis 2018 to 2022 and Forecast 2023 to 2033, By Country

    13.1. Historical Market Size Value (US$ Million) Trend Analysis By Market Taxonomy, 2018 to 2022

    13.2. Market Size Value (US$ Million) Forecast By Market Taxonomy, 2023 to 2033

        13.2.1. By Country

            13.2.1.1. GCC Countries

            13.2.1.2. South Africa

            13.2.1.3. Israel

            13.2.1.4. Rest of MEA

        13.2.2. By Type

        13.2.3. By End-user

        13.2.4. By Material

    13.3. Market Attractiveness Analysis

        13.3.1. By Country

        13.3.2. By Type

        13.3.3. By End-user

        13.3.4. By Material

    13.4. Key Takeaways

14. Key Countries Market Analysis

    14.1. U.S.

        14.1.1. Pricing Analysis

        14.1.2. Market Share Analysis, 2022

            14.1.2.1. By Type

            14.1.2.2. By End-user

            14.1.2.3. By Material

    14.2. Canada

        14.2.1. Pricing Analysis

        14.2.2. Market Share Analysis, 2022

            14.2.2.1. By Type

            14.2.2.2. By End-user

            14.2.2.3. By Material

    14.3. Brazil

        14.3.1. Pricing Analysis

        14.3.2. Market Share Analysis, 2022

            14.3.2.1. By Type

            14.3.2.2. By End-user

            14.3.2.3. By Material

    14.4. Mexico

        14.4.1. Pricing Analysis

        14.4.2. Market Share Analysis, 2022

            14.4.2.1. By Type

            14.4.2.2. By End-user

            14.4.2.3. By Material

    14.5. Germany

        14.5.1. Pricing Analysis

        14.5.2. Market Share Analysis, 2022

            14.5.2.1. By Type

            14.5.2.2. By End-user

            14.5.2.3. By Material

    14.6. U.K.

        14.6.1. Pricing Analysis

        14.6.2. Market Share Analysis, 2022

            14.6.2.1. By Type

            14.6.2.2. By End-user

            14.6.2.3. By Material

    14.7. France

        14.7.1. Pricing Analysis

        14.7.2. Market Share Analysis, 2022

            14.7.2.1. By Type

            14.7.2.2. By End-user

            14.7.2.3. By Material

    14.8. Spain

        14.8.1. Pricing Analysis

        14.8.2. Market Share Analysis, 2022

            14.8.2.1. By Type

            14.8.2.2. By End-user

            14.8.2.3. By Material

    14.9. Italy

        14.9.1. Pricing Analysis

        14.9.2. Market Share Analysis, 2022

            14.9.2.1. By Type

            14.9.2.2. By End-user

            14.9.2.3. By Material

    14.10. China

        14.10.1. Pricing Analysis

        14.10.2. Market Share Analysis, 2022

            14.10.2.1. By Type

            14.10.2.2. By End-user

            14.10.2.3. By Material

    14.11. Japan

        14.11.1. Pricing Analysis

        14.11.2. Market Share Analysis, 2022

            14.11.2.1. By Type

            14.11.2.2. By End-user

            14.11.2.3. By Material

    14.12. South Korea

        14.12.1. Pricing Analysis

        14.12.2. Market Share Analysis, 2022

            14.12.2.1. By Type

            14.12.2.2. By End-user

            14.12.2.3. By Material

    14.13. Singapore

        14.13.1. Pricing Analysis

        14.13.2. Market Share Analysis, 2022

            14.13.2.1. By Type

            14.13.2.2. By End-user

            14.13.2.3. By Material

    14.14. Thailand

        14.14.1. Pricing Analysis

        14.14.2. Market Share Analysis, 2022

            14.14.2.1. By Type

            14.14.2.2. By End-user

            14.14.2.3. By Material

    14.15. Indonesia

        14.15.1. Pricing Analysis

        14.15.2. Market Share Analysis, 2022

            14.15.2.1. By Type

            14.15.2.2. By End-user

            14.15.2.3. By Material

    14.16. Australia

        14.16.1. Pricing Analysis

        14.16.2. Market Share Analysis, 2022

            14.16.2.1. By Type

            14.16.2.2. By End-user

            14.16.2.3. By Material

    14.17. New Zealand

        14.17.1. Pricing Analysis

        14.17.2. Market Share Analysis, 2022

            14.17.2.1. By Type

            14.17.2.2. By End-user

            14.17.2.3. By Material

    14.18. GCC Countries

        14.18.1. Pricing Analysis

        14.18.2. Market Share Analysis, 2022

            14.18.2.1. By Type

            14.18.2.2. By End-user

            14.18.2.3. By Material

    14.19. South Africa

        14.19.1. Pricing Analysis

        14.19.2. Market Share Analysis, 2022

            14.19.2.1. By Type

            14.19.2.2. By End-user

            14.19.2.3. By Material

    14.20. Israel

        14.20.1. Pricing Analysis

        14.20.2. Market Share Analysis, 2022

            14.20.2.1. By Type

            14.20.2.2. By End-user

            14.20.2.3. By Material

15. Market Structure Analysis

    15.1. Competition Dashboard

    15.2. Competition Benchmarking

    15.3. Market Share Analysis of Top Players

        15.3.1. By Regional

        15.3.2. By Type

        15.3.3. By End-user

        15.3.4. By Material

16. Competition Analysis

    16.1. Competition Deep Dive

        16.1.1. 3M

            16.1.1.1. Overview

            16.1.1.2. Product Portfolio

            16.1.1.3. Profitability by Market Segments

            16.1.1.4. Sales Footprint

            16.1.1.5. Strategy Overview

                16.1.1.5.1. Marketing Strategy

        16.1.2. Avery Dennison Corporation

            16.1.2.1. Overview

            16.1.2.2. Product Portfolio

            16.1.2.3. Profitability by Market Segments

            16.1.2.4. Sales Footprint

            16.1.2.5. Strategy Overview

                16.1.2.5.1. Marketing Strategy

        16.1.3. Ball Corporation

            16.1.3.1. Overview

            16.1.3.2. Product Portfolio

            16.1.3.3. Profitability by Market Segments

            16.1.3.4. Sales Footprint

            16.1.3.5. Strategy Overview

                16.1.3.5.1. Marketing Strategy

        16.1.4. BASF SE

            16.1.4.1. Overview

            16.1.4.2. Product Portfolio

            16.1.4.3. Profitability by Market Segments

            16.1.4.4. Sales Footprint

            16.1.4.5. Strategy Overview

                16.1.4.5.1. Marketing Strategy

        16.1.5. Crown

            16.1.5.1. Overview

            16.1.5.2. Product Portfolio

            16.1.5.3. Profitability by Market Segments

            16.1.5.4. Sales Footprint

            16.1.5.5. Strategy Overview

                16.1.5.5.1. Marketing Strategy

        16.1.6. International Paper

            16.1.6.1. Overview

            16.1.6.2. Product Portfolio

            16.1.6.3. Profitability by Market Segments

            16.1.6.4. Sales Footprint

            16.1.6.5. Strategy Overview

                16.1.6.5.1. Marketing Strategy

        16.1.7. R. R. Donnelley & Sons Company

            16.1.7.1. Overview

            16.1.7.2. Product Portfolio

            16.1.7.3. Profitability by Market Segments

            16.1.7.4. Sales Footprint

            16.1.7.5. Strategy Overview

                16.1.7.5.1. Marketing Strategy

        16.1.8. Stora Enso

            16.1.8.1. Overview

            16.1.8.2. Product Portfolio

            16.1.8.3. Profitability by Market Segments

            16.1.8.4. Sales Footprint

            16.1.8.5. Strategy Overview

                16.1.8.5.1. Marketing Strategy

        16.1.9. Sysco Corporation

            16.1.9.1. Overview

            16.1.9.2. Product Portfolio

            16.1.9.3. Profitability by Market Segments

            16.1.9.4. Sales Footprint

            16.1.9.5. Strategy Overview

                16.1.9.5.1. Marketing Strategy

        16.1.10. Zebra Technologies Corp

            16.1.10.1. Overview

            16.1.10.2. Product Portfolio

            16.1.10.3. Profitability by Market Segments

            16.1.10.4. Sales Footprint

            16.1.10.5. Strategy Overview

                16.1.10.5.1. Marketing Strategy

17. Assumptions & Acronyms Used

18. Research Methodology

List of Tables

Table 1: Global Market Value (US$ Million) Forecast by Region, 2018 to 2033

Table 2: Global Market Value (US$ Million) Forecast by Type, 2018 to 2033

Table 3: Global Market Value (US$ Million) Forecast by End-user, 2018 to 2033

Table 4: Global Market Value (US$ Million) Forecast by Material, 2018 to 2033

Table 5: North America Market Value (US$ Million) Forecast by Country, 2018 to 2033

Table 6: North America Market Value (US$ Million) Forecast by Type, 2018 to 2033

Table 7: North America Market Value (US$ Million) Forecast by End-user, 2018 to 2033

Table 8: North America Market Value (US$ Million) Forecast by Material, 2018 to 2033

Table 9: Latin America Market Value (US$ Million) Forecast by Country, 2018 to 2033

Table 10: Latin America Market Value (US$ Million) Forecast by Type, 2018 to 2033

Table 11: Latin America Market Value (US$ Million) Forecast by End-user, 2018 to 2033

Table 12: Latin America Market Value (US$ Million) Forecast by Material, 2018 to 2033

Table 13: Europe Market Value (US$ Million) Forecast by Country, 2018 to 2033

Table 14: Europe Market Value (US$ Million) Forecast by Type, 2018 to 2033

Table 15: Europe Market Value (US$ Million) Forecast by End-user, 2018 to 2033

Table 16: Europe Market Value (US$ Million) Forecast by Material, 2018 to 2033

Table 17: Asia Pacific Market Value (US$ Million) Forecast by Country, 2018 to 2033

Table 18: Asia Pacific Market Value (US$ Million) Forecast by Type, 2018 to 2033

Table 19: Asia Pacific Market Value (US$ Million) Forecast by End-user, 2018 to 2033

Table 20: Asia Pacific Market Value (US$ Million) Forecast by Material, 2018 to 2033

Table 21: MEA Market Value (US$ Million) Forecast by Country, 2018 to 2033

Table 22: MEA Market Value (US$ Million) Forecast by Type, 2018 to 2033

Table 23: MEA Market Value (US$ Million) Forecast by End-user, 2018 to 2033

Table 24: MEA Market Value (US$ Million) Forecast by Material, 2018 to 2033

List of Charts

Figure 1: Global Market Value (US$ Million) by Type, 2023 to 2033

Figure 2: Global Market Value (US$ Million) by End-user, 2023 to 2033

Figure 3: Global Market Value (US$ Million) by Material, 2023 to 2033

Figure 4: Global Market Value (US$ Million) by Region, 2023 to 2033

Figure 5: Global Market Value (US$ Million) Analysis by Region, 2018 to 2033

Figure 6: Global Market Value Share (%) and BPS Analysis by Region, 2023 to 2033

Figure 7: Global Market Y-o-Y Growth (%) Projections by Region, 2023 to 2033

Figure 8: Global Market Value (US$ Million) Analysis by Type, 2018 to 2033

Figure 9: Global Market Value Share (%) and BPS Analysis by Type, 2023 to 2033

Figure 10: Global Market Y-o-Y Growth (%) Projections by Type, 2023 to 2033

Figure 11: Global Market Value (US$ Million) Analysis by End-user, 2018 to 2033

Figure 12: Global Market Value Share (%) and BPS Analysis by End-user, 2023 to 2033

Figure 13: Global Market Y-o-Y Growth (%) Projections by End-user, 2023 to 2033

Figure 14: Global Market Value (US$ Million) Analysis by Material, 2018 to 2033

Figure 15: Global Market Value Share (%) and BPS Analysis by Material, 2023 to 2033

Figure 16: Global Market Y-o-Y Growth (%) Projections by Material, 2023 to 2033

Figure 17: Global Market Attractiveness by Type, 2023 to 2033

Figure 18: Global Market Attractiveness by End-user, 2023 to 2033

Figure 19: Global Market Attractiveness by Material, 2023 to 2033

Figure 20: Global Market Attractiveness by Region, 2023 to 2033

Figure 21: North America Market Value (US$ Million) by Type, 2023 to 2033

Figure 22: North America Market Value (US$ Million) by End-user, 2023 to 2033

Figure 23: North America Market Value (US$ Million) by Material, 2023 to 2033

Figure 24: North America Market Value (US$ Million) by Country, 2023 to 2033

Figure 25: North America Market Value (US$ Million) Analysis by Country, 2018 to 2033

Figure 26: North America Market Value Share (%) and BPS Analysis by Country, 2023 to 2033

Figure 27: North America Market Y-o-Y Growth (%) Projections by Country, 2023 to 2033

Figure 28: North America Market Value (US$ Million) Analysis by Type, 2018 to 2033

Figure 29: North America Market Value Share (%) and BPS Analysis by Type, 2023 to 2033

Figure 30: North America Market Y-o-Y Growth (%) Projections by Type, 2023 to 2033

Figure 31: North America Market Value (US$ Million) Analysis by End-user, 2018 to 2033

Figure 32: North America Market Value Share (%) and BPS Analysis by End-user, 2023 to 2033

Figure 33: North America Market Y-o-Y Growth (%) Projections by End-user, 2023 to 2033

Figure 34: North America Market Value (US$ Million) Analysis by Material, 2018 to 2033

Figure 35: North America Market Value Share (%) and BPS Analysis by Material, 2023 to 2033

Figure 36: North America Market Y-o-Y Growth (%) Projections by Material, 2023 to 2033

Figure 37: North America Market Attractiveness by Type, 2023 to 2033

Figure 38: North America Market Attractiveness by End-user, 2023 to 2033

Figure 39: North America Market Attractiveness by Material, 2023 to 2033

Figure 40: North America Market Attractiveness by Country, 2023 to 2033

Figure 41: Latin America Market Value (US$ Million) by Type, 2023 to 2033

Figure 42: Latin America Market Value (US$ Million) by End-user, 2023 to 2033

Figure 43: Latin America Market Value (US$ Million) by Material, 2023 to 2033

Figure 44: Latin America Market Value (US$ Million) by Country, 2023 to 2033

Figure 45: Latin America Market Value (US$ Million) Analysis by Country, 2018 to 2033

Figure 46: Latin America Market Value Share (%) and BPS Analysis by Country, 2023 to 2033

Figure 47: Latin America Market Y-o-Y Growth (%) Projections by Country, 2023 to 2033

Figure 48: Latin America Market Value (US$ Million) Analysis by Type, 2018 to 2033

Figure 49: Latin America Market Value Share (%) and BPS Analysis by Type, 2023 to 2033

Figure 50: Latin America Market Y-o-Y Growth (%) Projections by Type, 2023 to 2033

Figure 51: Latin America Market Value (US$ Million) Analysis by End-user, 2018 to 2033

Figure 52: Latin America Market Value Share (%) and BPS Analysis by End-user, 2023 to 2033

Figure 53: Latin America Market Y-o-Y Growth (%) Projections by End-user, 2023 to 2033

Figure 54: Latin America Market Value (US$ Million) Analysis by Material, 2018 to 2033

Figure 55: Latin America Market Value Share (%) and BPS Analysis by Material, 2023 to 2033

Figure 56: Latin America Market Y-o-Y Growth (%) Projections by Material, 2023 to 2033

Figure 57: Latin America Market Attractiveness by Type, 2023 to 2033

Figure 58: Latin America Market Attractiveness by End-user, 2023 to 2033

Figure 59: Latin America Market Attractiveness by Material, 2023 to 2033

Figure 60: Latin America Market Attractiveness by Country, 2023 to 2033

Figure 61: Europe Market Value (US$ Million) by Type, 2023 to 2033

Figure 62: Europe Market Value (US$ Million) by End-user, 2023 to 2033

Figure 63: Europe Market Value (US$ Million) by Material, 2023 to 2033

Figure 64: Europe Market Value (US$ Million) by Country, 2023 to 2033

Figure 65: Europe Market Value (US$ Million) Analysis by Country, 2018 to 2033

Figure 66: Europe Market Value Share (%) and BPS Analysis by Country, 2023 to 2033

Figure 67: Europe Market Y-o-Y Growth (%) Projections by Country, 2023 to 2033

Figure 68: Europe Market Value (US$ Million) Analysis by Type, 2018 to 2033

Figure 69: Europe Market Value Share (%) and BPS Analysis by Type, 2023 to 2033

Figure 70: Europe Market Y-o-Y Growth (%) Projections by Type, 2023 to 2033

Figure 71: Europe Market Value (US$ Million) Analysis by End-user, 2018 to 2033

Figure 72: Europe Market Value Share (%) and BPS Analysis by End-user, 2023 to 2033

Figure 73: Europe Market Y-o-Y Growth (%) Projections by End-user, 2023 to 2033

Figure 74: Europe Market Value (US$ Million) Analysis by Material, 2018 to 2033

Figure 75: Europe Market Value Share (%) and BPS Analysis by Material, 2023 to 2033

Figure 76: Europe Market Y-o-Y Growth (%) Projections by Material, 2023 to 2033

Figure 77: Europe Market Attractiveness by Type, 2023 to 2033

Figure 78: Europe Market Attractiveness by End-user, 2023 to 2033

Figure 79: Europe Market Attractiveness by Material, 2023 to 2033

Figure 80: Europe Market Attractiveness by Country, 2023 to 2033

Figure 81: Asia Pacific Market Value (US$ Million) by Type, 2023 to 2033

Figure 82: Asia Pacific Market Value (US$ Million) by End-user, 2023 to 2033

Figure 83: Asia Pacific Market Value (US$ Million) by Material, 2023 to 2033

Figure 84: Asia Pacific Market Value (US$ Million) by Country, 2023 to 2033

Figure 85: Asia Pacific Market Value (US$ Million) Analysis by Country, 2018 to 2033

Figure 86: Asia Pacific Market Value Share (%) and BPS Analysis by Country, 2023 to 2033

Figure 87: Asia Pacific Market Y-o-Y Growth (%) Projections by Country, 2023 to 2033

Figure 88: Asia Pacific Market Value (US$ Million) Analysis by Type, 2018 to 2033

Figure 89: Asia Pacific Market Value Share (%) and BPS Analysis by Type, 2023 to 2033

Figure 90: Asia Pacific Market Y-o-Y Growth (%) Projections by Type, 2023 to 2033

Figure 91: Asia Pacific Market Value (US$ Million) Analysis by End-user, 2018 to 2033

Figure 92: Asia Pacific Market Value Share (%) and BPS Analysis by End-user, 2023 to 2033

Figure 93: Asia Pacific Market Y-o-Y Growth (%) Projections by End-user, 2023 to 2033

Figure 94: Asia Pacific Market Value (US$ Million) Analysis by Material, 2018 to 2033

Figure 95: Asia Pacific Market Value Share (%) and BPS Analysis by Material, 2023 to 2033

Figure 96: Asia Pacific Market Y-o-Y Growth (%) Projections by Material, 2023 to 2033

Figure 97: Asia Pacific Market Attractiveness by Type, 2023 to 2033

Figure 98: Asia Pacific Market Attractiveness by End-user, 2023 to 2033

Figure 99: Asia Pacific Market Attractiveness by Material, 2023 to 2033

Figure 100: Asia Pacific Market Attractiveness by Country, 2023 to 2033

Figure 101: MEA Market Value (US$ Million) by Type, 2023 to 2033

Figure 102: MEA Market Value (US$ Million) by End-user, 2023 to 2033

Figure 103: MEA Market Value (US$ Million) by Material, 2023 to 2033

Figure 104: MEA Market Value (US$ Million) by Country, 2023 to 2033

Figure 105: MEA Market Value (US$ Million) Analysis by Country, 2018 to 2033

Figure 106: MEA Market Value Share (%) and BPS Analysis by Country, 2023 to 2033

Figure 107: MEA Market Y-o-Y Growth (%) Projections by Country, 2023 to 2033

Figure 108: MEA Market Value (US$ Million) Analysis by Type, 2018 to 2033

Figure 109: MEA Market Value Share (%) and BPS Analysis by Type, 2023 to 2033

Figure 110: MEA Market Y-o-Y Growth (%) Projections by Type, 2023 to 2033

Figure 111: MEA Market Value (US$ Million) Analysis by End-user, 2018 to 2033

Figure 112: MEA Market Value Share (%) and BPS Analysis by End-user, 2023 to 2033

Figure 113: MEA Market Y-o-Y Growth (%) Projections by End-user, 2023 to 2033

Figure 114: MEA Market Value (US$ Million) Analysis by Material, 2018 to 2033

Figure 115: MEA Market Value Share (%) and BPS Analysis by Material, 2023 to 2033

Figure 116: MEA Market Y-o-Y Growth (%) Projections by Material, 2023 to 2033

Figure 117: MEA Market Attractiveness by Type, 2023 to 2033

Figure 118: MEA Market Attractiveness by End-user, 2023 to 2033

Figure 119: MEA Market Attractiveness by Material, 2023 to 2033

Figure 120: MEA Market Attractiveness by Country, 2023 to 2033

Recommendations

Packaging

Smart Tag Packaging Market

Published : October 2022

Packaging

Biodegradable Packaging Market

Published : September 2022

Explore Packaging Insights

View Reports