Reports

- Global Locations -

Headquarters

Future Market Insights, Inc.

Christiana Corporate, 200
Continental Drive, Suite 401,
Newark, Delaware - 19713,
United States

T: +1-845-579-5705

Americas

Future Market Insights, Inc.

616 Corporate Way, Suite 2-9018,
Valley Cottage, NY 10989, United States

T: +1-347-918-3531

MEA

Future Market Insights

1602-6 Jumeirah Bay X2 Tower, Plot No: JLT-PH2-X2A,
Jumeirah Lakes Towers, Dubai,
United Arab Emirates

Europe

Future Market Insights

3rd Floor, 207 Regent Street,
W1B 3HH London
United Kingdom

T: + 44 (0) 20 8123 9659
D: +44 (0) 20 3287 4268

Asia Pacific

Future Market Insights

IndiaLand Global Tech Park, Unit UG-1, Behind Grand HighStreet, Phase 1, Hinjawadi, MH, Pune – 411057, India

Smart Air Purifiers Market Outlook (2023 to 2033)

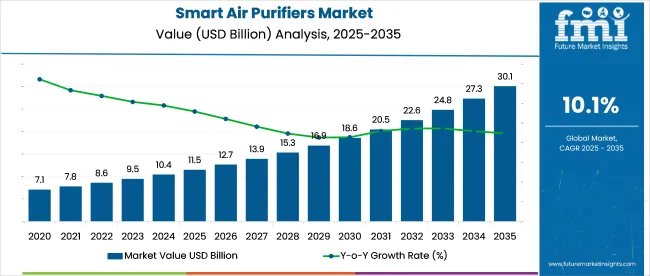
The smart air purifiers market size is anticipated to be worth US$ 9.5 billion in 2023. By 2033, the market is anticipated to reach US$ 24.8 billion at a CAGR of 10.1%. The smart air purifiers industry is experiencing a surge in demand and popularity, driven by several key factors. The increasing awareness about the detrimental effects of indoor air pollution on health has led to a growing interest in smart air purifiers. Consumers are actively seeking technologically advanced solutions that can provide efficient air purification and real-time monitoring of air quality. The integration of smart features like Wi-Fi connectivity, voice control, and app compatibility has further enhanced the appeal of these devices. As the focus on health and well-being intensifies, the demand for smart air purifiers is expected to skyrocket.
While the smart air purifiers industry presents significant opportunities, it also poses certain challenges for companies and manufacturers. The market is becoming increasingly competitive, with numerous players vying for market share. Differentiating products and establishing brand recognition in a crowded marketplace can be demanding. Additionally, ensuring product quality, reliability, and effective marketing strategies are vital to gain consumer trust and loyalty.

Companies need to stay abreast of evolving regulations and standards related to air purification technology. Overcoming these challenges requires innovation, adaptability, and a keen understanding of consumer preferences.

Opportunities in the Smart Air Purifiers Industry:

  • The growing market for smart air purifiers presents investment opportunities for venture capitalists, private equity firms, and individual investors.
  • Strategic partnerships with technology companies can drive innovation and open new distribution channels.
  • Investing in research and development to create advanced filtration technologies and improve overall product performance.
  • Exploring global expansion opportunities to tap into emerging markets with high air pollution levels and increasing consumer awareness.
  • Investing in marketing and advertising campaigns to raise brand awareness and capture a larger market share.

Latest Trends in the Smart Air Purifiers Market:

  • Integration with smart home systems and voice assistants, allowing seamless control and monitoring of air purification.
  • Development of portable and compact smart air purifiers for travel and on-the-go use.
  • The use of artificial intelligence and machine learning algorithms to optimize air purification settings based on real-time air quality data.
  • The growing interest in eco-friendly and sustainable smart air purifiers that use energy-efficient technologies and recyclable materials.
  • Increasing customization options, allowing users to personalize air purification settings according to their specific needs and preferences.
Attribute Details
Smart Air Purifiers Market Size (2023) US$ 9.5 billion
Smart Air Purifiers Market Projected Size (2033) US$ 24.8 billion
Value CAGR (2023 to 2033) 10.1%

Don't pay for what you don't need

Customize your report by selecting specific countries or regions and save 30%!

2018 to 2022 Smart Air Purifiers Demand Outlook Compared to 2023 to 2033 Forecast

The demand for smart air purifiers expanded at a CAGR of 10.8 from 2018 to 2022, reaching US$ 9.5 billion in market value in 2023. From 2018 to 2023, the global smart air purifiers market witnessed significant growth and transformation. Advancements in technology and increasing awareness about the importance of clean indoor air quality were key factors driving this expansion. With a combination of short-term and long-term strategies, industry players capitalized on the rising demand for smart air purifiers, integrating features like Wi-Fi connectivity, advanced sensors, and smart filtration systems. As a result, the market experienced a steady surge in sales and revenue, achieving noteworthy milestones.

Future Forecast for Smart Air Purifiers Industry:

From 2023 to 2033, the global smart air purifiers industry is anticipated to expand at a CAGR of 10.1%. The market size is anticipated to reach US$ 24.8 billion during the projected period. As environmental concerns intensify and consumers become increasingly health-conscious, the demand for smart air purifiers is anticipated to continue to soar. Technological advancements are likely to drive innovation, leading to the development of smarter and more efficient products that cater to specific consumer needs. The integration of artificial intelligence, machine learning algorithms, and advanced data analytics is projected to enhance the capabilities of smart air purifiers, delivering personalized and targeted air purification solutions.

Comparative View of the Smart Air Purifiers Market

Smart Air Purifiers Market:

Attributes Smart Air Purifiers Market
CAGR (2023 to 2033) 10.1%
Market Value (2033) US$ 24.8 billion
Opportunity Growing consumer demand for technologically advanced and efficient indoor air purification solutions.
Key Trends Integration of smart features like Wi-Fi connectivity and voice control, enhancing convenience and user experience.

Air Purifier Market:

Attributes Air Purifier Market
CAGR (2023 to 2033) 7.7%
Market Value (2033) US$ 28.21 billion
Opportunity Increasing awareness of the importance of clean air and the rising prevalence of respiratory conditions are driving the demand for air purifiers.
Key Trends Adoption of advanced filtration technologies, such as HEPA filters and activated carbon, for improved air purification efficiency.

Air Freshener Market:

Attributes Air Freshener Market
CAGR (2023 to 2033) 3.5%
Market Value (2033) US$ 18 billion
Opportunity Rising consumers focus on maintaining pleasant and refreshing indoor environments, driving the demand for air fresheners.
Key Trends Shift towards natural and eco-friendly air freshener options, leveraging organic ingredients and sustainable packaging.
Sudip Saha
Sudip Saha

Principal Consultant

Talk to Analyst

Find your sweet spots for generating winning opportunities in this market.

Country-Wise Insights

How Manufacturers Are Redefining Clean Air with Smart Air Purifiers in the United States?

Country United States
Market Size (US$ million) by End of Forecast Period (2033) US$ 4.2 billion
CAGR % 2023 to End of Forecast (2033) 10.0%

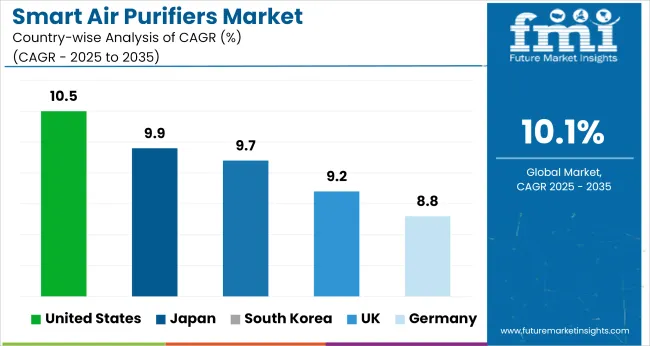
The smart air purifiers market in the United States is projected to reach a value of US$ 4.2 billion by 2033, with a promising CAGR of 10.0% from 2023 to 2033. The United States boasts a technologically advanced market, driven by a strong focus on innovation and technological integration. The demand for smart air purifiers is propelled by rising awareness of indoor air quality and health concerns. Factors such as high disposable income, evolving consumer preferences, and increasing adoption of smart home systems contribute to the market's substantial value share.

United Kingdom Smart Air Purifiers Industry

Country United Kingdom
Market Size (US$ million) by End of Forecast Period (2033) US$ 923.2 million
CAGR % 2023 to End of Forecast (2033) 9.8%

The smart air purifiers market in the United Kingdom is expected to reach US$ 923.2 million by 2033, exhibiting a commendable CAGR of 9.8% from 2023 to 2033. The United Kingdom witnesses a growing demand for smart air purifiers, driven by factors such as a greater emphasis on environmental sustainability, awareness of air pollution issues, and increasing health consciousness. The market is characterized by the presence of key players offering innovative products with advanced features. Additionally, government initiatives promoting cleaner air contribute to the market's notable value share.

China Smart Air Purifiers Industry

Country China
Market Size (US$ million) by End of Forecast Period (2033) US$ 5.8 billion
CAGR % 2023 to End of Forecast (2033) 9.9%

The smart air purifiers market in China is anticipated to reach a valuation of US$ 5.8 billion by 2033, with a steady CAGR of 9.9% from 2023 to 2033. China's robust market growth can be attributed to factors like rapid urbanization, worsening air pollution levels, and a growing middle-class population. Increasing consumer awareness regarding the importance of air quality and the adoption of smart technologies fuel the demand for smart air purifiers. Key market players are leveraging these opportunities, strengthening their market share by introducing advanced products, and expanding their distribution networks across the region.

Rising Demand for Air Purification Solutions Drives Japan Market Growth

Country Japan
Market Size (US$ million) by End of Forecast Period (2033) US$ 3.6 billion
CAGR % 2023 to End of Forecast (2033) 9.9%

The smart air purifiers market in Japan is expected to reach US$ 3.6 billion by 2033, exhibiting a noteworthy CAGR of 9.9% from 2023 to 2033. Japan's market showcases a strong inclination towards innovative and high-quality products. With a well-established consumer electronics industry and a culture that values cleanliness and well-being, the demand for smart air purifiers continues to rise. Increasing health concerns, a technologically savvy population, and government initiatives promoting clean air contribute to the market's substantial value share.

How are Smart Air Purifiers Manufacturers Clearing the Path to Healthier Environments in South Korea?

Country South Korea
Market Size (US$ million) by End of Forecast Period (2033) US$ 1.2 billion
CAGR % 2023 to End of Forecast (2033) 9.7%

The smart air purifiers market in South Korea is projected to reach a value of US$ 1.2 billion by 2033, with a promising CAGR of 9.7% from 2023 to 2033. South Korea witnesses a growing consumer preference for smart air purifiers, driven by factors such as increasing health consciousness, rising urbanization, and concerns about fine dust pollution. The market is characterized by the presence of both local and international players offering a diverse range of smart air purifiers. Partnerships with technology companies and strategic marketing initiatives play a crucial role in capturing the market's significant value share.

Category-Wise Insights

Dust Collectors Segment to Lead the Market with a CAGR of 5.9% Through 2033

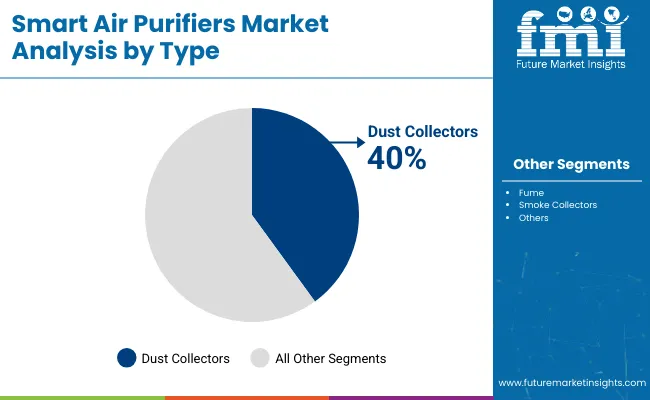
The dominating segment in the smart air purifier industry is dust collectors. With a notable CAGR of 5.9% from 2023 to 2033, this segment plays a crucial role in ensuring clean indoor air. In 2023, Dust Collectors held a significant market share, capturing the attention of consumers seeking the effective removal of dust particles from their living spaces. The key factor driving the dominance of this segment is the increasing awareness of the health hazards associated with airborne dust particles. Dust Collectors offer efficient filtration mechanisms that effectively trap and remove dust, providing a cleaner and healthier environment for users.

Dominating Technique Segment: High-Efficiency Particulate Air (HEPA)

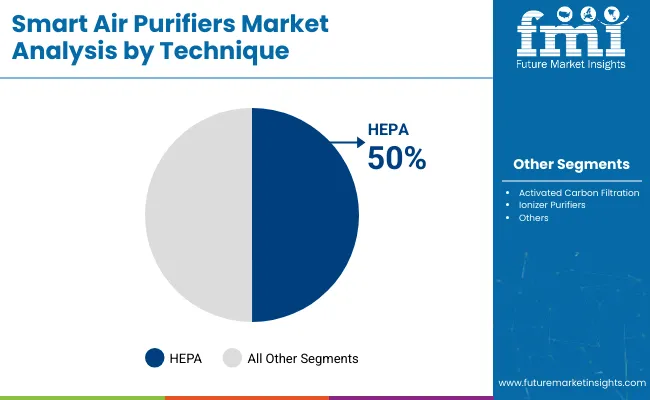
The dominating segment in terms of technique is High-Efficiency Particulate Air (HEPA). With a CAGR of 5.7% from 2023 to 2033, HEPA technology sets the benchmark for air purification excellence. In 2023, this segment claimed a significant market share, driven by its unparalleled efficiency in removing airborne particles, allergens, and pollutants. HEPA filters are capable of capturing particles as small as 0.3 microns with a high level of effectiveness, making them highly sought after by consumers concerned about air quality. The dominance of the HEPA segment is further fueled by increasing awareness of respiratory health issues and the need for superior air filtration solutions.

Get the data you need at a Fraction of the cost

Personalize your report by choosing insights you need
and save 40%!

How Key Players Stay Competitive in the Smart Air Purifiers Industry?

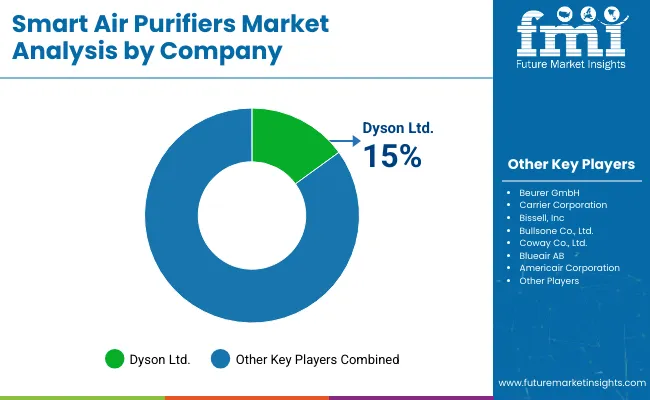
In the fiercely competitive smart air purifiers industry, key players are leaving no stone unturned to maintain their position at the top. These industry leaders understand the importance of innovation, product differentiation, and strategic partnerships. By continuously investing in research and development, they strive to offer cutting-edge technologies and advanced features that cater to evolving consumer needs. Moreover, these players focus on building strong brand recognition, expanding their distribution networks, and providing exceptional customer service to gain a competitive edge. By staying at the forefront of the industry trends, these key players position themselves as market leaders, constantly pushing the boundaries of air purification technology.

Despite their market dominance, key players in the smart air purifiers industry face several challenges that demand their attention. One of the primary challenges is the increasing competition from both established and new market entrants. This intensified competition prompts companies to continuously innovate, improve their product offerings, and differentiate themselves in terms of design, performance, and functionality.

Key Players in the Smart Air Purifiers Industry

  • Beurer GmbH
  • Carrier Corporation
  • Bissell, Inc.
  • Airgle Corporation
  • Bullsone Co., Ltd.

How can Manufacturers/Service Providers Scale their Businesses in the Smart Air Purifiers Market?

Scaling Strategies in the Smart Air Purifiers Market

Enhance Product Portfolio
  • Continuously invest in research and development to improve existing products and introduce new, innovative smart air purifiers that meet evolving customer needs.
  • Incorporate advanced technologies such as Internet of Things (IoT) integration, smart home compatibility, and mobile app control to offer enhanced user experiences and convenience.
  • Develop specialized models for different target markets, such as compact and portable purifiers for travelers or large-capacity units for commercial spaces.
Strengthen Distribution Channels
  • Establish partnerships with reputable retailers, both online and offline, to expand market reach and accessibility to customers.
  • Explore collaborations with e-commerce platforms and home appliance distributors to leverage their existing networks and customer bases.
  • Develop a strong online presence through an e-commerce website and effective digital marketing strategies to capture the growing online consumer segment.
Focus on Marketing and Branding
  • Build a strong brand identity by emphasizing product quality, reliability, and effectiveness in purifying indoor air.
  • Implement targeted marketing campaigns that highlight the unique features, benefits, and value propositions of smart air purifiers.
  • Utilize social media platforms and influencer collaborations to create awareness and engage with potential customers.
Embrace Customer-centric Approach
  • Gather customer feedback and conduct market research to understand their preferences and pain points and incorporate these insights into product development and improvement processes.
  • Provide exceptional customer service and support to build trust and loyalty among customers.
  • Offer warranties, extended service contracts, and easy product returns to enhance customer satisfaction and confidence in the brand.
Foster Partnerships and Alliances
  • Collaborate with technology companies to integrate smart air purifiers with home automation systems and voice assistants for seamless integration and enhanced functionality.
  • Partner with indoor air quality monitoring companies to offer comprehensive solutions that combine monitoring and purification capabilities.
  • Form strategic alliances with HVAC (Heating, Ventilation, and Air Conditioning) companies to offer bundled solutions that provide both air purification and temperature control.

Key Developments in the Smart Air Purifiers Market

  • Beurer GmbH has introduced smart air purifiers with advanced features such as Wi-Fi connectivity, mobile app control, and compatibility with smart home systems. These features allow users to remotely monitor and control the air purifiers, adjust settings, and access real-time air quality data.
  • Carrier Corporation has focused on developing air purifiers with advanced filtration technologies. Their products feature HEPA filters and UV-C light sterilization systems, providing high-quality air purification to remove allergens, bacteria, and viruses from indoor spaces.
  • Bissell, Inc. has made significant advancements in the smart air purifier market by incorporating innovative technologies. Their products feature sensors that detect changes in air quality and automatically adjust purification settings for optimal performance. Additionally, their air purifiers are equipped with user-friendly interfaces and intuitive controls for easy operation.

Segmentation Analysis of the Smart Air Purifiers Market

By Type:

  • Dust Collectors
  • Fume & Smoke Collectors
  • Others

By Technique:

  • High-Efficiency Particulate Air (HEPA)
  • Activated Carbon Filtration
  • Ionizer Purifiers
  • Others

By End-use:

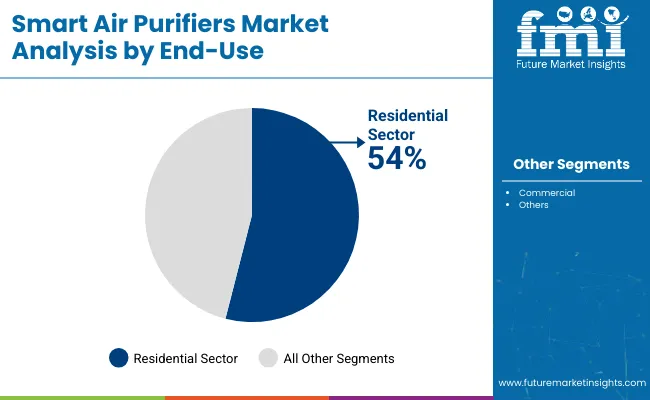
  • Residential
  • Commercial
  • Others

By Region:

  • North America
  • Latin America
  • Europe
  • East Asia
  • South Asia
  • Oceania
  • Middle East & Africa

Frequently Asked Questions

What is the size of the smart air purifier market?

The global smart air purifier market is projected to reach US$ 24.8 billion by 2033, growing at a CAGR of 10.1% from 2023 to 2033.

Who are the key players in the smart air purifier market?

The key players in the smart air purifier market are Sharp Corporation, Dyson Limited, Xiaomi Corporation, Honeywell International, Inc., and Coway Co., Ltd.

What are the factors driving the growth of the smart air purifier market?

The factors driving the growth of the smart air purifier market are increasing awareness of air pollution, growing demand for connected devices, and rising disposable incomes.

What are the different types of smart air purifiers available in the market?

The different types of smart air purifiers available in the market are HEPA air purifiers, activated carbon air purifiers, and ionizer air purifiers.

What are the benefits of using a smart air purifier?

The benefits of using a smart air purifier include improved indoor air quality, reduced allergens and pollutants, and better respiratory health.

Table of Content

1. Executive Summary

    1.1. Global Market Outlook

    1.2. Demand-side Trends

    1.3. Supply-side Trends

    1.4. Technology Roadmap Analysis

    1.5. Analysis and Recommendations

2. Market Overview

    2.1. Market Coverage / Taxonomy

    2.2. Market Definition / Scope / Limitations

3. Market Background

    3.1. Market Dynamics

        3.1.1. Drivers

        3.1.2. Restraints

        3.1.3. Opportunity

        3.1.4. Trends

    3.2. Scenario Forecast

        3.2.1. Demand in Optimistic Scenario

        3.2.2. Demand in Likely Scenario

        3.2.3. Demand in Conservative Scenario

    3.3. Opportunity Map Analysis

    3.4. Product Life Cycle Analysis

    3.5. Supply Chain Analysis

        3.5.1. Supply Side Participants and Their Roles

            3.5.1.1. Producers

            3.5.1.2. Mid-Level Participants (Traders/ Agents/ Brokers)

            3.5.1.3. Wholesalers and Distributors

        3.5.2. Value Added and Value Created at Node in the Supply Chain

        3.5.3. List of Raw Material Suppliers

        3.5.4. List of Existing and Potential Buyers

    3.6. Investment Feasibility Matrix

    3.7. Value Chain Analysis

        3.7.1. Profit Margin Analysis

        3.7.2. Wholesalers and Distributors

        3.7.3. Retailers

    3.8. PESTLE and Porter’s Analysis

    3.9. Regulatory Landscape

        3.9.1. By Key Regions

        3.9.2. By Key Countries

    3.10. Regional Parent Market Outlook

    3.11. Production and Consumption Statistics

    3.12. Import and Export Statistics

4. Global Market Analysis 2018 to 2022 and Forecast, 2023 to 2033

    4.1. Historical Market Size Value (US$ Million) & Volume (Units) Analysis, 2018 to 2022

    4.2. Current and Future Market Size Value (US$ Million) & Volume (Units) Projections, 2023 to 2033

        4.2.1. Y-o-Y Growth Trend Analysis

        4.2.2. Absolute $ Opportunity Analysis

5. Global Market Analysis 2018 to 2022 and Forecast 2023 to 2033, By Type

    5.1. Introduction / Key Findings

    5.2. Historical Market Size Value (US$ Million) & Volume (Units) Analysis By Type, 2018 to 2022

    5.3. Current and Future Market Size Value (US$ Million) & Volume (Units) Analysis and Forecast By Type, 2023 to 2033

        5.3.1. Dust Collectors

        5.3.2. Fume & Smoke Collectors

        5.3.3. Others

    5.4. Y-o-Y Growth Trend Analysis By Type, 2018 to 2022

    5.5. Absolute $ Opportunity Analysis By Type, 2023 to 2033

6. Global Market Analysis 2018 to 2022 and Forecast 2023 to 2033, By Technique

    6.1. Introduction / Key Findings

    6.2. Historical Market Size Value (US$ Million) & Volume (Units) Analysis By Technique, 2018 to 2022

    6.3. Current and Future Market Size Value (US$ Million) & Volume (Units) Analysis and Forecast By Technique, 2023 to 2033

        6.3.1. High-Efficiency Particulate Air (HEPA)

        6.3.2. Activated Carbon Filtration

        6.3.3. Ionizer Purifiers

        6.3.4. Others

    6.4. Y-o-Y Growth Trend Analysis By Technique, 2018 to 2022

    6.5. Absolute $ Opportunity Analysis By Technique, 2023 to 2033

7. Global Market Analysis 2018 to 2022 and Forecast 2023 to 2033, By End-Use

    7.1. Introduction / Key Findings

    7.2. Historical Market Size Value (US$ Million) & Volume (Units) Analysis By End-Use, 2018 to 2022

    7.3. Current and Future Market Size Value (US$ Million) & Volume (Units) Analysis and Forecast By End-Use, 2023 to 2033

        7.3.1. Residential

        7.3.2. Commercial

        7.3.3. Others

    7.4. Y-o-Y Growth Trend Analysis By End-Use, 2018 to 2022

    7.5. Absolute $ Opportunity Analysis By End-Use, 2023 to 2033

8. Global Market Analysis 2018 to 2022 and Forecast 2023 to 2033, By Region

    8.1. Introduction

    8.2. Historical Market Size Value (US$ Million) & Volume (Units) Analysis By Region, 2018 to 2022

    8.3. Current Market Size Value (US$ Million) & Volume (Units) Analysis and Forecast By Region, 2023 to 2033

        8.3.1. North America

        8.3.2. Latin America

        8.3.3. Europe

        8.3.4. Asia Pacific

        8.3.5. MEA

    8.4. Market Attractiveness Analysis By Region

9. North America Market Analysis 2018 to 2022 and Forecast 2023 to 2033, By Country

    9.1. Historical Market Size Value (US$ Million) & Volume (Units) Trend Analysis By Market Taxonomy, 2018 to 2022

    9.2. Market Size Value (US$ Million) & Volume (Units) Forecast By Market Taxonomy, 2023 to 2033

        9.2.1. By Country

            9.2.1.1. USA

            9.2.1.2. Canada

        9.2.2. By Type

        9.2.3. By Technique

        9.2.4. By End-Use

    9.3. Market Attractiveness Analysis

        9.3.1. By Country

        9.3.2. By Type

        9.3.3. By Technique

        9.3.4. By End-Use

    9.4. Key Takeaways

10. Latin America Market Analysis 2018 to 2022 and Forecast 2023 to 2033, By Country

    10.1. Historical Market Size Value (US$ Million) & Volume (Units) Trend Analysis By Market Taxonomy, 2018 to 2022

    10.2. Market Size Value (US$ Million) & Volume (Units) Forecast By Market Taxonomy, 2023 to 2033

        10.2.1. By Country

            10.2.1.1. Brazil

            10.2.1.2. Mexico

            10.2.1.3. Rest of Latin America

        10.2.2. By Type

        10.2.3. By Technique

        10.2.4. By End-Use

    10.3. Market Attractiveness Analysis

        10.3.1. By Country

        10.3.2. By Type

        10.3.3. By Technique

        10.3.4. By End-Use

    10.4. Key Takeaways

11. Europe Market Analysis 2018 to 2022 and Forecast 2023 to 2033, By Country

    11.1. Historical Market Size Value (US$ Million) & Volume (Units) Trend Analysis By Market Taxonomy, 2018 to 2022

    11.2. Market Size Value (US$ Million) & Volume (Units) Forecast By Market Taxonomy, 2023 to 2033

        11.2.1. By Country

            11.2.1.1. Germany

            11.2.1.2. UK

            11.2.1.3. France

            11.2.1.4. Spain

            11.2.1.5. Italy

            11.2.1.6. Rest of Europe

        11.2.2. By Type

        11.2.3. By Technique

        11.2.4. By End-Use

    11.3. Market Attractiveness Analysis

        11.3.1. By Country

        11.3.2. By Type

        11.3.3. By Technique

        11.3.4. By End-Use

    11.4. Key Takeaways

12. Asia Pacific Market Analysis 2018 to 2022 and Forecast 2023 to 2033, By Country

    12.1. Historical Market Size Value (US$ Million) & Volume (Units) Trend Analysis By Market Taxonomy, 2018 to 2022

    12.2. Market Size Value (US$ Million) & Volume (Units) Forecast By Market Taxonomy, 2023 to 2033

        12.2.1. By Country

            12.2.1.1. China

            12.2.1.2. Japan

            12.2.1.3. South Korea

            12.2.1.4. Singapore

            12.2.1.5. Thailand

            12.2.1.6. Indonesia

            12.2.1.7. Australia

            12.2.1.8. New Zealand

            12.2.1.9. Rest of Asia Pacific

        12.2.2. By Type

        12.2.3. By Technique

        12.2.4. By End-Use

    12.3. Market Attractiveness Analysis

        12.3.1. By Country

        12.3.2. By Type

        12.3.3. By Technique

        12.3.4. By End-Use

    12.4. Key Takeaways

13. MEA Market Analysis 2018 to 2022 and Forecast 2023 to 2033, By Country

    13.1. Historical Market Size Value (US$ Million) & Volume (Units) Trend Analysis By Market Taxonomy, 2018 to 2022

    13.2. Market Size Value (US$ Million) & Volume (Units) Forecast By Market Taxonomy, 2023 to 2033

        13.2.1. By Country

            13.2.1.1. GCC Countries

            13.2.1.2. South Africa

            13.2.1.3. Israel

            13.2.1.4. Rest of MEA

        13.2.2. By Type

        13.2.3. By Technique

        13.2.4. By End-Use

    13.3. Market Attractiveness Analysis

        13.3.1. By Country

        13.3.2. By Type

        13.3.3. By Technique

        13.3.4. By End-Use

    13.4. Key Takeaways

14. Key Countries Market Analysis

    14.1. USA

        14.1.1. Pricing Analysis

        14.1.2. Market Share Analysis, 2022

            14.1.2.1. By Type

            14.1.2.2. By Technique

            14.1.2.3. By End-Use

    14.2. Canada

        14.2.1. Pricing Analysis

        14.2.2. Market Share Analysis, 2022

            14.2.2.1. By Type

            14.2.2.2. By Technique

            14.2.2.3. By End-Use

    14.3. Brazil

        14.3.1. Pricing Analysis

        14.3.2. Market Share Analysis, 2022

            14.3.2.1. By Type

            14.3.2.2. By Technique

            14.3.2.3. By End-Use

    14.4. Mexico

        14.4.1. Pricing Analysis

        14.4.2. Market Share Analysis, 2022

            14.4.2.1. By Type

            14.4.2.2. By Technique

            14.4.2.3. By End-Use

    14.5. Germany

        14.5.1. Pricing Analysis

        14.5.2. Market Share Analysis, 2022

            14.5.2.1. By Type

            14.5.2.2. By Technique

            14.5.2.3. By End-Use

    14.6. UK

        14.6.1. Pricing Analysis

        14.6.2. Market Share Analysis, 2022

            14.6.2.1. By Type

            14.6.2.2. By Technique

            14.6.2.3. By End-Use

    14.7. France

        14.7.1. Pricing Analysis

        14.7.2. Market Share Analysis, 2022

            14.7.2.1. By Type

            14.7.2.2. By Technique

            14.7.2.3. By End-Use

    14.8. Spain

        14.8.1. Pricing Analysis

        14.8.2. Market Share Analysis, 2022

            14.8.2.1. By Type

            14.8.2.2. By Technique

            14.8.2.3. By End-Use

    14.9. Italy

        14.9.1. Pricing Analysis

        14.9.2. Market Share Analysis, 2022

            14.9.2.1. By Type

            14.9.2.2. By Technique

            14.9.2.3. By End-Use

    14.10. China

        14.10.1. Pricing Analysis

        14.10.2. Market Share Analysis, 2022

            14.10.2.1. By Type

            14.10.2.2. By Technique

            14.10.2.3. By End-Use

    14.11. Japan

        14.11.1. Pricing Analysis

        14.11.2. Market Share Analysis, 2022

            14.11.2.1. By Type

            14.11.2.2. By Technique

            14.11.2.3. By End-Use

    14.12. South Korea

        14.12.1. Pricing Analysis

        14.12.2. Market Share Analysis, 2022

            14.12.2.1. By Type

            14.12.2.2. By Technique

            14.12.2.3. By End-Use

    14.13. Singapore

        14.13.1. Pricing Analysis

        14.13.2. Market Share Analysis, 2022

            14.13.2.1. By Type

            14.13.2.2. By Technique

            14.13.2.3. By End-Use

    14.14. Thailand

        14.14.1. Pricing Analysis

        14.14.2. Market Share Analysis, 2022

            14.14.2.1. By Type

            14.14.2.2. By Technique

            14.14.2.3. By End-Use

    14.15. Indonesia

        14.15.1. Pricing Analysis

        14.15.2. Market Share Analysis, 2022

            14.15.2.1. By Type

            14.15.2.2. By Technique

            14.15.2.3. By End-Use

    14.16. Australia

        14.16.1. Pricing Analysis

        14.16.2. Market Share Analysis, 2022

            14.16.2.1. By Type

            14.16.2.2. By Technique

            14.16.2.3. By End-Use

    14.17. New Zealand

        14.17.1. Pricing Analysis

        14.17.2. Market Share Analysis, 2022

            14.17.2.1. By Type

            14.17.2.2. By Technique

            14.17.2.3. By End-Use

    14.18. GCC Countries

        14.18.1. Pricing Analysis

        14.18.2. Market Share Analysis, 2022

            14.18.2.1. By Type

            14.18.2.2. By Technique

            14.18.2.3. By End-Use

    14.19. South Africa

        14.19.1. Pricing Analysis

        14.19.2. Market Share Analysis, 2022

            14.19.2.1. By Type

            14.19.2.2. By Technique

            14.19.2.3. By End-Use

    14.20. Israel

        14.20.1. Pricing Analysis

        14.20.2. Market Share Analysis, 2022

            14.20.2.1. By Type

            14.20.2.2. By Technique

            14.20.2.3. By End-Use

15. Market Structure Analysis

    15.1. Competition Dashboard

    15.2. Competition Benchmarking

    15.3. Market Share Analysis of Top Players

        15.3.1. By Regional

        15.3.2. By Type

        15.3.3. By Technique

        15.3.4. By End-Use

16. Competition Analysis

    16.1. Competition Deep Dive

        16.1.1. Beurer GmbH

            16.1.1.1. Overview

            16.1.1.2. Product Portfolio

            16.1.1.3. Profitability by Market Segments

            16.1.1.4. Sales Footprint

            16.1.1.5. Strategy Overview

                16.1.1.5.1. Marketing Strategy

                16.1.1.5.2. Product Strategy

                16.1.1.5.3. Channel Strategy

        16.1.2. Carrier Corporation

            16.1.2.1. Overview

            16.1.2.2. Product Portfolio

            16.1.2.3. Profitability by Market Segments

            16.1.2.4. Sales Footprint

            16.1.2.5. Strategy Overview

                16.1.2.5.1. Marketing Strategy

                16.1.2.5.2. Product Strategy

                16.1.2.5.3. Channel Strategy

        16.1.3. Bissell, Inc

            16.1.3.1. Overview

            16.1.3.2. Product Portfolio

            16.1.3.3. Profitability by Market Segments

            16.1.3.4. Sales Footprint

            16.1.3.5. Strategy Overview

                16.1.3.5.1. Marketing Strategy

                16.1.3.5.2. Product Strategy

                16.1.3.5.3. Channel Strategy

        16.1.4. Bullsone Co., Ltd.

            16.1.4.1. Overview

            16.1.4.2. Product Portfolio

            16.1.4.3. Profitability by Market Segments

            16.1.4.4. Sales Footprint

            16.1.4.5. Strategy Overview

                16.1.4.5.1. Marketing Strategy

                16.1.4.5.2. Product Strategy

                16.1.4.5.3. Channel Strategy

        16.1.5. Coway Co., Ltd

            16.1.5.1. Overview

            16.1.5.2. Product Portfolio

            16.1.5.3. Profitability by Market Segments

            16.1.5.4. Sales Footprint

            16.1.5.5. Strategy Overview

                16.1.5.5.1. Marketing Strategy

                16.1.5.5.2. Product Strategy

                16.1.5.5.3. Channel Strategy

        16.1.6. Blueair AB

            16.1.6.1. Overview

            16.1.6.2. Product Portfolio

            16.1.6.3. Profitability by Market Segments

            16.1.6.4. Sales Footprint

            16.1.6.5. Strategy Overview

                16.1.6.5.1. Marketing Strategy

                16.1.6.5.2. Product Strategy

                16.1.6.5.3. Channel Strategy

        16.1.7. Americair Corporation

            16.1.7.1. Overview

            16.1.7.2. Product Portfolio

            16.1.7.3. Profitability by Market Segments

            16.1.7.4. Sales Footprint

            16.1.7.5. Strategy Overview

                16.1.7.5.1. Marketing Strategy

                16.1.7.5.2. Product Strategy

                16.1.7.5.3. Channel Strategy

        16.1.8. Breville Pty., Ltd.

            16.1.8.1. Overview

            16.1.8.2. Product Portfolio

            16.1.8.3. Profitability by Market Segments

            16.1.8.4. Sales Footprint

            16.1.8.5. Strategy Overview

                16.1.8.5.1. Marketing Strategy

                16.1.8.5.2. Product Strategy

                16.1.8.5.3. Channel Strategy

        16.1.9. Arovast Corporation (Levoit); Awair Inc

            16.1.9.1. Overview

            16.1.9.2. Product Portfolio

            16.1.9.3. Profitability by Market Segments

            16.1.9.4. Sales Footprint

            16.1.9.5. Strategy Overview

                16.1.9.5.1. Marketing Strategy

                16.1.9.5.2. Product Strategy

                16.1.9.5.3. Channel Strategy

        16.1.10. Beijing Hike IoT Technology Co., Ltd.

            16.1.10.1. Overview

            16.1.10.2. Product Portfolio

            16.1.10.3. Profitability by Market Segments

            16.1.10.4. Sales Footprint

            16.1.10.5. Strategy Overview

                16.1.10.5.1. Marketing Strategy

                16.1.10.5.2. Product Strategy

                16.1.10.5.3. Channel Strategy

17. Assumptions & Acronyms Used

18. Research Methodology

List of Tables

Table 1: Global Market Value (US$ Million) Forecast by Region, 2018 to 2033

Table 2: Global Market Volume (Units) Forecast by Region, 2018 to 2033

Table 3: Global Market Value (US$ Million) Forecast by Type, 2018 to 2033

Table 4: Global Market Volume (Units) Forecast by Type, 2018 to 2033

Table 5: Global Market Value (US$ Million) Forecast by Technique, 2018 to 2033

Table 6: Global Market Volume (Units) Forecast by Technique, 2018 to 2033

Table 7: Global Market Value (US$ Million) Forecast by End-Use, 2018 to 2033

Table 8: Global Market Volume (Units) Forecast by End-Use, 2018 to 2033

Table 9: North America Market Value (US$ Million) Forecast by Country, 2018 to 2033

Table 10: North America Market Volume (Units) Forecast by Country, 2018 to 2033

Table 11: North America Market Value (US$ Million) Forecast by Type, 2018 to 2033

Table 12: North America Market Volume (Units) Forecast by Type, 2018 to 2033

Table 13: North America Market Value (US$ Million) Forecast by Technique, 2018 to 2033

Table 14: North America Market Volume (Units) Forecast by Technique, 2018 to 2033

Table 15: North America Market Value (US$ Million) Forecast by End-Use, 2018 to 2033

Table 16: North America Market Volume (Units) Forecast by End-Use, 2018 to 2033

Table 17: Latin America Market Value (US$ Million) Forecast by Country, 2018 to 2033

Table 18: Latin America Market Volume (Units) Forecast by Country, 2018 to 2033

Table 19: Latin America Market Value (US$ Million) Forecast by Type, 2018 to 2033

Table 20: Latin America Market Volume (Units) Forecast by Type, 2018 to 2033

Table 21: Latin America Market Value (US$ Million) Forecast by Technique, 2018 to 2033

Table 22: Latin America Market Volume (Units) Forecast by Technique, 2018 to 2033

Table 23: Latin America Market Value (US$ Million) Forecast by End-Use, 2018 to 2033

Table 24: Latin America Market Volume (Units) Forecast by End-Use, 2018 to 2033

Table 25: Europe Market Value (US$ Million) Forecast by Country, 2018 to 2033

Table 26: Europe Market Volume (Units) Forecast by Country, 2018 to 2033

Table 27: Europe Market Value (US$ Million) Forecast by Type, 2018 to 2033

Table 28: Europe Market Volume (Units) Forecast by Type, 2018 to 2033

Table 29: Europe Market Value (US$ Million) Forecast by Technique, 2018 to 2033

Table 30: Europe Market Volume (Units) Forecast by Technique, 2018 to 2033

Table 31: Europe Market Value (US$ Million) Forecast by End-Use, 2018 to 2033

Table 32: Europe Market Volume (Units) Forecast by End-Use, 2018 to 2033

Table 33: Asia Pacific Market Value (US$ Million) Forecast by Country, 2018 to 2033

Table 34: Asia Pacific Market Volume (Units) Forecast by Country, 2018 to 2033

Table 35: Asia Pacific Market Value (US$ Million) Forecast by Type, 2018 to 2033

Table 36: Asia Pacific Market Volume (Units) Forecast by Type, 2018 to 2033

Table 37: Asia Pacific Market Value (US$ Million) Forecast by Technique, 2018 to 2033

Table 38: Asia Pacific Market Volume (Units) Forecast by Technique, 2018 to 2033

Table 39: Asia Pacific Market Value (US$ Million) Forecast by End-Use, 2018 to 2033

Table 40: Asia Pacific Market Volume (Units) Forecast by End-Use, 2018 to 2033

Table 41: MEA Market Value (US$ Million) Forecast by Country, 2018 to 2033

Table 42: MEA Market Volume (Units) Forecast by Country, 2018 to 2033

Table 43: MEA Market Value (US$ Million) Forecast by Type, 2018 to 2033

Table 44: MEA Market Volume (Units) Forecast by Type, 2018 to 2033

Table 45: MEA Market Value (US$ Million) Forecast by Technique, 2018 to 2033

Table 46: MEA Market Volume (Units) Forecast by Technique, 2018 to 2033

Table 47: MEA Market Value (US$ Million) Forecast by End-Use, 2018 to 2033

Table 48: MEA Market Volume (Units) Forecast by End-Use, 2018 to 2033

List of Charts

Figure 1: Global Market Value (US$ Million) by Type, 2023 to 2033

Figure 2: Global Market Value (US$ Million) by Technique, 2023 to 2033

Figure 3: Global Market Value (US$ Million) by End-Use, 2023 to 2033

Figure 4: Global Market Value (US$ Million) by Region, 2023 to 2033

Figure 5: Global Market Value (US$ Million) Analysis by Region, 2018 to 2033

Figure 6: Global Market Volume (Units) Analysis by Region, 2018 to 2033

Figure 7: Global Market Value Share (%) and BPS Analysis by Region, 2023 to 2033

Figure 8: Global Market Y-o-Y Growth (%) Projections by Region, 2023 to 2033

Figure 9: Global Market Value (US$ Million) Analysis by Type, 2018 to 2033

Figure 10: Global Market Volume (Units) Analysis by Type, 2018 to 2033

Figure 11: Global Market Value Share (%) and BPS Analysis by Type, 2023 to 2033

Figure 12: Global Market Y-o-Y Growth (%) Projections by Type, 2023 to 2033

Figure 13: Global Market Value (US$ Million) Analysis by Technique, 2018 to 2033

Figure 14: Global Market Volume (Units) Analysis by Technique, 2018 to 2033

Figure 15: Global Market Value Share (%) and BPS Analysis by Technique, 2023 to 2033

Figure 16: Global Market Y-o-Y Growth (%) Projections by Technique, 2023 to 2033

Figure 17: Global Market Value (US$ Million) Analysis by End-Use, 2018 to 2033

Figure 18: Global Market Volume (Units) Analysis by End-Use, 2018 to 2033

Figure 19: Global Market Value Share (%) and BPS Analysis by End-Use, 2023 to 2033

Figure 20: Global Market Y-o-Y Growth (%) Projections by End-Use, 2023 to 2033

Figure 21: Global Market Attractiveness by Type, 2023 to 2033

Figure 22: Global Market Attractiveness by Technique, 2023 to 2033

Figure 23: Global Market Attractiveness by End-Use, 2023 to 2033

Figure 24: Global Market Attractiveness by Region, 2023 to 2033

Figure 25: North America Market Value (US$ Million) by Type, 2023 to 2033

Figure 26: North America Market Value (US$ Million) by Technique, 2023 to 2033

Figure 27: North America Market Value (US$ Million) by End-Use, 2023 to 2033

Figure 28: North America Market Value (US$ Million) by Country, 2023 to 2033

Figure 29: North America Market Value (US$ Million) Analysis by Country, 2018 to 2033

Figure 30: North America Market Volume (Units) Analysis by Country, 2018 to 2033

Figure 31: North America Market Value Share (%) and BPS Analysis by Country, 2023 to 2033

Figure 32: North America Market Y-o-Y Growth (%) Projections by Country, 2023 to 2033

Figure 33: North America Market Value (US$ Million) Analysis by Type, 2018 to 2033

Figure 34: North America Market Volume (Units) Analysis by Type, 2018 to 2033

Figure 35: North America Market Value Share (%) and BPS Analysis by Type, 2023 to 2033

Figure 36: North America Market Y-o-Y Growth (%) Projections by Type, 2023 to 2033

Figure 37: North America Market Value (US$ Million) Analysis by Technique, 2018 to 2033

Figure 38: North America Market Volume (Units) Analysis by Technique, 2018 to 2033

Figure 39: North America Market Value Share (%) and BPS Analysis by Technique, 2023 to 2033

Figure 40: North America Market Y-o-Y Growth (%) Projections by Technique, 2023 to 2033

Figure 41: North America Market Value (US$ Million) Analysis by End-Use, 2018 to 2033

Figure 42: North America Market Volume (Units) Analysis by End-Use, 2018 to 2033

Figure 43: North America Market Value Share (%) and BPS Analysis by End-Use, 2023 to 2033

Figure 44: North America Market Y-o-Y Growth (%) Projections by End-Use, 2023 to 2033

Figure 45: North America Market Attractiveness by Type, 2023 to 2033

Figure 46: North America Market Attractiveness by Technique, 2023 to 2033

Figure 47: North America Market Attractiveness by End-Use, 2023 to 2033

Figure 48: North America Market Attractiveness by Country, 2023 to 2033

Figure 49: Latin America Market Value (US$ Million) by Type, 2023 to 2033

Figure 50: Latin America Market Value (US$ Million) by Technique, 2023 to 2033

Figure 51: Latin America Market Value (US$ Million) by End-Use, 2023 to 2033

Figure 52: Latin America Market Value (US$ Million) by Country, 2023 to 2033

Figure 53: Latin America Market Value (US$ Million) Analysis by Country, 2018 to 2033

Figure 54: Latin America Market Volume (Units) Analysis by Country, 2018 to 2033

Figure 55: Latin America Market Value Share (%) and BPS Analysis by Country, 2023 to 2033

Figure 56: Latin America Market Y-o-Y Growth (%) Projections by Country, 2023 to 2033

Figure 57: Latin America Market Value (US$ Million) Analysis by Type, 2018 to 2033

Figure 58: Latin America Market Volume (Units) Analysis by Type, 2018 to 2033

Figure 59: Latin America Market Value Share (%) and BPS Analysis by Type, 2023 to 2033

Figure 60: Latin America Market Y-o-Y Growth (%) Projections by Type, 2023 to 2033

Figure 61: Latin America Market Value (US$ Million) Analysis by Technique, 2018 to 2033

Figure 62: Latin America Market Volume (Units) Analysis by Technique, 2018 to 2033

Figure 63: Latin America Market Value Share (%) and BPS Analysis by Technique, 2023 to 2033

Figure 64: Latin America Market Y-o-Y Growth (%) Projections by Technique, 2023 to 2033

Figure 65: Latin America Market Value (US$ Million) Analysis by End-Use, 2018 to 2033

Figure 66: Latin America Market Volume (Units) Analysis by End-Use, 2018 to 2033

Figure 67: Latin America Market Value Share (%) and BPS Analysis by End-Use, 2023 to 2033

Figure 68: Latin America Market Y-o-Y Growth (%) Projections by End-Use, 2023 to 2033

Figure 69: Latin America Market Attractiveness by Type, 2023 to 2033

Figure 70: Latin America Market Attractiveness by Technique, 2023 to 2033

Figure 71: Latin America Market Attractiveness by End-Use, 2023 to 2033

Figure 72: Latin America Market Attractiveness by Country, 2023 to 2033

Figure 73: Europe Market Value (US$ Million) by Type, 2023 to 2033

Figure 74: Europe Market Value (US$ Million) by Technique, 2023 to 2033

Figure 75: Europe Market Value (US$ Million) by End-Use, 2023 to 2033

Figure 76: Europe Market Value (US$ Million) by Country, 2023 to 2033

Figure 77: Europe Market Value (US$ Million) Analysis by Country, 2018 to 2033

Figure 78: Europe Market Volume (Units) Analysis by Country, 2018 to 2033

Figure 79: Europe Market Value Share (%) and BPS Analysis by Country, 2023 to 2033

Figure 80: Europe Market Y-o-Y Growth (%) Projections by Country, 2023 to 2033

Figure 81: Europe Market Value (US$ Million) Analysis by Type, 2018 to 2033

Figure 82: Europe Market Volume (Units) Analysis by Type, 2018 to 2033

Figure 83: Europe Market Value Share (%) and BPS Analysis by Type, 2023 to 2033

Figure 84: Europe Market Y-o-Y Growth (%) Projections by Type, 2023 to 2033

Figure 85: Europe Market Value (US$ Million) Analysis by Technique, 2018 to 2033

Figure 86: Europe Market Volume (Units) Analysis by Technique, 2018 to 2033

Figure 87: Europe Market Value Share (%) and BPS Analysis by Technique, 2023 to 2033

Figure 88: Europe Market Y-o-Y Growth (%) Projections by Technique, 2023 to 2033

Figure 89: Europe Market Value (US$ Million) Analysis by End-Use, 2018 to 2033

Figure 90: Europe Market Volume (Units) Analysis by End-Use, 2018 to 2033

Figure 91: Europe Market Value Share (%) and BPS Analysis by End-Use, 2023 to 2033

Figure 92: Europe Market Y-o-Y Growth (%) Projections by End-Use, 2023 to 2033

Figure 93: Europe Market Attractiveness by Type, 2023 to 2033

Figure 94: Europe Market Attractiveness by Technique, 2023 to 2033

Figure 95: Europe Market Attractiveness by End-Use, 2023 to 2033

Figure 96: Europe Market Attractiveness by Country, 2023 to 2033

Figure 97: Asia Pacific Market Value (US$ Million) by Type, 2023 to 2033

Figure 98: Asia Pacific Market Value (US$ Million) by Technique, 2023 to 2033

Figure 99: Asia Pacific Market Value (US$ Million) by End-Use, 2023 to 2033

Figure 100: Asia Pacific Market Value (US$ Million) by Country, 2023 to 2033

Figure 101: Asia Pacific Market Value (US$ Million) Analysis by Country, 2018 to 2033

Figure 102: Asia Pacific Market Volume (Units) Analysis by Country, 2018 to 2033

Figure 103: Asia Pacific Market Value Share (%) and BPS Analysis by Country, 2023 to 2033

Figure 104: Asia Pacific Market Y-o-Y Growth (%) Projections by Country, 2023 to 2033

Figure 105: Asia Pacific Market Value (US$ Million) Analysis by Type, 2018 to 2033

Figure 106: Asia Pacific Market Volume (Units) Analysis by Type, 2018 to 2033

Figure 107: Asia Pacific Market Value Share (%) and BPS Analysis by Type, 2023 to 2033

Figure 108: Asia Pacific Market Y-o-Y Growth (%) Projections by Type, 2023 to 2033

Figure 109: Asia Pacific Market Value (US$ Million) Analysis by Technique, 2018 to 2033

Figure 110: Asia Pacific Market Volume (Units) Analysis by Technique, 2018 to 2033

Figure 111: Asia Pacific Market Value Share (%) and BPS Analysis by Technique, 2023 to 2033

Figure 112: Asia Pacific Market Y-o-Y Growth (%) Projections by Technique, 2023 to 2033

Figure 113: Asia Pacific Market Value (US$ Million) Analysis by End-Use, 2018 to 2033

Figure 114: Asia Pacific Market Volume (Units) Analysis by End-Use, 2018 to 2033

Figure 115: Asia Pacific Market Value Share (%) and BPS Analysis by End-Use, 2023 to 2033

Figure 116: Asia Pacific Market Y-o-Y Growth (%) Projections by End-Use, 2023 to 2033

Figure 117: Asia Pacific Market Attractiveness by Type, 2023 to 2033

Figure 118: Asia Pacific Market Attractiveness by Technique, 2023 to 2033

Figure 119: Asia Pacific Market Attractiveness by End-Use, 2023 to 2033

Figure 120: Asia Pacific Market Attractiveness by Country, 2023 to 2033

Figure 121: MEA Market Value (US$ Million) by Type, 2023 to 2033

Figure 122: MEA Market Value (US$ Million) by Technique, 2023 to 2033

Figure 123: MEA Market Value (US$ Million) by End-Use, 2023 to 2033

Figure 124: MEA Market Value (US$ Million) by Country, 2023 to 2033

Figure 125: MEA Market Value (US$ Million) Analysis by Country, 2018 to 2033

Figure 126: MEA Market Volume (Units) Analysis by Country, 2018 to 2033

Figure 127: MEA Market Value Share (%) and BPS Analysis by Country, 2023 to 2033

Figure 128: MEA Market Y-o-Y Growth (%) Projections by Country, 2023 to 2033

Figure 129: MEA Market Value (US$ Million) Analysis by Type, 2018 to 2033

Figure 130: MEA Market Volume (Units) Analysis by Type, 2018 to 2033

Figure 131: MEA Market Value Share (%) and BPS Analysis by Type, 2023 to 2033

Figure 132: MEA Market Y-o-Y Growth (%) Projections by Type, 2023 to 2033

Figure 133: MEA Market Value (US$ Million) Analysis by Technique, 2018 to 2033

Figure 134: MEA Market Volume (Units) Analysis by Technique, 2018 to 2033

Figure 135: MEA Market Value Share (%) and BPS Analysis by Technique, 2023 to 2033

Figure 136: MEA Market Y-o-Y Growth (%) Projections by Technique, 2023 to 2033

Figure 137: MEA Market Value (US$ Million) Analysis by End-Use, 2018 to 2033

Figure 138: MEA Market Volume (Units) Analysis by End-Use, 2018 to 2033

Figure 139: MEA Market Value Share (%) and BPS Analysis by End-Use, 2023 to 2033

Figure 140: MEA Market Y-o-Y Growth (%) Projections by End-Use, 2023 to 2033

Figure 141: MEA Market Attractiveness by Type, 2023 to 2033

Figure 142: MEA Market Attractiveness by Technique, 2023 to 2033

Figure 143: MEA Market Attractiveness by End-Use, 2023 to 2033

Figure 144: MEA Market Attractiveness by Country, 2023 to 2033

Explore Consumer Product Insights

View Reports

Smart Air Purifiers Market