The global smart label market is valued at USD 12.4 billion in 2025 and is slated to reach USD 34.9 billion by 2035, recording an absolute increase of USD 22.4 billion over the forecast period. This translates into a total growth of 180.6%, with the market forecast to expand at a CAGR of 10.9% between 2025 and 2035.
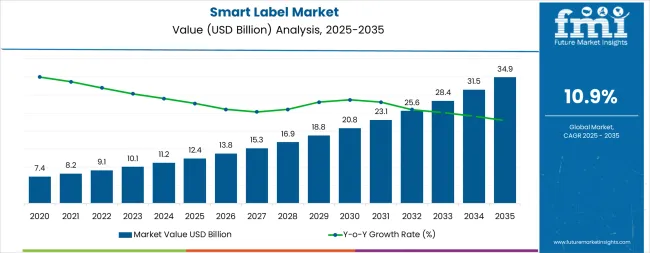
The market size is expected to grow by nearly 2.81X during the same period, supported by increasing adoption of automated inventory management systems, growing demand for supply chain visibility, and rising consumer preference for product authentication and traceability across diverse retail and logistics applications.
Between 2025 and 2030, the smart label market is projected to expand from USD 12.4 billion to USD 20.6 billion, resulting in a value increase of USD 8.2 billion, which represents 36.6% of the total forecast growth for the decade.
This phase of development will be shaped by increasing retail automation initiatives, rising adoption of Internet of Things (IoT) connectivity in supply chains, and growing demand for real-time asset tracking and inventory management solutions in logistics operations. Retailers and logistics providers are expanding their smart label deployment capabilities to address the growing demand for omnichannel retail experiences and enhanced supply chain transparency.
The smart label market is primarily driven by several key parent markets, with the packaging industry being the largest contributor, accounting for around 40-45%. Smart labels are increasingly integrated into packaging solutions across industries such as consumer goods, food, and beverages, offering enhanced features like temperature monitoring, RFID tracking, and QR codes for product information.
These labels not only improve product traceability and security but also provide valuable consumer engagement opportunities. The logistics and supply chain market, contributing approximately 20-25%, benefits significantly from smart labels, as they allow for real-time tracking of goods and inventory management. RFID and NFC technologies are crucial in ensuring efficient product movement, reducing theft, and monitoring temperature-sensitive items, especially during transit.
The retail and e-commerce market, accounting for about 15-20%, is another major driver, with smart labels enhancing the shopping experience through interactive features such as QR codes and augmented reality. The healthcare market, contributing around 10-12%, is increasingly adopting smart labels for applications in pharmaceuticals, medical devices, and patient monitoring.
These labels ensure product authenticity and improve safety by enabling traceability. The consumer electronics market, with a share of approximately 5-8%, uses smart labels for product authentication, warranty tracking, and enhancing user experience.
| Metric | Value |
|---|---|
| Estimated Value in (2025E) | USD 12.4 billion |
| Forecast Value in (2035F) | USD 34.9 billion |
| Forecast CAGR (2025 to 2035) | 10.9% |
Market expansion is being supported by the increasing global demand for supply chain visibility and the corresponding need for automated tracking solutions that can provide real-time inventory data while reducing manual scanning labor across various retail and logistics applications.
Modern retailers are increasingly focused on implementing technology solutions that can improve inventory accuracy, reduce stockouts, and provide seamless omnichannel fulfillment capabilities. Smart labels' proven ability to deliver automated identification, enhanced security features, and consumer engagement capabilities make them essential tools for contemporary retail operations and supply chain management solutions.
The growing emphasis on product authentication and anti-counterfeiting measures is driving demand for smart labels that can support brand protection, enable consumer verification, and provide transparent supply chain information from manufacturing to point of sale. Retailers' preference for technologies that combine operational efficiency with enhanced customer experience and loss prevention is creating opportunities for innovative smart label implementations. The rising influence of e-commerce growth and direct-to-consumer business models is also contributing to increased adoption of smart labels that can provide automated sortation, delivery verification, and returns management capabilities.
The smart labels market is poised for rapid growth and transformation. As retailers, logistics operators, and brand owners across both developed and emerging markets seek technologies that enable automated tracking, inventory visibility, product authentication, and consumer engagement, smart labels are gaining prominence not just as barcode replacements but as strategic platforms for connected commerce and intelligent supply chains.
Rising e-commerce penetration and omnichannel retail expansion in Asia-Pacific, Latin America, and Middle East & Africa amplify demand, while technology providers are advancing RFID chip capabilities, sensor integration, and cloud connectivity features.
Pathways like item-level tagging, sensor-enabled labels, and blockchain authentication promise strong margin uplift, especially in mature markets. Geographic expansion and vertical-specific solutions will capture volume, particularly where supply chain complexity is high or counterfeiting risk is elevated. Regulatory pressures around product traceability, pharmaceutical serialization, food safety tracking, and consumer protection give structural support.
The market is segmented by technology type, end use, application, and region. By technology type, the market is divided into RFID labels, NFC labels, electronic shelf labels (ESL), and sensing labels. By RFID frequency, it covers low frequency (LF), high frequency (HF), and ultra-high frequency (UHF). By form factor, it is segmented into tags, inlays, and cards.
The application categories include inventory management, asset tracking, product authentication, supply chain management, and consumer engagement. Based on end use, the market is categorized into retail & e-commerce, logistics & transportation, healthcare & pharmaceuticals, food & beverage, industrial & manufacturing, and others.
By distribution channel, the market includes direct sales, system integrators, and technology partners. Regionally, the market is divided into North America, Europe, East Asia, South Asia & Pacific, Latin America, and the Middle East & Africa.
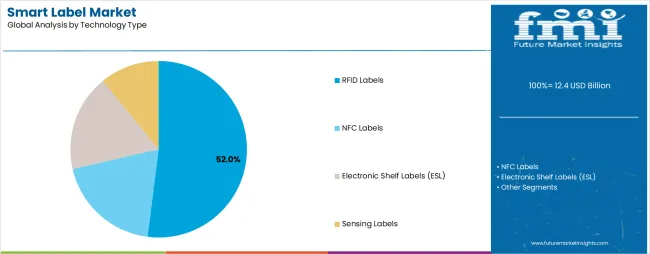
The RFID labels segment is projected to account for 52.0% of the smart label market in 2025, reaffirming its position as the leading technology category. Retailers and logistics operators increasingly utilize RFID labels for their superior read range, simultaneous multi-tag scanning capability, and no-line-of-sight reading advantages compared to traditional barcodes. RFID technology's advanced tracking capabilities and inventory accuracy improvements directly address the operational requirements for real-time visibility and labor cost reduction in large-scale retail and distribution operations.
This technology segment forms the foundation of modern automated supply chain operations, as it represents the solution with the greatest scalability and established return on investment across multiple retail and logistics applications.
Enterprise investments in RFID infrastructure and integrated software platforms continue to strengthen adoption among major retailers and third-party logistics providers. With retailers prioritizing inventory accuracy and omnichannel fulfillment capabilities, RFID labels align with both operational efficiency objectives and customer experience enhancement goals, making them the central component of comprehensive retail technology strategies.
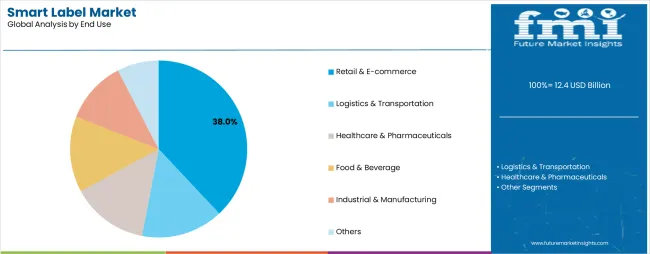
Retail & e-commerce operations are projected to represent 38.0% of smart label demand in 2025, underscoring their critical role as the primary adopters of automated tracking technologies for inventory management and omnichannel fulfillment.
Retailers prefer smart labels for their ability to improve inventory accuracy, reduce stockouts, and enable rapid cycle counting while enhancing theft prevention and supply chain visibility. Positioned as essential infrastructure for modern retail operations, smart labels offer both operational advantages and customer experience benefits.
The segment is supported by continuous innovation in retail technology integration and the growing availability of cost-effective RFID solutions that enable item-level tracking across diverse product categories. Retailers are investing in backend system integration to support real-time inventory visibility across stores, warehouses, and e-commerce channels.
As omnichannel shopping becomes more prevalent and inventory accuracy requirements increase, retail & e-commerce will continue to dominate the end-user market while supporting advanced tracking capabilities and customer fulfillment strategies.
The smart label market is advancing rapidly due to increasing retailer demand for inventory automation and growing adoption of IoT-enabled tracking solutions that provide real-time visibility and operational efficiency across diverse supply chain applications. The market faces challenges, including high initial infrastructure investment requirements, standardization issues across different RFID frequencies, and the need for enterprise system integration capabilities. Innovation in chip miniaturization technologies and cloud-based data management platforms continues to influence product development and market expansion patterns.
The growing adoption of ultra-high-frequency (UHF) RFID technology is enabling retailers and logistics operators to achieve longer read ranges, faster data capture rates, and simultaneous multi-tag reading capabilities compared to legacy tracking systems. UHF RFID systems provide improved operational efficiency while allowing more flexible deployment across warehouse automation, point-of-sale integration, and supply chain checkpoint applications. Retailers are increasingly recognizing the competitive advantages of UHF RFID capabilities for inventory accuracy improvement and labor cost reduction.
Modern smart label manufacturers are incorporating environmental sensors and IoT communication protocols to enable real-time condition monitoring, automated alert generation, and cloud-based data analytics for supply chain visibility. These technologies improve quality control while enabling new applications, including cold chain monitoring, freshness tracking, and tamper detection. Advanced sensor integration also allows brand owners to support premium product positioning and consumer trust beyond traditional identification and tracking functions.
| Country | CAGR (2025-2035) |
|---|---|
| China | 13.2% |
| India | 12.8% |
| USA | 10.5% |
| Germany | 9.8% |
| Japan | 9.2% |
| United Kingdom | 8.9% |
| South Korea | 11.5% |
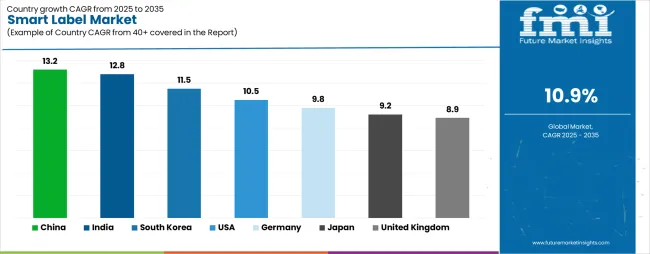
The smart label market is experiencing strong growth globally, with China leading at a 13.2% CAGR through 2035, driven by massive e-commerce infrastructure development, government-supported RFID adoption initiatives, and significant investment in retail automation and smart logistics capabilities. India follows at 12.8%, supported by rapid e-commerce growth, expanding organized retail penetration, and increasing awareness of inventory management technologies.
The USA shows growth at 10.5%, emphasizing omnichannel retail optimization and pharmaceutical serialization compliance. South Korea records 11.5%, focusing on advanced retail technology implementation and export-oriented manufacturing capabilities.
Germany demonstrates 9.8% growth, prioritizing industrial automation and pharmaceutical traceability requirements. Japan exhibits 9.2% growth, supported by convenience store automation and logistics efficiency initiatives. The United Kingdom shows 8.9% growth, driven by retail modernization and supply chain digitalization programs.
The report covers an in-depth analysis of 40+ countries, with top-performing countries highlighted below.
Revenue from smart labels in China is projected to exhibit exceptional growth with a CAGR of 13.2% through 2035, driven by explosive e-commerce growth and rapidly expanding retail automation infrastructure supported by government digitalization initiatives. The country's massive manufacturing base and increasing investment in IoT technologies are creating substantial demand for advanced tracking solutions. Major retailers, logistics providers, and technology companies are establishing comprehensive RFID deployment capabilities to serve both domestic and international markets.
Demand for smart labels in India is expanding at a CAGR of 12.8%, supported by the country's rapidly growing e-commerce sector, expanding organized retail footprint, and increasing adoption of modern inventory management practices. The country's large consumer market and improving retail infrastructure are driving demand for automated tracking capabilities. International technology providers and domestic solution integrators are establishing extensive deployment and support capabilities to address the growing demand for smart label solutions.
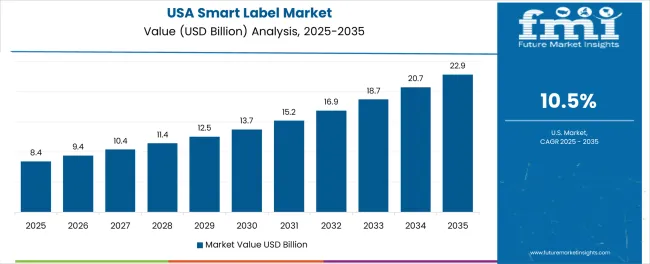
Revenue from smart labels in the USA is growing at a CAGR of 10.5%, supported by the country's advanced retail sector, strong emphasis on omnichannel fulfillment, and robust regulatory requirements for pharmaceutical and healthcare product tracking. The nation's mature retail technology ecosystem and high consumer expectations for seamless shopping experiences are driving sophisticated smart label implementations throughout the supply chain. Leading retailers and technology providers are investing extensively in item-level tagging programs and integrated tracking platforms to serve both in-store and online channels.
The sale of smart labels in South Korea is expected to grow at a CAGR of 11.5%, driven by advanced retail technology infrastructure, strong manufacturing capabilities for RFID components, and government support for smart city initiatives. The country's technology-savvy consumer base and emphasis on convenience retail automation are supporting demand for sophisticated tracking solutions across retail and logistics sectors. Technology manufacturers and system integrators are establishing comprehensive capabilities to serve both domestic deployment and global export markets.
Revenue from smart labels in Germany is anticipated to expand at a CAGR of 9.8%, supported by the country's advanced manufacturing sector, stringent pharmaceutical regulations, and emphasis on Industry 4.0 automation initiatives. Germany's mature logistics infrastructure and technological expertise are supporting investment in sophisticated tracking capabilities throughout manufacturing, healthcare, and retail sectors. Industry leaders are establishing comprehensive compliance and tracking systems to serve both domestic and European export markets with verified product authentication.
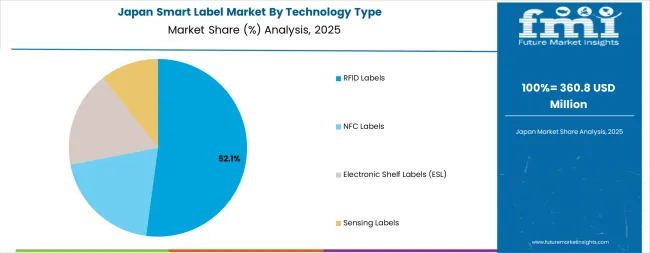
Demand for smart labels in Japan is expected to expand at a CAGR of 9.2%, supported by the country's extensive convenience store network, advanced logistics automation, and strong consumer preference for quality assurance and product authenticity. Japan's sophisticated retail sector and emphasis on operational efficiency are driving demand for automated inventory management and labor-saving technologies. Leading retailers and logistics providers are investing in comprehensive tracking systems to address labor shortage challenges while maintaining service quality standards.
Revenue from smart labels in the United Kingdom is forecasted to grow at a CAGR of 8.9%, driven by retail sector modernization initiatives, omnichannel fulfillment requirements, and increasing adoption of loss prevention technologies. The country's mature e-commerce market and competitive retail landscape are supporting investment in inventory accuracy and fulfillment speed improvements. Major retailers are implementing item-level RFID programs to enhance customer experience while reducing inventory carrying costs and theft losses.
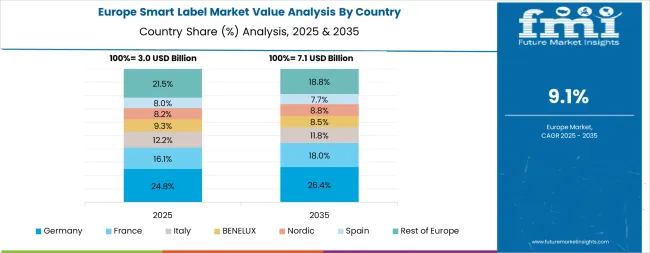
The smart label market in Europe is projected to grow from USD 3.2 billion in 2025 to USD 8.9 billion by 2035, registering a CAGR of 10.8% over the forecast period. Germany is expected to maintain its leadership position with a 29.0% market share in 2025, increasing slightly to 30.0% by 2035, supported by its strong pharmaceutical industry, advanced manufacturing automation, and comprehensive RFID infrastructure serving European logistics networks.
The United Kingdom follows with a 22.0% share in 2025, projected to reach 21.5% by 2035, driven by robust retail sector adoption and omnichannel fulfillment requirements, though facing some competitive pressure from continental European technology providers.
France holds a 17.0% share in 2025, expected to reach 17.5% by 2035, supported by luxury goods authentication demand and pharmaceutical compliance requirements. Italy commands a 12.0% share in 2025, projected to reach 12.3% by 2035, while Spain accounts for 9.0% in 2025, expected to reach 9.2% by 2035.
The Netherlands maintains a 5.5% share in 2025, growing to 5.8% by 2035, driven by its role as a European logistics hub. The Rest of Europe region, including Nordic countries, Eastern Europe, Belgium, Switzerland, and Austria, is anticipated to gain momentum, expanding its collective share from 8.0% to 8.2% by 2035, attributed to increasing retail automation in Nordic markets and growing pharmaceutical manufacturing activities across Eastern European countries implementing EU regulatory compliance programs.
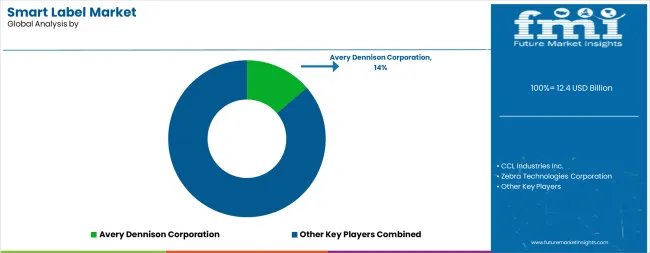
The smart label market is characterized by competition among established RFID technology providers, label manufacturers with smart capabilities, and integrated IoT solution providers. Companies are investing in chip miniaturization research, antenna design optimization, software platform development, and comprehensive solution portfolios to deliver cost-effective, reliable, and scalable smart label systems. Innovation in sensor integration, battery-assisted passive tags, and blockchain-enabled authentication is central to strengthening market position and competitive advantage.
Avery Dennison Corporation leads the market with a strong market share, offering comprehensive RFID inlay manufacturing and intelligent label solutions with a focus on retail apparel and logistics applications. CCL Industries provides specialized label production capabilities with an emphasis on pharmaceutical serialization and brand authentication.
Zebra Technologies delivers integrated tracking systems combining smart labels with barcode printers and mobile computers for enterprise deployment. Honeywell International specializes in RFID readers, handheld scanners, and warehouse automation solutions. Sato Holdings focuses on auto-identification systems and label printing technologies for retail and industrial markets. Alien Technology offers high-performance RFID chips and inlays for item-level tagging applications.
| Items | Values |
|---|---|
| Quantitative Units (2025) | USD 12.4 billion |
| Technology Type | RFID Labels, NFC Labels, Electronic Shelf Labels (ESL), Sensing Labels |
| RFID Frequency | Low Frequency (LF), High Frequency (HF), Ultra-High Frequency (UHF) |
| Form Factor | Tags, Inlays, Cards |
| Application | Inventory Management, Asset Tracking, Product Authentication, Supply Chain Management, Consumer Engagement |
| End Use | Retail & E-commerce, Logistics & Transportation, Healthcare & Pharmaceuticals, Food & Beverage, Industrial & Manufacturing, Others |
| Distribution Channel | Direct Sales, System Integrators, Technology Partners |
| Regions Covered | North America, Europe, East Asia, South Asia & Pacific, Latin America, Middle East & Africa |
| Countries Covered | United States, Canada, United Kingdom, Germany, France, China, Japan, South Korea, India, Brazil, Australia and 40+ countries |
| Key Companies Profiled | Avery Dennison Corporation, CCL Industries, Zebra Technologies, Honeywell International, Sato Holdings, and Alien Technology |
| Additional Attributes | Dollar sales by technology type and end use category, regional demand trends, competitive landscape, technological advancements in RFID chip design, sensor integration, IoT connectivity platforms, and enterprise system integration |
The global smart label market is estimated to be valued at USD 12.4 billion in 2025.
The market size for the smart label market is projected to reach USD 34.9 billion by 2035.
The smart label market is expected to grow at a 10.9% CAGR between 2025 and 2035.
The key product types in smart label market are rfid labels, nfc labels, electronic shelf labels (esl) and sensing labels.
In terms of end use, retail & e-commerce segment to command 38.0% share in the smart label market in 2025.


Full Research Suite comprises of:
Market outlook & trends analysis
Interviews & case studies
Strategic recommendations
Vendor profiles & capabilities analysis
5-year forecasts
8 regions and 60+ country-level data splits
Market segment data splits
12 months of continuous data updates
DELIVERED AS:
PDF EXCEL ONLINE
Smart Labelling in Logistics Market Size and Share Forecast Outlook 2025 to 2035
Market Share Insights for Smart Label Providers
Spoil Detection Based Smart Label Market Size and Share Forecast Outlook 2025 to 2035
Smart Wheelchair Market Forecast and Outlook 2025 to 2035
Smart TV Market Forecast and Outlook 2025 to 2035
Smart/AI Toy Market Size and Share Forecast Outlook 2025 to 2035
Smart Locks Market Size and Share Forecast Outlook 2025 to 2035
Smart Sprinkler Controller Market Size and Share Forecast Outlook 2025 to 2035
Smart Indoor Gardening System Market Size and Share Forecast Outlook 2025 to 2035
Smart Building Delivery Robot Market Size and Share Forecast Outlook 2025 to 2035
Smart Watch Market Size and Share Forecast Outlook 2025 to 2035
Smart Mat Market Size and Share Forecast Outlook 2025 to 2035
Smart Water Management Market Size and Share Forecast Outlook 2025 to 2035
Smart Built-In Kitchen Appliance Market Size and Share Forecast Outlook 2025 to 2035
Smart Cold Therapy Machine Market Size and Share Forecast Outlook 2025 to 2035
Smart Personal Assistance Devices Market Size and Share Forecast Outlook 2025 to 2035
Smart Speaker Market Size and Share Forecast Outlook 2025 to 2035
Smart Vehicle Architecture Market Size and Share Forecast Outlook 2025 to 2035
Smart City Platforms Market Size and Share Forecast Outlook 2025 to 2035
Smart Doorbell Market Size and Share Forecast Outlook 2025 to 2035

Thank you!
You will receive an email from our Business Development Manager. Please be sure to check your SPAM/JUNK folder too.
Chat With
MaRIA