Labels Market Size, Share, and Forecast Outlook 2025 to 2035

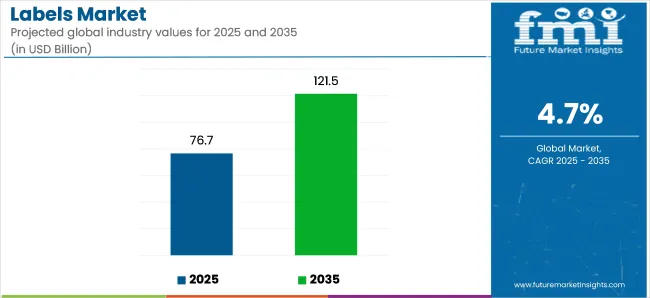
The global labels market is anticipated to grow from USD 76.7 billion in 2025 to USD 121.5 billion by 2035, expanding at a compound annual growth rate (CAGR) of 4.7% during the forecast period. The increasing demand for product customization, along with the growth of e-commerce and the need for improved supply chain transparency, is driving the rise of the labels market. Labels are a crucial part of branding and marketing strategies across various industries, including food and beverage, consumer goods, pharmaceuticals, and logistics.

One of the primary drivers of this market’s growth is the ongoing expansion of the global e-commerce sector. As more consumers shop online, there is an increasing need for packaging and labeling that helps differentiate products and meet regulatory requirements.

Additionally, labels play a significant role in providing critical product information such as ingredients, usage instructions, and expiry dates, which is essential for both consumer safety and compliance with local regulations. The rise of sustainability trends is also influencing the market, with an increasing demand for eco-friendly, recyclable, and biodegradable labels.

Labels Market Industry Value Analysis
Attribute Value
Market Size in 2025 USD 76.7 Billion
Market Size in 2035 USD 121.5 Billion
CAGR (2025 to 2035) 4.7%

Technological advancements in label production have further propelled the market. The development of digital printing technologies, which allow for cost-effective, high-quality, and short-run label production, is reshaping the industry. These innovations enable companies to produce personalized and variable data labels, offering better flexibility in meeting consumer needs. Furthermore, the rise of smart labels and RFID (radio-frequency identification) technology is revolutionizing product tracking and inventory management, adding an extra layer of efficiency to the supply chain.

On February 22, 2024, CCL Industries inaugurated a new sustainable sleeve label hub in Dornbirn, Austria, marking a significant advancement in eco-friendly packaging solutions. This €50 million investment features a state-of-the-art facility over 10,000 square meters, including a fully automated warehouse with intelligent storage management.

The hub specializes in EcoFloat™, a low-density polyolefin shrink sleeve material that easily separates from containers during recycling processes, enhancing material recovery and supporting circular economy initiatives. CCL's commitment to sustainability is further demonstrated by the facility's design, which incorporates modern environmental considerations to minimize its carbon footprint. This was officially announced in the company's press release.

As consumer preferences shift and new technologies continue to emerge, the global labels market is poised for significant expansion, providing opportunities for companies to offer cutting-edge, sustainable labeling solutions across industries.

Semi Annual Market Update

The below table presents the expected CAGR for the global labels market over several semi-annual periods spanning from 2024 to 2034.

Particular Value CAGR
H1 (2024 to 2034) 1.6%
H2 (2024 to 2034) 3.7%
H1 (2025 to 2035) 2.5%
H2 (2025 to 2035) 4.6%

In the first half (H1) of the decade from 2023 to 2033, the business is predicted to surge at a CAGR of 1.6%, followed by a slightly higher growth rate of 3.7% in the second half (H2) of the same decade.

Moving into the subsequent period, from H1 2024 to H2 2034, the CAGR is projected to decrease slightly to 2.5% in the first half and remain relatively moderate at 4.6% in the second half. In the first half (H1) the market witnessed a decrease of 90 BPS while in the second half (H2), the market witnessed an increase of 90 BPS.

Analyzing Labels Market by Top Investment Segments

The global labels market is projected to witness significant growth from 2025 to 2035. Key segments contributing to this expansion include digital printing and pressure-sensitive labels. These segments are fueled by advancements in printing technologies and increasing demand for customizable, high-quality labels across industries like food & beverage, healthcare, and retail.

Digital Printing Segment to Capture Market Share with Customization and Efficiency

Digital printing is expected to account for 47.2% of the labels market share by 2035. This segment is experiencing rapid growth due to the increasing demand for short-run, high-quality, and customizable labels. Digital printing allows for greater flexibility, faster turnaround times, and cost-effective solutions, especially for small and medium-sized businesses. The technology enables the production of labels with intricate designs, vibrant colors, and personalized elements, making it ideal for industries that require unique packaging solutions.

Labels Market Analysis By Printing Technology

Key players like HP Inc. and Xeikon are driving innovations in digital printing, offering advanced digital presses that improve printing efficiency while reducing waste. As consumer preferences shift towards personalized products, brands in the food, cosmetics, and pharmaceutical sectors are increasingly adopting digital printing for labels that reflect their unique branding and packaging needs. Additionally, digital printing technologies allow for better integration with e-commerce platforms, helping companies meet the demands of online sales and fast-moving consumer goods.

Pressure-Sensitive Labels to Dominate with Convenience and Versatility

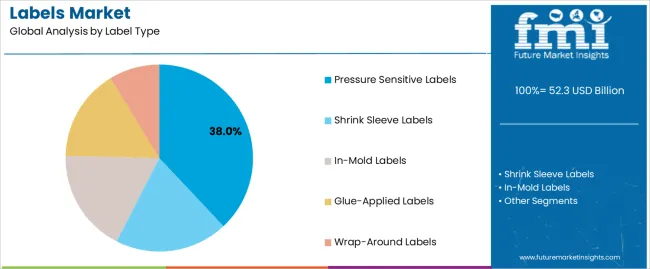
Pressure-sensitive labels are projected to hold 72.5% of the market share in 2035, making them the dominant segment in the labels market. This segment’s growth is driven by the growing preference for easy-to-apply, adhesive labels that require no heat or additional adhesives. Pressure-sensitive labels are widely used in various industries, including food & beverage, pharmaceuticals, retail, and logistics, due to their versatility, durability, and ease of application.

Labels Market Analysis By Product Type

Key companies like Avery Dennison and 3M are at the forefront of innovations in pressure-sensitive labels, offering products with enhanced features such as tamper-evident designs, waterproof coatings, and recyclable materials. The increasing focus on sustainability has also led to the development of eco-friendly pressure-sensitive labels that align with the growing demand for environmentally conscious packaging solutions.

Additionally, the rise of automation in packaging lines is supporting the widespread use of pressure-sensitive labels in manufacturing and logistics. With their ability to adapt to various surfaces and withstand environmental stress, pressure-sensitive labels are expected to maintain their dominance in the market.

Key Industry Highlights

Consumer Interest in Product Information Elevates Labels Market Growth

Major factor driving the demand of labels at the global level is awareness among consumers about information related to products. With increased health consciousness, consumers today look for detailed information about the products they are buying.

Labels are used for communication of such information basically related to the following aspects: ingredients, facts, source, and usage guidelines of the product. This resultant demand for clear honest product information propels manufacturers to invest in high-quality informative labeling.

The point is that the increased attention of companies to improve labels so as to meet the demands of consumers makes sure that the product is in line with the consumer's values rather than merely adhering to the regulations. Thus, the heightened transparency will expand the global labels market because consumers tend to take more informed purchasing decisions.

Need for Product Traceability in Various Industries Fuels Demand in Labels Market

Labels are a must-have tool in the tracking of products throughout the supply chain due to increased demand for transparency from business and consumers. This is particularly important in the food and pharmaceutical sectors, as such products are sensitive to safety and quality. It can be applied in identifying and tracing products from production to the point of consumption through the use of information such as barcodes, batch numbers, and expiration dates.

For instance, within the pharmaceutical company, labels put on the medicinal bottles have individualized identification that aids in fast-tracking drug batches when recalls are called for or checking the authenticity. The traceability of these products not only ensures regulatory compliance but also establishes consumer confidence. Thus, it is one of the emerging global drivers of the labels market.

Inconsistent Standardization of Labels May Hinder Global Labels Market Expansion

The lack of standardization in labeling regulations across various countries or regions may hamper global businesses by creating significant compliance challenges. Each country may have its own set of rules regarding language requirements, health warnings, ingredient disclosures, or packaging symbols, and companies may be forced to adapt their labels to meet diverse legal standards.

This lack of uniform labeling standards places the burden of creating many different labeling formats on the business to accommodate various markets, increasing its operational costs. Businesses are also exposed to the risk of compliance mistakes, which might lead to the imposition of fines, recalls, or other negative impacts on the brand reputation.

The added complexity in design and production processes can further hamper efficiency, making it more difficult to maintain a streamlined supply chain.

Market Concentration

Tier 1 companies comprise market leaders capturing significant market share in global market. These market leaders are characterized by high production capacity and a wide product portfolio. These market leaders are distinguished by their extensive expertise in manufacturing across multiple packaging formats and a broad geographical reach, underpinned by a robust consumer base.

They provide a wide range of series including recycling and manufacturing utilizing the latest technology and meeting the regulatory standards providing the highest quality. Prominent companies within tier 1 include 3M Company, Multi-Color Corporation, Avery Dennison Corporation, Amcor plc, and UPM Global among others.

Tier 2 companies include mid-size players having presence in specific regions and highly influencing the local market. These are characterized by a strong presence overseas and strong market knowledge. These market players have good technology and ensure regulatory compliance but may not have advanced technology and wide global reach.

Prominent companies in tier 2 include Fuji Seal International, Inc., CCL Industries, Toray Plastics (America), Inc., Huhtamäki Oyj, Klöckner Pentaplast, Allen Plastic Industries Co., Ltd., Lintec Corporation, BRADY Corp, Derksen Co., Sigma Aldrich Corporation, and JK Labels.

Tier 3 includes the majority of small-scale companies operating at the local presence and serving niche markets. These companies are notably oriented towards fulfilling local market demands and are consequently classified within the tier 3 share segment. They are small-scale players and have limited geographical reach.

Tier 3, within this context, is recognized as an unorganized market, denoting a sector characterized by a lack of extensive structure and formalization when compared to organized competitors.

Country-wise Insights

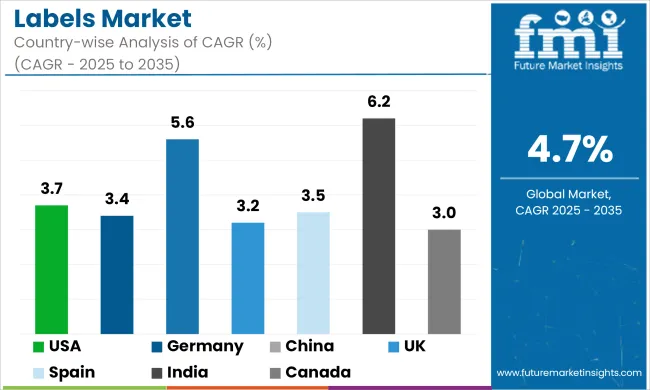
The section below covers the future forecast for the labels market in terms of countries. Information on key countries in several parts of the globe, including North America, Latin America, East Asia, South Asia and Pacific, Western Europe, Eastern Europe and MEA is provided. USA is expected to account for a CAGR of 3.7% through 2035. In Europe, Germany is projected to witness a CAGR of 3.4% by 2035.

Labels Market Cagr Analysis By Country
Countries Value CAGR (2025 to 2035)
USA 3.7%
Germany 3.4%
China 5.6%
UK 3.2%
Spain 3.5%
India 6.2%
Canada 3.0%

E-commerce Growth in USA Spurs Demand for Durable Packaging and Labels

The significant development of e-commerce in the USA has directly increased the demand for durable and protective packaging solutions, leading to a significant increase in label requirements. With products being shipped over a longer distance, labeling and providing specific information required for the handling, shipment, and delivery of those products are necessary through labels.

Proper identification, tracking, and compliance with shipping regulations are guaranteed with labels. These contain important information, such as barcodes, QR codes, and product details, which would make it easy to track and engage with customers. Because of personalization and the need for brands to be highly visible in e-commerce, companies are using custom labels to help make their products unique and more appealing to consumers.

German Regulatory Requirements Drives Demand for Secure Labels in Pharmaceutical Packaging

Strict pharmaceutical laws in Germany push the use of tamper-evident and child-resistant packaging in healthcare and medicinal cannabis. Labels will be of paramount importance to comply with regulations as they are supposed to carry the following information like dosage instructions, ingredients, expiration dates, and safety warnings. The labels are supposed to comply with specific legal requirements such as clear and legible fonts and symbols to denote tamper-proof features.

In addition, for medicinal cannabis products, the labels must specify the content of cannabinoids and must carry health warnings. Since safety for consumers remains paramount, advanced technologies such as QR codes in pharmaceutical packaging labels to ensure traceability and authentication continue to be integrated for increased security and compliance of the products.

Competitive Landscape

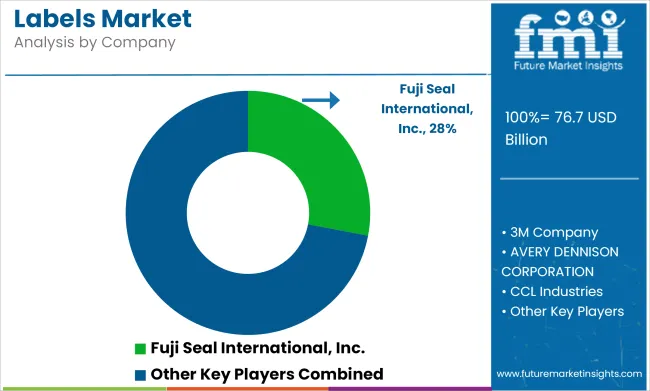
Key players of global labels industry are developing and launching new products in the market. They are integrating with different firms and extending their geographical presence. Few of them are also collaborating and partnering with local brands and start-up companies

Labels Market Analysis By Company

Key Developments:

  • In June 2024, CCL Industries Inc. successfully concluded the acquisition of a Middle East joint venture, Pacman-CCL ("PCCL") engaged in providing labels and operated facilities in Oman, Egypt, Saudi Arabia and Pakistan.
  • In October 2024, Multi-Color Corporation (MCC) acquired Starport Technologies, a company in Kansas City, Missouri, which offers smart label solutions.

Key Players in Labels Market

  • Fuji Seal International, Inc.
  • 3M Company
  • Multi-Color Corporation
  • AVERY DENNISON CORPORATION
  • CCL Industries
  • UPM Global
  • Toray Plastics (America), Inc.
  • Huhtamäki Oyj
  • Amcor plc
  • Klöckner Pentaplast
  • Allen Plastic Industries Co., Ltd.
  • Lintec Corporation
  • BRADY Corp
  • Derksen Co.
  • Sigma Aldrich Corporation
  • JK Labels

Report Scope Table - Labels Market

Report Attributes Details
Current Total Market Size (2025) USD 76.7 billion
Projected Market Size (2035) USD 121.5 billion
CAGR (2025 to 2035) 4.7%
Base Year for Estimation 2024
Historical Period 2020 to 2024
Projections Period 2025 to 2035
Quantitative Units USD billion for dollar sales
Materials Analyzed (Segment 1) Plastic (PE, PP, PVC, PET, Other), Paper (Kraft, Recycled), Foil
Product Types Analyzed (Segment 2) Pressure Sensitive Labels, Shrink Labels, Stretch Labels, Wet Glue Labels, Others (In-mold, Pre-gummed)
Printing Technologies Analyzed (Segment 3) Flexographic Printing, Digital Printing, Gravure Printing, Offset Printing, Letterpress Printing
Ink Types Analyzed (Segment 4) Solvent Based, Water Based, UV Based, Others (Latex Based)
End-uses Analyzed (Segment 5) Food (Bakery & Confectionery, Dairy Products, Baby Food, Chilled or Frozen Foods, Others), Beverages (Alcoholic, Non-alcoholic), Pharmaceuticals (Tablets/Capsules, Cream & Ointment, Liquid Syrup, Others), Cosmetics & Personal Care, Homecare & Toiletries, Chemicals, Automobiles, Other Industrial
Regions Covered North America, Latin America, East Asia, South Asia & Pacific, Western Europe, Eastern Europe, Middle East & Africa
Countries Covered United States, Canada, Mexico, Brazil, Argentina, Germany, France, United Kingdom, Italy, Spain, Netherlands, China, India, Japan, South Korea, ANZ, GCC Countries, South Africa
Key Players influencing the Labels Market Fuji Seal International, Inc., 3M Company, AVERY DENNISON CORPORATION, CCL Industries, UPM Global, Toray Plastics (America), Inc., Huhtamäki Oyj, Amcor plc, Klöckner Pentaplast, Allen Plastic Industries Co., Ltd.
Additional Attributes dollar sales, CAGR trends, material type segmentation, product type demand, printing technology shifts, ink type usage, end-use industry trends, competitor dollar sales & market share, regional growth patterns

Global Labels Market Segmentation

By Material:

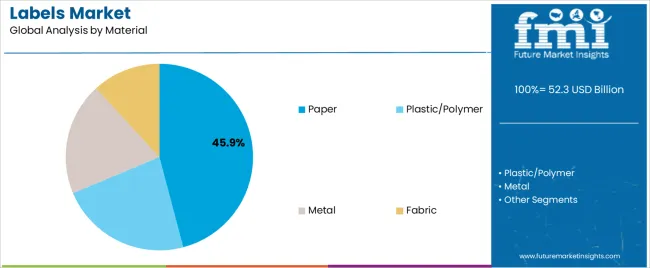
Materials in the market for labels include plastic, paper and foil. Plastic includes polyethylene (PE), polypropylene (PP), polyvinyl chloride (PVC), polyethylene terephthalate (PET) and others (PA, EVOH, etc.). Paper includes kraft paper and recycled paper.

By Product Type:

In terms of product type, the market for labels is divided into pressure sensitive labels, shrink labels, stretch labels, wet glue labels and others (In-mold, pre-gummed, etc.)

By Printing Technology:

Printing technique used in the market for labels include flexographic printing, digital printing, gravure printing, offset printing and letterpress printing.

By Ink type:

Types of ink in the industry for labels are solvent based, water based, UV based and others (latex based, etc.).

By End Use:

End users related to labels are food, beverages, pharmaceutical, cosmetics & personal care, homecare & toiletries, chemicals, automobiles and other industrial. Food includes bakery and confectionery, dairy products, baby food, chilled or frozen foods, and others (snacks, etc.). Beverages in further sub-categorized into alcoholic and non-alcoholic. Pharmaceuticals includes tablet/capsules, cream & ointment, liquid syrup and others.

By Region:

Key Countries of North America, Latin America, East Asia, South Asia & Pacific, Western Europe, Eastern Europe and Middle East & Africa are covered.

Table of Content

  1. Executive Summary
  2. Industry Introduction, including Taxonomy and Market Definition
  3. Labels Trends and Success Factors, including Macro-economic Factors, Market Dynamics, and Recent Industry Developments
  4. Global Market Demand Analysis 2020 to 2024 and Forecast 2025 to 2035, including Historical Analysis and Future Projections
  5. Global Market Analysis 2020 to 2024 and Forecast 2025 to 2035
    • Material
    • Product Type
    • Printing Technology
    • Ink Type
    • End Use
  6. Global Market Analysis 2020 to 2024 and Forecast 2025 to 2035, By Material
    • Plastic
    • Paper
    • Foil
  7. Global Market Analysis 2020 to 2024 and Forecast 2025 to 2035, By Product Type
    • Pressure Sensitive Labels
    • Shrink Labels
    • Stretch Labels
    • Wet Glue Labels
    • Others (In-mold, pre-gummed, etc.)
  8. Global Market Analysis 2020 to 2024 and Forecast 2025 to 2035, By Printing Technology
    • Flexographic Printing
    • Digital Printing
    • Gravure Printing
    • Offset Printing
    • Letterpress Printing
  9. Global Market Analysis 2020 to 2024 and Forecast 2025 to 2035, By Ink Type
    • Solvent Based
    • Water Based
    • UV Based
    • Others (latex based, etc.)
  10. Global Market Analysis 2020 to 2024 and Forecast 2025 to 2035, By End Use
    • Food
    • Beverages
    • Pharmaceuticals
    • Cosmetics & Personal Care
    • Homecare & Toiletries
    • Chemicals
    • Other Industrial
  11. Global Market Analysis 2020 to 2024 and Forecast 2025 to 2035, By Region
    • North America
    • Latin America
    • Western Europe
    • Eastern Europe
    • East Asia
    • South Asia & Pacific
    • Middle East & Africa
  12. North America Sales Analysis 2020 to 2024 and Forecast 2025 to 2035, by Key Segments and Countries
  13. Latin America Sales Analysis 2020 to 2024 and Forecast 2025 to 2035, by Key Segments and Countries
  14. Western Europe Sales Analysis 2020 to 2024 and Forecast 2025 to 2035, by Key Segments and Countries
  15. Eastern Europe Sales Analysis 2020 to 2024 and Forecast 2025 to 2035, by Key Segments and Countries
  16. East Asia Sales Analysis 2020 to 2024 and Forecast 2025 to 2035, by Key Segments and Countries
  17. South Asia & Pacific Sales Analysis 2020 to 2024 and Forecast 2025 to 2035, by Key Segments and Countries
  18. Middle East & Africa Sales Analysis 2020 to 2024 and Forecast 2025 to 2035, by Key Segments and Countries
  19. Sales Forecast 2025 to 2035 by Material, Product Type, Printing Technology, Ink Type, and End Use for 30 Countries
  20. Competition Outlook, including Market Structure Analysis, Company Share Analysis by Key Players, and Competition Dashboard
  21. Company Profile
    • Fuji Seal International, Inc.
    • 3M Company
    • AVERY DENNISON CORPORATION
    • CCL Industries
    • UPM Global
    • Toray Plastics (America), Inc.
    • Huhtamäki Oyj
    • Amcor plc
    • Klöckner Pentaplast
    • Allen Plastic Industries Co., Ltd.

List of Tables

  • Table 1: Global Market Value (US$ Million) Forecast by Region, 2020 to 2035
  • Table 2: Global Market Volume (Sq. M.) Forecast by Region, 2020 to 2035
  • Table 3: Global Market Value (US$ Million) Forecast by Product Type, 2020 to 2035
  • Table 4: Global Market Volume (Sq. M.) Forecast by Product Type, 2020 to 2035
  • Table 5: Global Market Value (US$ Million) Forecast by Material Type, 2020 to 2035
  • Table 6: Global Market Volume (Sq. M.) Forecast by Material Type, 2020 to 2035
  • Table 7: Global Market Value (US$ Million) Forecast by Printing Technique, 2020 to 2035
  • Table 8: Global Market Volume (Sq. M.) Forecast by Printing Technique, 2020 to 2035
  • Table 9: Global Market Value (US$ Million) Forecast by Ink Type, 2020 to 2035
  • Table 10: Global Market Volume (Sq. M.) Forecast by Ink Type, 2020 to 2035
  • Table 11: Global Market Value (US$ Million) Forecast by End Use, 2020 to 2035
  • Table 12: Global Market Volume (Sq. M.) Forecast by End Use, 2020 to 2035
  • Table 13: North America Market Value (US$ Million) Forecast by Country, 2020 to 2035
  • Table 14: North America Market Volume (Sq. M.) Forecast by Country, 2020 to 2035
  • Table 15: North America Market Value (US$ Million) Forecast by Product Type, 2020 to 2035
  • Table 16: North America Market Volume (Sq. M.) Forecast by Product Type, 2020 to 2035
  • Table 17: North America Market Value (US$ Million) Forecast by Material Type, 2020 to 2035
  • Table 18: North America Market Volume (Sq. M.) Forecast by Material Type, 2020 to 2035
  • Table 19: North America Market Value (US$ Million) Forecast by Printing Technique, 2020 to 2035
  • Table 20: North America Market Volume (Sq. M.) Forecast by Printing Technique, 2020 to 2035
  • Table 21: North America Market Value (US$ Million) Forecast by Ink Type, 2020 to 2035
  • Table 22: North America Market Volume (Sq. M.) Forecast by Ink Type, 2020 to 2035
  • Table 23: North America Market Value (US$ Million) Forecast by End Use, 2020 to 2035
  • Table 24: North America Market Volume (Sq. M.) Forecast by End Use, 2020 to 2035
  • Table 25: Latin America Market Value (US$ Million) Forecast by Country, 2020 to 2035
  • Table 26: Latin America Market Volume (Sq. M.) Forecast by Country, 2020 to 2035
  • Table 27: Latin America Market Value (US$ Million) Forecast by Product Type, 2020 to 2035
  • Table 28: Latin America Market Volume (Sq. M.) Forecast by Product Type, 2020 to 2035
  • Table 29: Latin America Market Value (US$ Million) Forecast by Material Type, 2020 to 2035
  • Table 30: Latin America Market Volume (Sq. M.) Forecast by Material Type, 2020 to 2035
  • Table 31: Latin America Market Value (US$ Million) Forecast by Printing Technique, 2020 to 2035
  • Table 32: Latin America Market Volume (Sq. M.) Forecast by Printing Technique, 2020 to 2035
  • Table 33: Latin America Market Value (US$ Million) Forecast by Ink Type, 2020 to 2035
  • Table 34: Latin America Market Volume (Sq. M.) Forecast by Ink Type, 2020 to 2035
  • Table 35: Latin America Market Value (US$ Million) Forecast by End Use, 2020 to 2035
  • Table 36: Latin America Market Volume (Sq. M.) Forecast by End Use, 2020 to 2035
  • Table 37: Western Europe Market Value (US$ Million) Forecast by Country, 2020 to 2035
  • Table 38: Western Europe Market Volume (Sq. M.) Forecast by Country, 2020 to 2035
  • Table 39: Western Europe Market Value (US$ Million) Forecast by Product Type, 2020 to 2035
  • Table 40: Western Europe Market Volume (Sq. M.) Forecast by Product Type, 2020 to 2035
  • Table 41: Western Europe Market Value (US$ Million) Forecast by Material Type, 2020 to 2035
  • Table 42: Western Europe Market Volume (Sq. M.) Forecast by Material Type, 2020 to 2035
  • Table 43: Western Europe Market Value (US$ Million) Forecast by Printing Technique, 2020 to 2035
  • Table 44: Western Europe Market Volume (Sq. M.) Forecast by Printing Technique, 2020 to 2035
  • Table 45: Western Europe Market Value (US$ Million) Forecast by Ink Type, 2020 to 2035
  • Table 46: Western Europe Market Volume (Sq. M.) Forecast by Ink Type, 2020 to 2035
  • Table 47: Western Europe Market Value (US$ Million) Forecast by End Use, 2020 to 2035
  • Table 48: Western Europe Market Volume (Sq. M.) Forecast by End Use, 2020 to 2035
  • Table 49: Eastern Europe Market Value (US$ Million) Forecast by Country, 2020 to 2035
  • Table 50: Eastern Europe Market Volume (Sq. M.) Forecast by Country, 2020 to 2035
  • Table 51: Eastern Europe Market Value (US$ Million) Forecast by Product Type, 2020 to 2035
  • Table 52: Eastern Europe Market Volume (Sq. M.) Forecast by Product Type, 2020 to 2035
  • Table 53: Eastern Europe Market Value (US$ Million) Forecast by Material Type, 2020 to 2035
  • Table 54: Eastern Europe Market Volume (Sq. M.) Forecast by Material Type, 2020 to 2035
  • Table 55: Eastern Europe Market Value (US$ Million) Forecast by Printing Technique, 2020 to 2035
  • Table 56: Eastern Europe Market Volume (Sq. M.) Forecast by Printing Technique, 2020 to 2035
  • Table 57: Eastern Europe Market Value (US$ Million) Forecast by Ink Type, 2020 to 2035
  • Table 58: Eastern Europe Market Volume (Sq. M.) Forecast by Ink Type, 2020 to 2035
  • Table 59: Eastern Europe Market Value (US$ Million) Forecast by End Use, 2020 to 2035
  • Table 60: Eastern Europe Market Volume (Sq. M.) Forecast by End Use, 2020 to 2035
  • Table 61: South Asia and Pacific Market Value (US$ Million) Forecast by Country, 2020 to 2035
  • Table 62: South Asia and Pacific Market Volume (Sq. M.) Forecast by Country, 2020 to 2035
  • Table 63: South Asia and Pacific Market Value (US$ Million) Forecast by Product Type, 2020 to 2035
  • Table 64: South Asia and Pacific Market Volume (Sq. M.) Forecast by Product Type, 2020 to 2035
  • Table 65: South Asia and Pacific Market Value (US$ Million) Forecast by Material Type, 2020 to 2035
  • Table 66: South Asia and Pacific Market Volume (Sq. M.) Forecast by Material Type, 2020 to 2035
  • Table 67: South Asia and Pacific Market Value (US$ Million) Forecast by Printing Technique, 2020 to 2035
  • Table 68: South Asia and Pacific Market Volume (Sq. M.) Forecast by Printing Technique, 2020 to 2035
  • Table 69: South Asia and Pacific Market Value (US$ Million) Forecast by Ink Type, 2020 to 2035
  • Table 70: South Asia and Pacific Market Volume (Sq. M.) Forecast by Ink Type, 2020 to 2035
  • Table 71: South Asia and Pacific Market Value (US$ Million) Forecast by End Use, 2020 to 2035
  • Table 72: South Asia and Pacific Market Volume (Sq. M.) Forecast by End Use, 2020 to 2035
  • Table 73: East Asia Market Value (US$ Million) Forecast by Country, 2020 to 2035
  • Table 74: East Asia Market Volume (Sq. M.) Forecast by Country, 2020 to 2035
  • Table 75: East Asia Market Value (US$ Million) Forecast by Product Type, 2020 to 2035
  • Table 76: East Asia Market Volume (Sq. M.) Forecast by Product Type, 2020 to 2035
  • Table 77: East Asia Market Value (US$ Million) Forecast by Material Type, 2020 to 2035
  • Table 78: East Asia Market Volume (Sq. M.) Forecast by Material Type, 2020 to 2035
  • Table 79: East Asia Market Value (US$ Million) Forecast by Printing Technique, 2020 to 2035
  • Table 80: East Asia Market Volume (Sq. M.) Forecast by Printing Technique, 2020 to 2035
  • Table 81: East Asia Market Value (US$ Million) Forecast by Ink Type, 2020 to 2035
  • Table 82: East Asia Market Volume (Sq. M.) Forecast by Ink Type, 2020 to 2035
  • Table 83: East Asia Market Value (US$ Million) Forecast by End Use, 2020 to 2035
  • Table 84: East Asia Market Volume (Sq. M.) Forecast by End Use, 2020 to 2035
  • Table 85: Middle East and Africa Market Value (US$ Million) Forecast by Country, 2020 to 2035
  • Table 86: Middle East and Africa Market Volume (Sq. M.) Forecast by Country, 2020 to 2035
  • Table 87: Middle East and Africa Market Value (US$ Million) Forecast by Product Type, 2020 to 2035
  • Table 88: Middle East and Africa Market Volume (Sq. M.) Forecast by Product Type, 2020 to 2035
  • Table 89: Middle East and Africa Market Value (US$ Million) Forecast by Material Type, 2020 to 2035
  • Table 90: Middle East and Africa Market Volume (Sq. M.) Forecast by Material Type, 2020 to 2035
  • Table 91: Middle East and Africa Market Value (US$ Million) Forecast by Printing Technique, 2020 to 2035
  • Table 92: Middle East and Africa Market Volume (Sq. M.) Forecast by Printing Technique, 2020 to 2035
  • Table 93: Middle East and Africa Market Value (US$ Million) Forecast by Ink Type, 2020 to 2035
  • Table 94: Middle East and Africa Market Volume (Sq. M.) Forecast by Ink Type, 2020 to 2035
  • Table 95: Middle East and Africa Market Value (US$ Million) Forecast by End Use, 2020 to 2035
  • Table 96: Middle East and Africa Market Volume (Sq. M.) Forecast by End Use, 2020 to 2035

List of Figures

  • Figure 1: Global Market Value (US$ Million) by Product Type, 2025 to 2035
  • Figure 2: Global Market Value (US$ Million) by Material Type, 2025 to 2035
  • Figure 3: Global Market Value (US$ Million) by Printing Technique, 2025 to 2035
  • Figure 4: Global Market Value (US$ Million) by Ink Type, 2025 to 2035
  • Figure 5: Global Market Value (US$ Million) by End Use, 2025 to 2035
  • Figure 6: Global Market Value (US$ Million) by Region, 2025 to 2035
  • Figure 7: Global Market Value (US$ Million) Analysis by Region, 2020 to 2035
  • Figure 8: Global Market Volume (Sq. M.) Analysis by Region, 2020 to 2035
  • Figure 9: Global Market Value Share (%) and BPS Analysis by Region, 2025 to 2035
  • Figure 10: Global Market Y-o-Y Growth (%) Projections by Region, 2025 to 2035
  • Figure 11: Global Market Value (US$ Million) Analysis by Product Type, 2020 to 2035
  • Figure 12: Global Market Volume (Sq. M.) Analysis by Product Type, 2020 to 2035
  • Figure 13: Global Market Value Share (%) and BPS Analysis by Product Type, 2025 to 2035
  • Figure 14: Global Market Y-o-Y Growth (%) Projections by Product Type, 2025 to 2035
  • Figure 15: Global Market Value (US$ Million) Analysis by Material Type, 2020 to 2035
  • Figure 16: Global Market Volume (Sq. M.) Analysis by Material Type, 2020 to 2035
  • Figure 17: Global Market Value Share (%) and BPS Analysis by Material Type, 2025 to 2035
  • Figure 18: Global Market Y-o-Y Growth (%) Projections by Material Type, 2025 to 2035
  • Figure 19: Global Market Value (US$ Million) Analysis by Printing Technique, 2020 to 2035
  • Figure 20: Global Market Volume (Sq. M.) Analysis by Printing Technique, 2020 to 2035
  • Figure 21: Global Market Value Share (%) and BPS Analysis by Printing Technique, 2025 to 2035
  • Figure 22: Global Market Y-o-Y Growth (%) Projections by Printing Technique, 2025 to 2035
  • Figure 23: Global Market Value (US$ Million) Analysis by Ink Type, 2020 to 2035
  • Figure 24: Global Market Volume (Sq. M.) Analysis by Ink Type, 2020 to 2035
  • Figure 25: Global Market Value Share (%) and BPS Analysis by Ink Type, 2025 to 2035
  • Figure 26: Global Market Y-o-Y Growth (%) Projections by Ink Type, 2025 to 2035
  • Figure 27: Global Market Value (US$ Million) Analysis by End Use, 2020 to 2035
  • Figure 28: Global Market Volume (Sq. M.) Analysis by End Use, 2020 to 2035
  • Figure 29: Global Market Value Share (%) and BPS Analysis by End Use, 2025 to 2035
  • Figure 30: Global Market Y-o-Y Growth (%) Projections by End Use, 2025 to 2035
  • Figure 31: Global Market Attractiveness by Product Type, 2025 to 2035
  • Figure 32: Global Market Attractiveness by Material Type, 2025 to 2035
  • Figure 33: Global Market Attractiveness by Printing Technique, 2025 to 2035
  • Figure 34: Global Market Attractiveness by Ink Type, 2025 to 2035
  • Figure 35: Global Market Attractiveness by End Use, 2025 to 2035
  • Figure 36: Global Market Attractiveness by Region, 2025 to 2035
  • Figure 37: North America Market Value (US$ Million) by Product Type, 2025 to 2035
  • Figure 38: North America Market Value (US$ Million) by Material Type, 2025 to 2035
  • Figure 39: North America Market Value (US$ Million) by Printing Technique, 2025 to 2035
  • Figure 40: North America Market Value (US$ Million) by Ink Type, 2025 to 2035
  • Figure 41: North America Market Value (US$ Million) by End Use, 2025 to 2035
  • Figure 42: North America Market Value (US$ Million) by Country, 2025 to 2035
  • Figure 43: North America Market Value (US$ Million) Analysis by Country, 2020 to 2035
  • Figure 44: North America Market Volume (Sq. M.) Analysis by Country, 2020 to 2035
  • Figure 45: North America Market Value Share (%) and BPS Analysis by Country, 2025 to 2035
  • Figure 46: North America Market Y-o-Y Growth (%) Projections by Country, 2025 to 2035
  • Figure 47: North America Market Value (US$ Million) Analysis by Product Type, 2020 to 2035
  • Figure 48: North America Market Volume (Sq. M.) Analysis by Product Type, 2020 to 2035
  • Figure 49: North America Market Value Share (%) and BPS Analysis by Product Type, 2025 to 2035
  • Figure 50: North America Market Y-o-Y Growth (%) Projections by Product Type, 2025 to 2035
  • Figure 51: North America Market Value (US$ Million) Analysis by Material Type, 2020 to 2035
  • Figure 52: North America Market Volume (Sq. M.) Analysis by Material Type, 2020 to 2035
  • Figure 53: North America Market Value Share (%) and BPS Analysis by Material Type, 2025 to 2035
  • Figure 54: North America Market Y-o-Y Growth (%) Projections by Material Type, 2025 to 2035
  • Figure 55: North America Market Value (US$ Million) Analysis by Printing Technique, 2020 to 2035
  • Figure 56: North America Market Volume (Sq. M.) Analysis by Printing Technique, 2020 to 2035
  • Figure 57: North America Market Value Share (%) and BPS Analysis by Printing Technique, 2025 to 2035
  • Figure 58: North America Market Y-o-Y Growth (%) Projections by Printing Technique, 2025 to 2035
  • Figure 59: North America Market Value (US$ Million) Analysis by Ink Type, 2020 to 2035
  • Figure 60: North America Market Volume (Sq. M.) Analysis by Ink Type, 2020 to 2035
  • Figure 61: North America Market Value Share (%) and BPS Analysis by Ink Type, 2025 to 2035
  • Figure 62: North America Market Y-o-Y Growth (%) Projections by Ink Type, 2025 to 2035
  • Figure 63: North America Market Value (US$ Million) Analysis by End Use, 2020 to 2035
  • Figure 64: North America Market Volume (Sq. M.) Analysis by End Use, 2020 to 2035
  • Figure 65: North America Market Value Share (%) and BPS Analysis by End Use, 2025 to 2035
  • Figure 66: North America Market Y-o-Y Growth (%) Projections by End Use, 2025 to 2035
  • Figure 67: North America Market Attractiveness by Product Type, 2025 to 2035
  • Figure 68: North America Market Attractiveness by Material Type, 2025 to 2035
  • Figure 69: North America Market Attractiveness by Printing Technique, 2025 to 2035
  • Figure 70: North America Market Attractiveness by Ink Type, 2025 to 2035
  • Figure 71: North America Market Attractiveness by End Use, 2025 to 2035
  • Figure 72: North America Market Attractiveness by Country, 2025 to 2035
  • Figure 73: Latin America Market Value (US$ Million) by Product Type, 2025 to 2035
  • Figure 74: Latin America Market Value (US$ Million) by Material Type, 2025 to 2035
  • Figure 75: Latin America Market Value (US$ Million) by Printing Technique, 2025 to 2035
  • Figure 76: Latin America Market Value (US$ Million) by Ink Type, 2025 to 2035
  • Figure 77: Latin America Market Value (US$ Million) by End Use, 2025 to 2035
  • Figure 78: Latin America Market Value (US$ Million) by Country, 2025 to 2035
  • Figure 79: Latin America Market Value (US$ Million) Analysis by Country, 2020 to 2035
  • Figure 80: Latin America Market Volume (Sq. M.) Analysis by Country, 2020 to 2035
  • Figure 81: Latin America Market Value Share (%) and BPS Analysis by Country, 2025 to 2035
  • Figure 82: Latin America Market Y-o-Y Growth (%) Projections by Country, 2025 to 2035
  • Figure 83: Latin America Market Value (US$ Million) Analysis by Product Type, 2020 to 2035
  • Figure 84: Latin America Market Volume (Sq. M.) Analysis by Product Type, 2020 to 2035
  • Figure 85: Latin America Market Value Share (%) and BPS Analysis by Product Type, 2025 to 2035
  • Figure 86: Latin America Market Y-o-Y Growth (%) Projections by Product Type, 2025 to 2035
  • Figure 87: Latin America Market Value (US$ Million) Analysis by Material Type, 2020 to 2035
  • Figure 88: Latin America Market Volume (Sq. M.) Analysis by Material Type, 2020 to 2035
  • Figure 89: Latin America Market Value Share (%) and BPS Analysis by Material Type, 2025 to 2035
  • Figure 90: Latin America Market Y-o-Y Growth (%) Projections by Material Type, 2025 to 2035
  • Figure 91: Latin America Market Value (US$ Million) Analysis by Printing Technique, 2020 to 2035
  • Figure 92: Latin America Market Volume (Sq. M.) Analysis by Printing Technique, 2020 to 2035
  • Figure 93: Latin America Market Value Share (%) and BPS Analysis by Printing Technique, 2025 to 2035
  • Figure 94: Latin America Market Y-o-Y Growth (%) Projections by Printing Technique, 2025 to 2035
  • Figure 95: Latin America Market Value (US$ Million) Analysis by Ink Type, 2020 to 2035
  • Figure 96: Latin America Market Volume (Sq. M.) Analysis by Ink Type, 2020 to 2035
  • Figure 97: Latin America Market Value Share (%) and BPS Analysis by Ink Type, 2025 to 2035
  • Figure 98: Latin America Market Y-o-Y Growth (%) Projections by Ink Type, 2025 to 2035
  • Figure 99: Latin America Market Value (US$ Million) Analysis by End Use, 2020 to 2035
  • Figure 100: Latin America Market Volume (Sq. M.) Analysis by End Use, 2020 to 2035
  • Figure 101: Latin America Market Value Share (%) and BPS Analysis by End Use, 2025 to 2035
  • Figure 102: Latin America Market Y-o-Y Growth (%) Projections by End Use, 2025 to 2035
  • Figure 103: Latin America Market Attractiveness by Product Type, 2025 to 2035
  • Figure 104: Latin America Market Attractiveness by Material Type, 2025 to 2035
  • Figure 105: Latin America Market Attractiveness by Printing Technique, 2025 to 2035
  • Figure 106: Latin America Market Attractiveness by Ink Type, 2025 to 2035
  • Figure 107: Latin America Market Attractiveness by End Use, 2025 to 2035
  • Figure 108: Latin America Market Attractiveness by Country, 2025 to 2035
  • Figure 109: Western Europe Market Value (US$ Million) by Product Type, 2025 to 2035
  • Figure 110: Western Europe Market Value (US$ Million) by Material Type, 2025 to 2035
  • Figure 111: Western Europe Market Value (US$ Million) by Printing Technique, 2025 to 2035
  • Figure 112: Western Europe Market Value (US$ Million) by Ink Type, 2025 to 2035
  • Figure 113: Western Europe Market Value (US$ Million) by End Use, 2025 to 2035
  • Figure 114: Western Europe Market Value (US$ Million) by Country, 2025 to 2035
  • Figure 115: Western Europe Market Value (US$ Million) Analysis by Country, 2020 to 2035
  • Figure 116: Western Europe Market Volume (Sq. M.) Analysis by Country, 2020 to 2035
  • Figure 117: Western Europe Market Value Share (%) and BPS Analysis by Country, 2025 to 2035
  • Figure 118: Western Europe Market Y-o-Y Growth (%) Projections by Country, 2025 to 2035
  • Figure 119: Western Europe Market Value (US$ Million) Analysis by Product Type, 2020 to 2035
  • Figure 120: Western Europe Market Volume (Sq. M.) Analysis by Product Type, 2020 to 2035
  • Figure 121: Western Europe Market Value Share (%) and BPS Analysis by Product Type, 2025 to 2035
  • Figure 122: Western Europe Market Y-o-Y Growth (%) Projections by Product Type, 2025 to 2035
  • Figure 123: Western Europe Market Value (US$ Million) Analysis by Material Type, 2020 to 2035
  • Figure 124: Western Europe Market Volume (Sq. M.) Analysis by Material Type, 2020 to 2035
  • Figure 125: Western Europe Market Value Share (%) and BPS Analysis by Material Type, 2025 to 2035
  • Figure 126: Western Europe Market Y-o-Y Growth (%) Projections by Material Type, 2025 to 2035
  • Figure 127: Western Europe Market Value (US$ Million) Analysis by Printing Technique, 2020 to 2035
  • Figure 128: Western Europe Market Volume (Sq. M.) Analysis by Printing Technique, 2020 to 2035
  • Figure 129: Western Europe Market Value Share (%) and BPS Analysis by Printing Technique, 2025 to 2035
  • Figure 130: Western Europe Market Y-o-Y Growth (%) Projections by Printing Technique, 2025 to 2035
  • Figure 131: Western Europe Market Value (US$ Million) Analysis by Ink Type, 2020 to 2035
  • Figure 132: Western Europe Market Volume (Sq. M.) Analysis by Ink Type, 2020 to 2035
  • Figure 133: Western Europe Market Value Share (%) and BPS Analysis by Ink Type, 2025 to 2035
  • Figure 134: Western Europe Market Y-o-Y Growth (%) Projections by Ink Type, 2025 to 2035
  • Figure 135: Western Europe Market Value (US$ Million) Analysis by End Use, 2020 to 2035
  • Figure 136: Western Europe Market Volume (Sq. M.) Analysis by End Use, 2020 to 2035
  • Figure 137: Western Europe Market Value Share (%) and BPS Analysis by End Use, 2025 to 2035
  • Figure 138: Western Europe Market Y-o-Y Growth (%) Projections by End Use, 2025 to 2035
  • Figure 139: Western Europe Market Attractiveness by Product Type, 2025 to 2035
  • Figure 140: Western Europe Market Attractiveness by Material Type, 2025 to 2035
  • Figure 141: Western Europe Market Attractiveness by Printing Technique, 2025 to 2035
  • Figure 142: Western Europe Market Attractiveness by Ink Type, 2025 to 2035
  • Figure 143: Western Europe Market Attractiveness by End Use, 2025 to 2035
  • Figure 144: Western Europe Market Attractiveness by Country, 2025 to 2035
  • Figure 145: Eastern Europe Market Value (US$ Million) by Product Type, 2025 to 2035
  • Figure 146: Eastern Europe Market Value (US$ Million) by Material Type, 2025 to 2035
  • Figure 147: Eastern Europe Market Value (US$ Million) by Printing Technique, 2025 to 2035
  • Figure 148: Eastern Europe Market Value (US$ Million) by Ink Type, 2025 to 2035
  • Figure 149: Eastern Europe Market Value (US$ Million) by End Use, 2025 to 2035
  • Figure 150: Eastern Europe Market Value (US$ Million) by Country, 2025 to 2035
  • Figure 151: Eastern Europe Market Value (US$ Million) Analysis by Country, 2020 to 2035
  • Figure 152: Eastern Europe Market Volume (Sq. M.) Analysis by Country, 2020 to 2035
  • Figure 153: Eastern Europe Market Value Share (%) and BPS Analysis by Country, 2025 to 2035
  • Figure 154: Eastern Europe Market Y-o-Y Growth (%) Projections by Country, 2025 to 2035
  • Figure 155: Eastern Europe Market Value (US$ Million) Analysis by Product Type, 2020 to 2035
  • Figure 156: Eastern Europe Market Volume (Sq. M.) Analysis by Product Type, 2020 to 2035
  • Figure 157: Eastern Europe Market Value Share (%) and BPS Analysis by Product Type, 2025 to 2035
  • Figure 158: Eastern Europe Market Y-o-Y Growth (%) Projections by Product Type, 2025 to 2035
  • Figure 159: Eastern Europe Market Value (US$ Million) Analysis by Material Type, 2020 to 2035
  • Figure 160: Eastern Europe Market Volume (Sq. M.) Analysis by Material Type, 2020 to 2035
  • Figure 161: Eastern Europe Market Value Share (%) and BPS Analysis by Material Type, 2025 to 2035
  • Figure 162: Eastern Europe Market Y-o-Y Growth (%) Projections by Material Type, 2025 to 2035
  • Figure 163: Eastern Europe Market Value (US$ Million) Analysis by Printing Technique, 2020 to 2035
  • Figure 164: Eastern Europe Market Volume (Sq. M.) Analysis by Printing Technique, 2020 to 2035
  • Figure 165: Eastern Europe Market Value Share (%) and BPS Analysis by Printing Technique, 2025 to 2035
  • Figure 166: Eastern Europe Market Y-o-Y Growth (%) Projections by Printing Technique, 2025 to 2035
  • Figure 167: Eastern Europe Market Value (US$ Million) Analysis by Ink Type, 2020 to 2035
  • Figure 168: Eastern Europe Market Volume (Sq. M.) Analysis by Ink Type, 2020 to 2035
  • Figure 169: Eastern Europe Market Value Share (%) and BPS Analysis by Ink Type, 2025 to 2035
  • Figure 170: Eastern Europe Market Y-o-Y Growth (%) Projections by Ink Type, 2025 to 2035
  • Figure 171: Eastern Europe Market Value (US$ Million) Analysis by End Use, 2020 to 2035
  • Figure 172: Eastern Europe Market Volume (Sq. M.) Analysis by End Use, 2020 to 2035
  • Figure 173: Eastern Europe Market Value Share (%) and BPS Analysis by End Use, 2025 to 2035
  • Figure 174: Eastern Europe Market Y-o-Y Growth (%) Projections by End Use, 2025 to 2035
  • Figure 175: Eastern Europe Market Attractiveness by Product Type, 2025 to 2035
  • Figure 176: Eastern Europe Market Attractiveness by Material Type, 2025 to 2035
  • Figure 177: Eastern Europe Market Attractiveness by Printing Technique, 2025 to 2035
  • Figure 178: Eastern Europe Market Attractiveness by Ink Type, 2025 to 2035
  • Figure 179: Eastern Europe Market Attractiveness by End Use, 2025 to 2035
  • Figure 180: Eastern Europe Market Attractiveness by Country, 2025 to 2035
  • Figure 181: South Asia and Pacific Market Value (US$ Million) by Product Type, 2025 to 2035
  • Figure 182: South Asia and Pacific Market Value (US$ Million) by Material Type, 2025 to 2035
  • Figure 183: South Asia and Pacific Market Value (US$ Million) by Printing Technique, 2025 to 2035
  • Figure 184: South Asia and Pacific Market Value (US$ Million) by Ink Type, 2025 to 2035
  • Figure 185: South Asia and Pacific Market Value (US$ Million) by End Use, 2025 to 2035
  • Figure 186: South Asia and Pacific Market Value (US$ Million) by Country, 2025 to 2035
  • Figure 187: South Asia and Pacific Market Value (US$ Million) Analysis by Country, 2020 to 2035
  • Figure 188: South Asia and Pacific Market Volume (Sq. M.) Analysis by Country, 2020 to 2035
  • Figure 189: South Asia and Pacific Market Value Share (%) and BPS Analysis by Country, 2025 to 2035
  • Figure 190: South Asia and Pacific Market Y-o-Y Growth (%) Projections by Country, 2025 to 2035
  • Figure 191: South Asia and Pacific Market Value (US$ Million) Analysis by Product Type, 2020 to 2035
  • Figure 192: South Asia and Pacific Market Volume (Sq. M.) Analysis by Product Type, 2020 to 2035
  • Figure 193: South Asia and Pacific Market Value Share (%) and BPS Analysis by Product Type, 2025 to 2035
  • Figure 194: South Asia and Pacific Market Y-o-Y Growth (%) Projections by Product Type, 2025 to 2035
  • Figure 195: South Asia and Pacific Market Value (US$ Million) Analysis by Material Type, 2020 to 2035
  • Figure 196: South Asia and Pacific Market Volume (Sq. M.) Analysis by Material Type, 2020 to 2035
  • Figure 197: South Asia and Pacific Market Value Share (%) and BPS Analysis by Material Type, 2025 to 2035
  • Figure 198: South Asia and Pacific Market Y-o-Y Growth (%) Projections by Material Type, 2025 to 2035
  • Figure 199: South Asia and Pacific Market Value (US$ Million) Analysis by Printing Technique, 2020 to 2035
  • Figure 200: South Asia and Pacific Market Volume (Sq. M.) Analysis by Printing Technique, 2020 to 2035
  • Figure 201: South Asia and Pacific Market Value Share (%) and BPS Analysis by Printing Technique, 2025 to 2035
  • Figure 202: South Asia and Pacific Market Y-o-Y Growth (%) Projections by Printing Technique, 2025 to 2035
  • Figure 203: South Asia and Pacific Market Value (US$ Million) Analysis by Ink Type, 2020 to 2035
  • Figure 204: South Asia and Pacific Market Volume (Sq. M.) Analysis by Ink Type, 2020 to 2035
  • Figure 205: South Asia and Pacific Market Value Share (%) and BPS Analysis by Ink Type, 2025 to 2035
  • Figure 206: South Asia and Pacific Market Y-o-Y Growth (%) Projections by Ink Type, 2025 to 2035
  • Figure 207: South Asia and Pacific Market Value (US$ Million) Analysis by End Use, 2020 to 2035
  • Figure 208: South Asia and Pacific Market Volume (Sq. M.) Analysis by End Use, 2020 to 2035
  • Figure 209: South Asia and Pacific Market Value Share (%) and BPS Analysis by End Use, 2025 to 2035
  • Figure 210: South Asia and Pacific Market Y-o-Y Growth (%) Projections by End Use, 2025 to 2035
  • Figure 211: South Asia and Pacific Market Attractiveness by Product Type, 2025 to 2035
  • Figure 212: South Asia and Pacific Market Attractiveness by Material Type, 2025 to 2035
  • Figure 213: South Asia and Pacific Market Attractiveness by Printing Technique, 2025 to 2035
  • Figure 214: South Asia and Pacific Market Attractiveness by Ink Type, 2025 to 2035
  • Figure 215: South Asia and Pacific Market Attractiveness by End Use, 2025 to 2035
  • Figure 216: South Asia and Pacific Market Attractiveness by Country, 2025 to 2035
  • Figure 217: East Asia Market Value (US$ Million) by Product Type, 2025 to 2035
  • Figure 218: East Asia Market Value (US$ Million) by Material Type, 2025 to 2035
  • Figure 219: East Asia Market Value (US$ Million) by Printing Technique, 2025 to 2035
  • Figure 220: East Asia Market Value (US$ Million) by Ink Type, 2025 to 2035
  • Figure 221: East Asia Market Value (US$ Million) by End Use, 2025 to 2035
  • Figure 222: East Asia Market Value (US$ Million) by Country, 2025 to 2035
  • Figure 223: East Asia Market Value (US$ Million) Analysis by Country, 2020 to 2035
  • Figure 224: East Asia Market Volume (Sq. M.) Analysis by Country, 2020 to 2035
  • Figure 225: East Asia Market Value Share (%) and BPS Analysis by Country, 2025 to 2035
  • Figure 226: East Asia Market Y-o-Y Growth (%) Projections by Country, 2025 to 2035
  • Figure 227: East Asia Market Value (US$ Million) Analysis by Product Type, 2020 to 2035
  • Figure 228: East Asia Market Volume (Sq. M.) Analysis by Product Type, 2020 to 2035
  • Figure 229: East Asia Market Value Share (%) and BPS Analysis by Product Type, 2025 to 2035
  • Figure 230: East Asia Market Y-o-Y Growth (%) Projections by Product Type, 2025 to 2035
  • Figure 231: East Asia Market Value (US$ Million) Analysis by Material Type, 2020 to 2035
  • Figure 232: East Asia Market Volume (Sq. M.) Analysis by Material Type, 2020 to 2035
  • Figure 233: East Asia Market Value Share (%) and BPS Analysis by Material Type, 2025 to 2035
  • Figure 234: East Asia Market Y-o-Y Growth (%) Projections by Material Type, 2025 to 2035
  • Figure 235: East Asia Market Value (US$ Million) Analysis by Printing Technique, 2020 to 2035
  • Figure 236: East Asia Market Volume (Sq. M.) Analysis by Printing Technique, 2020 to 2035
  • Figure 237: East Asia Market Value Share (%) and BPS Analysis by Printing Technique, 2025 to 2035
  • Figure 238: East Asia Market Y-o-Y Growth (%) Projections by Printing Technique, 2025 to 2035
  • Figure 239: East Asia Market Value (US$ Million) Analysis by Ink Type, 2020 to 2035
  • Figure 240: East Asia Market Volume (Sq. M.) Analysis by Ink Type, 2020 to 2035
  • Figure 241: East Asia Market Value Share (%) and BPS Analysis by Ink Type, 2025 to 2035
  • Figure 242: East Asia Market Y-o-Y Growth (%) Projections by Ink Type, 2025 to 2035
  • Figure 243: East Asia Market Value (US$ Million) Analysis by End Use, 2020 to 2035
  • Figure 244: East Asia Market Volume (Sq. M.) Analysis by End Use, 2020 to 2035
  • Figure 245: East Asia Market Value Share (%) and BPS Analysis by End Use, 2025 to 2035
  • Figure 246: East Asia Market Y-o-Y Growth (%) Projections by End Use, 2025 to 2035
  • Figure 247: East Asia Market Attractiveness by Product Type, 2025 to 2035
  • Figure 248: East Asia Market Attractiveness by Material Type, 2025 to 2035
  • Figure 249: East Asia Market Attractiveness by Printing Technique, 2025 to 2035
  • Figure 250: East Asia Market Attractiveness by Ink Type, 2025 to 2035
  • Figure 251: East Asia Market Attractiveness by End Use, 2025 to 2035
  • Figure 252: East Asia Market Attractiveness by Country, 2025 to 2035
  • Figure 253: Middle East and Africa Market Value (US$ Million) by Product Type, 2025 to 2035
  • Figure 254: Middle East and Africa Market Value (US$ Million) by Material Type, 2025 to 2035
  • Figure 255: Middle East and Africa Market Value (US$ Million) by Printing Technique, 2025 to 2035
  • Figure 256: Middle East and Africa Market Value (US$ Million) by Ink Type, 2025 to 2035
  • Figure 257: Middle East and Africa Market Value (US$ Million) by End Use, 2025 to 2035
  • Figure 258: Middle East and Africa Market Value (US$ Million) by Country, 2025 to 2035
  • Figure 259: Middle East and Africa Market Value (US$ Million) Analysis by Country, 2020 to 2035
  • Figure 260: Middle East and Africa Market Volume (Sq. M.) Analysis by Country, 2020 to 2035
  • Figure 261: Middle East and Africa Market Value Share (%) and BPS Analysis by Country, 2025 to 2035
  • Figure 262: Middle East and Africa Market Y-o-Y Growth (%) Projections by Country, 2025 to 2035
  • Figure 263: Middle East and Africa Market Value (US$ Million) Analysis by Product Type, 2020 to 2035
  • Figure 264: Middle East and Africa Market Volume (Sq. M.) Analysis by Product Type, 2020 to 2035
  • Figure 265: Middle East and Africa Market Value Share (%) and BPS Analysis by Product Type, 2025 to 2035
  • Figure 266: Middle East and Africa Market Y-o-Y Growth (%) Projections by Product Type, 2025 to 2035
  • Figure 267: Middle East and Africa Market Value (US$ Million) Analysis by Material Type, 2020 to 2035
  • Figure 268: Middle East and Africa Market Volume (Sq. M.) Analysis by Material Type, 2020 to 2035
  • Figure 269: Middle East and Africa Market Value Share (%) and BPS Analysis by Material Type, 2025 to 2035
  • Figure 270: Middle East and Africa Market Y-o-Y Growth (%) Projections by Material Type, 2025 to 2035
  • Figure 271: Middle East and Africa Market Value (US$ Million) Analysis by Printing Technique, 2020 to 2035
  • Figure 272: Middle East and Africa Market Volume (Sq. M.) Analysis by Printing Technique, 2020 to 2035
  • Figure 273: Middle East and Africa Market Value Share (%) and BPS Analysis by Printing Technique, 2025 to 2035
  • Figure 274: Middle East and Africa Market Y-o-Y Growth (%) Projections by Printing Technique, 2025 to 2035
  • Figure 275: Middle East and Africa Market Value (US$ Million) Analysis by Ink Type, 2020 to 2035
  • Figure 276: Middle East and Africa Market Volume (Sq. M.) Analysis by Ink Type, 2020 to 2035
  • Figure 277: Middle East and Africa Market Value Share (%) and BPS Analysis by Ink Type, 2025 to 2035
  • Figure 278: Middle East and Africa Market Y-o-Y Growth (%) Projections by Ink Type, 2025 to 2035
  • Figure 279: Middle East and Africa Market Value (US$ Million) Analysis by End Use, 2020 to 2035
  • Figure 280: Middle East and Africa Market Volume (Sq. M.) Analysis by End Use, 2020 to 2035
  • Figure 281: Middle East and Africa Market Value Share (%) and BPS Analysis by End Use, 2025 to 2035
  • Figure 282: Middle East and Africa Market Y-o-Y Growth (%) Projections by End Use, 2025 to 2035
  • Figure 283: Middle East and Africa Market Attractiveness by Product Type, 2025 to 2035
  • Figure 284: Middle East and Africa Market Attractiveness by Material Type, 2025 to 2035
  • Figure 285: Middle East and Africa Market Attractiveness by Printing Technique, 2025 to 2035
  • Figure 286: Middle East and Africa Market Attractiveness by Ink Type, 2025 to 2035
  • Figure 287: Middle East and Africa Market Attractiveness by End Use, 2025 to 2035
  • Figure 288: Middle East and Africa Market Attractiveness by Country, 2025 to 2035

Frequently Asked Questions

What is the future of global labels industry?

The global labels industry is projected to witness CAGR of 4.7% between 2025 and 2035.

What was the worth of the global labels industry in 2024?

The global labels industry stood at USD 74.0 billion in 2024.

What will the worth of global labels industry by 2035 end?

Global labels industry is anticipated to reach USD 121.5 billion by 2035 end.

Which region to showcase the highest CAGR during forecast period?

South Asia & Pacific is set to record a CAGR of 5.8% in assessment period.

Who are the key players of global labels industry?

The key players operating in the global labels industry include 3M Company, Multi-Color Corporation, Avery Dennison Corporation, Amcor plc, and UPM Global among others.

Explore Similar Insights

Future Market Insights

Labels Market