Reports

- Global Locations -

Headquarters

Future Market Insights, Inc.

Christiana Corporate, 200
Continental Drive, Suite 401,
Newark, Delaware - 19713,
United States

T: +1-845-579-5705

Americas

Future Market Insights, Inc.

616 Corporate Way, Suite 2-9018,
Valley Cottage, NY 10989, United States

T: +1-347-918-3531

MEA

Future Market Insights

1602-6 Jumeirah Bay X2 Tower, Plot No: JLT-PH2-X2A,
Jumeirah Lakes Towers, Dubai,
United Arab Emirates

Europe

Future Market Insights

3rd Floor, 207 Regent Street,
W1B 3HH London
United Kingdom

T: + 44 (0) 20 8123 9659
D: +44 (0) 20 3287 4268

Asia Pacific

Future Market Insights

IndiaLand Global Tech Park, Unit UG-1, Behind Grand HighStreet, Phase 1, Hinjawadi, MH, Pune – 411057, India

The United States Label Industry Outlook from (2023 to 2033)

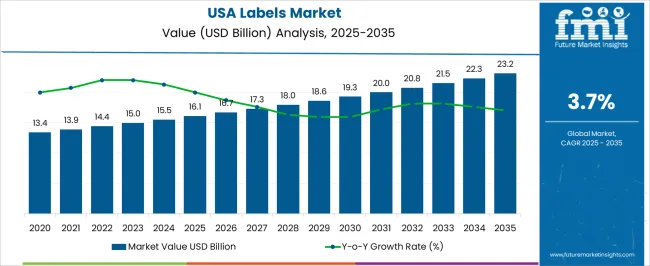
Label sales in the United States are set to be valued at US$ 15.7 billion in 2023 and are projected to reach US$ 21.9 billion by 2033. Revenue is anticipated to expand at a CAGR of 3.4% over the forecast period 2023 to 2033.

The business was valued at US$ 15 billion at the end of 2022 and is expected to exhibit y-o-y growth of 4.3% in 2023. Labels used in food packaging acquired more than 1/4th of the share considering end use in 2022.

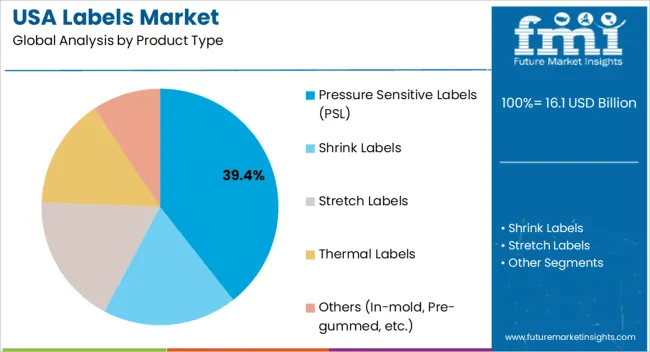
Pressure-sensitive labels are anticipated to acquire around 3/4th share in the country and are expected to expand at a CAGR of 3.6% over the assessment period. Plastic-based labels are projected to create a total monetary potential of US$ 3.2 billion between 2023 and 2033.

Attributes Details
United States Label Revenue, 2022 US$ 15.0 billion
United States Label Estimated Revenue (2023E) US$ 15.7 billion
United States Label Projected Revenue (2033F) US$ 21.9 billion
Value-based CAGR (2023 to 2033) 3.4%

Don't pay for what you don't need

Customize your report by selecting specific countries or regions and save 30%!

United States Label Industry Analysis

The label business is expected to experience lucrative growth during the forecast period. A new estimation predicts that sales will rise from 2023 to 2033. The business is projected to create a financial potential of US$ 6.9 billion and is predicted to expand 1.4 times the current value during the evaluation period.

RFIDs and QR codes would help manufacturers, distributors, and end users track their products and reduce the possibility of counterfeiting. These digital technologies are expected to be helpful in understanding product satisfaction by end users and the adoption of a particular product. Manufacturers are adopting QR codes and RFIDs in their labels to ensure the security and quality of their products until they reach end users.

Food, beverage, and pharmaceutical companies are adopting RFIDs and QR codes to a large extent compared to other sectors. Strict regulations from the United States state government over the quality of food items enable food & beverage firms to add data such as ingredients, expiry date, and nutritional value in their packages. These factors can only partially be added to a single label due to size concerns and often require the help of QR codes and RFID tags.

Labels, especially security labels, would offer anti-counterfeit measures to several products and maintain product integrity and quality. Moreover, offering multiple security systems such as QR codes, NFC tags, and bar codes in labels creates trust in consumers. Implementing warning labels on electronic devices, such as smartphones, tablets, and laptops, would help create awareness across the logistics sector, reducing the risk of damage during transportation.

The United States Federal Trade Commission has implemented the Fair Packaging and Labelling Act, which mandates the requirement of labels for all consumer commodities. As per this act, the label should contain the net content of the product, product identity, and information about the manufacturer, packer, and distributor. The act further suggests the addition of product ingredients to eliminate consumer deception.

In 2020, The United States Federal Trade Commission implemented a rule on making made-in-the-United States labels for qualified United States-based products. This rule effectively prevents the consumption of illegal products in the country.

Innovations in Printing Technologies to Fuel Label Demand

The United States is expected to showcase a CAGR of 3.4% in the label business through 2033. Labels are expected to be selected based on aspects such as durability, appearance, and application requirements.

A handful of popular label printing methods include flexographic, offset, digital, gravure, and letterpress printing. Each technique has its own advantages in terms of quality, speed, and cost-effectiveness.

Innovations in printing technology, such as smart labels (incorporating RFID, NFC, and QR codes) and digital printing, have significantly impacted label sales. These are set to allow for personalization, better traceability, and interaction. The need for sustainable labeling solutions is also increasing with growing environmental awareness.

Labels must meet a variety of regulatory necessities, especially in sectors such as food & beverages and pharmaceuticals, where precise and transparent labeling is vital to ensure customer safety and comply with legal standards. Consumer behavioral trends, such as demands for convenience, personalization, and merchandise traceability, would influence label design and functionality.

The label business is competitive, with both domestic and foreign companies vying for share. Quality, pricing, innovation, and client service are all driving forces in competition. Labels are anticipated to be a vital part of the packaging process and supply chain. As effective labeling solutions are essential to identify, track, and engage consumers, their demand can expand.

Labels are also powerful tools for marketing and branding. Labels that are distinctive and pleasing to the eye make products stand out on store shelves and communicate brand identity. In the label business, ongoing research and development activities are concentrated on developing technologies, new products, and solutions to address shifting demands and difficulties.

2018 to 2022 United States Label Business Vs. 2023 to 2033 Demand Forecast

The United States label business recorded a CAGR of 2.7% during the historical period from 2018 to 2022. It reached a value of US$ 15.0 billion in 2022 from US$ 13.5 billion in 2018.

Historical CAGR (2018 to 2022) 2.7%
Historical Value (2022) US$ 15.0 billion

Digital printing has completely changed how labels are produced, enabling shorter print runs, more affordable personalization, and quicker turnaround times. This trend started in the early 2020s and continues to surge.

Sustainability has become a key priority in the label space, driven by the high customer demand and ecological concerns. This has led to the growth and adoption of environmentally friendly label materials.

The integration of radio frequency identification (RFID) technology and smart labels is expanding, providing features such as authentication, tracking, and interface with digital devices. The application of stricter guidelines, especially in sectors such as food and pharmaceuticals, has affected labeling requirements. This includes nutritional information, allergen declaration, and serial number.

Growing concerns about counterfeiting have increased the attention to incorporating security aspects into labels, such as special inks, holograms, and tamper-proof seals. Advancements in printing technology have made personalizing labels easier, allowing brands to generate unique and attractive packaging.

There is now a greater demand for labels well suited for online sales due to the expansion of e-commerce and the advent of direct-to-consumer (DTC) companies. Label substrates that offer higher tensile strength, adhesion, and ecological sustainability have been developed as a result of innovations in material research.

Ismail Sutaria
Ismail Sutaria

Principal Consultant

Talk to Analyst

Find your sweet spots for generating winning opportunities in this market.

Semi-annual Sales Update

The table presents the expected CAGR for the United States label business over several semi-annual periods spanning from 2022 to 2033. In the first half (H1) of the decade from 2022 to 2032, the business is expected to surge at a CAGR of 4.1%, followed by a slightly lower growth rate of 2.9% in the second half (H2) of the same decade.

Moving into the subsequent period, from H1 2023 to H2 2033, the CAGR is projected to increase slightly to 3.9% in the first half and remain moderate at 2.8% in the second half. These values offer insights into the anticipated growth trends for the United States label business, aiding stakeholders and investors in making informed decisions regarding investments & strategies.

Particular Value-based CAGR
H1 (2022 to 2032) 4.1%
H2 (2022 to 2032) 2.9%
H1 (2023 to 2033) 3.9%
H2 (2023 to 2033) 2.8%

Trends, Opportunities, and Challenges in the United States Label Space

The table below provides the latest trends observed in the United States label space, growth obstacles, and upcoming opportunities. Business strategies for pushing label sales in the United States would enable stakeholders to invest in the right area and gain profit.

Attributes Key Factors
Latest Trends
  • Sustainable and Environmentally Friendly Label: The demand for sustainable and ecologically friendly label materials is increasing. Consumers are looking for product labels made from renewable or recycled materials.
  • Digital Printing Technology: Digital printing continues to be popular in the label business. This technology permits shorter print times, customization, and compact setup costs compared to traditional printing methods.
  • Smart Label and QR Codes: The incorporation of technologies into labels, such as NFC and QR codes, is increasing. These smart labels allow customers to access product information or cooperate with brands online.
  • Personalization: The demand for customized and personalized labels is increasing. This trend is especially evident in businesses such as food & beverage, where exclusive packaging and labeling can help goods stand out on the shelf.
  • Labeling Law and Regulatory Compliance: Companies are maintaining the focus on adhering to labeling laws, which include those pertaining to nutritional data, allergen declarations, and other mandatory information.
Upcoming Opportunities
  • Sustainable Labeling Solutions: The demand for eco-friendly and sustainable labeling materials is increasing with growing ecological awareness. Producers can capitalize on this trend by providing labels made of recycled or renewable materials.
  • Smart Label and IoT Integration: Label technology integration, including RFID and NFC, has enormous development potential. Features such as tracking, authentication, and real-time data access on smart labels can offer value.
Challenges
  • Rising Raw Material Costs: Volatility in raw material prices, especially paper, adhesives, and inks, can affect the profit margins and production costs of label manufacturers.
  • Regulatory Changes and Compliance Costs: Manufacturers would need help due to frequent modifications in labeling regulations and compliance requirements, particularly if they create labels for pharmaceutical and food businesses with stringent labeling necessities.
  • Competition from Alternative Packaging Solutions: Alternative packaging options, such as flexible packaging, compete with labels, which can offer savings, convenience, or ecological benefits that can be difficult to obtain.
  • Technological Disruption: Rapid technical advancements, such as those in digital printing and smart packaging, would necessitate spending money on new tools and training, which could be prohibitive for a handful of companies.

Get the data you need at a Fraction of the cost

Personalize your report by choosing insights you need
and save 40%!

Comparative View of Adjacent United States Label Businesses

The section covers a comparative view of three businesses similar to the United States label business. As per estimations, the United States label ecosystem would lead out of the three adjacent sectors. The business for the United States label is set to reach a valuation of US$ 15.7 billion by 2023. In-mold healthcare and laboratory label businesses are projected to reach US$ 1,133.4 million and US$ 9.59 billion, respectively, in 2023.

Factors Pushing Label Demand in the United States:

CAGR (2023 to 2033) 3.4%
Value (2023) US$ 15.7 billion
Growth Factor Protection against counterfeiting and tampering drives sales of labels.
Key Trend Adoption of QR codes, RFIDs, and barcodes to track and gather information about the products by the consumer is a key trend.

Key Trends in the In-mold Label Business Landscape:

CAGR (2023 to 2033) 3.3%
Value (2023) US$ 1,133.4 million
Growth Factor In-mold labels are set to provide practical branding tools for manufacturers and improve the packaging design.
Key Trend The growing adoption of digital printers would help improve production rates and flexibility, thereby expanding the sales of in-mold labels.

Opportunities in the Healthcare and Laboratory Label Space:

CAGR (2023 to 2033) 4.5%
Value (2023) US$ 9.59 billion
Growth Factor Strict regulations in the healthcare system and a growing emphasis on patient safety would improve the healthcare and laboratory label sector.
Key Trend The integration of digital technologies in laboratory labels to obtain real-time data and quick responses to patient health issues is a leading trend.

Category-wise Insights

The table below highlights the demand for labels in the United States by product and material. Under material, the plastic segment will likely remain dominant and expand at a CAGR of 2.9% in the assessment period. The pressure-sensitive label segment is set to showcase a significant CAGR of 3.6% through 2033 in the field of labels in the United States in terms of products.

Segment Value CAGR
Pressure Sensitive Label (Product) 3.6%
Plastic (Material) 2.9%

Pressure Sensitive Labels Dominate the United States Label Business

Among the several types of labels, pressure-sensitive labels are set to dominate with around 3/4th share in the United States in 2023. This dominance is attributed to the fact that they have broad compatibility and do not require additional glue to stick the label. As they are adaptable to diverse temperature ranges and other environmental conditions, they are projected to be used in diverse applications.

Pressure-sensitive labels make up a substantial portion of the label space in the United States. Their popularity depends on factors such as ease of use, appropriateness for a variety of applications, and advancements in printing technology.

Pressure-sensitive labels are expected to be manufactured from a variety of materials, including paper, film, and specialty materials. They can vary from standard paper labels to sturdy synthetic films such as polypropylene, vinyl, and polyester.

The adhesive layer is set to be an essential component of pressure-sensitive labels. Its ability to stick to several surfaces, including plastic, glass, metal, and paper, would push their demand.

Adhesives can vary in terms of adhesion, durability, and suitability for precise applications. Flexible, digital, and offset printing are projected to be commonly used to produce pressure-sensitive labels. Each method has distinct cost, print quality, and speed advantages.

Plastic Labels to Hold a Prominent Share in the United States Label Ecosystem

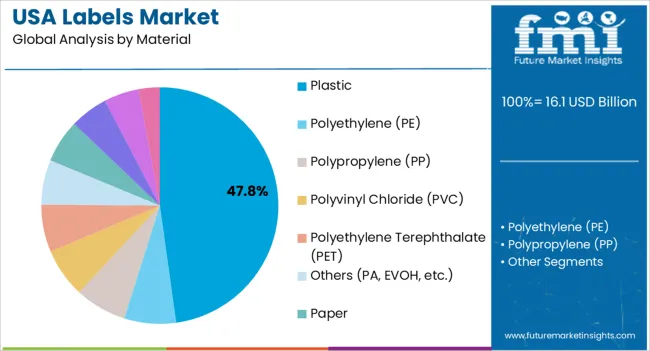
Plastic labels are anticipated to dominate at a CAGR of 2.9% by 2033 in the United States label space. Adopting recyclable, reusable, and bio-based plastic further enhances the growth of plastic-based labels. Food and beverage companies are expected to adopt plastic labels as these offer a lower production cost and withstand multiple temperature ranges.

PET-based plastic labels are expected to gain momentum as these contain inert materials and do not contaminate food & beverage items. The paper-based label category is expected to hold more than 1/4th of the share by 2033.

The durability of plastic labels to chemicals, moisture, and extreme ecological conditions is well recognized. They are set to be appropriate for goods that will probably be subjected to hostile situations.

Plastic labels also offer design capabilities and top-notch graphics, enabling precise branding, product details, and eye-catching appeal. Plastic labels are projected to include variable data, including particular information such as barcodes, serial numbers, QR codes, and promotional codes.

Environmentally friendly plastic labeling options, such as those with labels composed of biodegradable or recycled materials, are becoming highly popular. Several producers are selling plastic labels in the highly competitive United States space. Leading businesses would differentiate themselves from the competition via innovation, quality, and customer service.

Competitive Landscape

The United States, a developed nation with a diverse industrial presence, observes a state-wide variety of customer behavioral patterns and labeling trends. United States-based labeling companies primarily focus on improving the packaging security and aesthetics of the package.

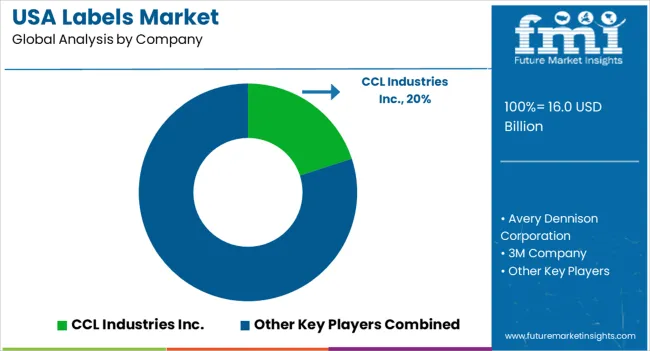
Prominent companies in this ecosystem include CCL Industries, Avery Dennison Corporation, 3M Company, Fuji Seal International Inc., Huhtamaki Oyj, Multi Colour Corporation, Amcor Plc, Mondi Plc, Brady Corporation, UPM Rafklatac, Edward Label Inc., Walle Corporation, and Weber Packaging Inc.

Key players are gaining value by developing innovations and advancements in the label business. Recent activities and mergers implemented by leading players in the business are:

  • In July 2023, Huhtamaki OYJ invested US$ 30 million in Texas to establish a new manufacturing facility.
  • In April 2023, SATO announced the launch of the CT4-LX-HC, its new smart 4-inch label printer for the healthcare sector.
  • In June 2023, UPM Raflatac launched Rêverie 3, a collection of wine, spirits, and beverage label materials with recycled fibers.

Scope of the Report

Attribute Details
Estimated United States Label Revenue (2023) US$ 15.7 billion
Projected United States Label Revenue (2033) US$ 21.9 billion
Value-based CAGR (2023 to 2033) 3.4%
Historical Data 2018 to 2022
Forecast Period 2023 to 2033
Quantitative Units Value in US$ million and Volume in Sq. Meter
Report Coverage Revenue Forecast, Volume Forecast, Company Ranking, Competitive Landscape, Growth Factors, Trends and Pricing Analysis
Segments Covered
  • Material
  • Product
  • Label Category
  • Ink Type
  • Printing Technology
  • End Use
  • Sub-region
Key Sub-regions Covered
  • Northeast
  • Southwest
  • West
  • Southeast
  • Midwest
Key Companies Profiled
  • CCL Industries
  • Multi-Color Corporation
  • Avery Dennison
  • 3M Company
  • Fuji Seal International, Inc.
  • Huhtamaki Oyj
  • Amcor Plc.
  • Klöckner Pentaplast Europe GmbH & Co. KG
  • Honeywell International Inc
  • Mondi Plc
  • Lintec Corporation
  • UPM Raflatac
  • BRADY Corporation
  • Sato Holding Corporation
  • Weber Packaging Solutions Inc.
  • Derksen & Sons Company
  • Traco Manufacturing, Inc.
  • Sigma Aldrich Corporation
  • Edwards Label, Inc.
  • Resource Label Group, LLC

United States Label Industry Outlook by Category

By Material:

  • Plastic
    • Polyethylene (PE)
    • Polypropylene (PP)
    • Polyethylene Terephthalate (PET)
    • Others (PA, EVOH)
  • Paper
    • Kraft Paper
    • Recycled Paper
  • Aluminum

By Product:

  • Pressure Sensitive Label
  • Shrink Label
  • Stretch Label
  • Wet Glue Label
  • Others (In-mold, Pre-gummed)

By Label Category:

  • Warning/Security Label
  • Equipment Asset Label
  • Weatherproof Label
  • Branding Label

By Ink Type:

  • Solvent-based
  • Water-based
  • UV-based
  • Others (Bio-based, Oil-based)

By Printing Technology:

  • Flexographic
  • Digital
  • Gravure
  • Offset
  • Letterpress

By End Use:

  • Food
    • Bakery and Confectionery
    • Dairy
    • Baby Food
    • Chilled/Frozen Food
    • Others (Snacks, Pet Food)
  • Beverages
    • Alcoholic Beverages
    • Non-alcoholic Beverages
  • Healthcare
    • Medical Devices
    • Medical Supplies
    • Pharma and Biological
  • Cosmetics and Personal Care
  • Homecare and Toiletries
  • Chemicals
  • Automobile
  • Other Industrial

By Sub-region:

  • Northeast
  • Southwest
  • West
  • Southeast
  • Midwest

Frequently Asked Questions

What is the United States label business outlook?

The business expanded at a CAGR of 3.4% from 2023 to 2033.

What was the worth of the United States label ecosystem in 2022?

The worth of the United States label ecosystem in 2022 was US$ 15.0 billion.

In 2033, what will the size of the United States label be?

In 2033, the United States label ecosystem is anticipated to reach US$ 21.9 billion.

What is the key driver for the United States label space?

The rise of counterfeiting in the pharmaceutical sector would create new opportunities.

Who are the top 3 players operating in the United States label business?

The top 3 players operating are CCL Industries, Avery Dennison, and 3M Company.

Table of Content

1. Executive Summary

    1.1. Outlook

    1.2. Analysis

    1.3. Analysis and Recommendations

2. Overview

    2.1. Coverage / Taxonomy

    2.2. Definition / Scope / Limitations

3. Trends

    3.1. Key Trends

    3.2. Product Innovation / Development Trends

4. Key Success Factors

    4.1. Product Adoption / Usage Analysis

    4.2. Product USPs / Features

    4.3. Strategic Promotional Strategies

5. Demand Analysis 2018 to 2022 and Forecast, 2023 to 2033

    5.1. Historical Volume (Billion Sq. meter) Analysis, 2018 to 2022

    5.2. Current and Future Volume (Billion Sq. meter) Projections, 2023 to 2033

    5.3. Y-o-Y Growth Trend Analysis

6. Pricing Analysis

    6.1. Pricing Analysis

    6.2. Average Pricing Analysis Benchmark

7. Demand (in Value or Size in US$ Billion) Analysis 2018 to 2022 and Forecast, 2023 to 2033

    7.1. Historical Value (US$ Billion) Analysis, 2018 to 2022

    7.2. Current and Future Value (US$ Billion) Projections, 2023 to 2033

        7.2.1. Y-o-Y Growth Trend Analysis

        7.2.2. Absolute $ Opportunity Analysis

8. Background

    8.1. Parent Overview

    8.2. Macro-Economic Factors

    8.3. Forecast Factors - Relevance and Impact

    8.4. Value Chain

        8.4.1. Raw Product Suppliers

        8.4.2. Manufacturers

        8.4.3. Category

    8.5. Case Based Scenario – Impact Assessment

        8.5.1. Current Statistics

        8.5.2. Short-Mid-Long Term Outlook

        8.5.3. Likely Rebound

    8.6. Dynamics

        8.6.1. Drivers

        8.6.2. Restraints

        8.6.3. Opportunity Analysis

9. Analysis 2018 to 2022 and Forecast 2023 to 2033, By Material

    9.1. Introduction / Key Findings

    9.2. Historical Size Value (US$ Billion) & Volume (Billion Sq. meter) Analysis By Material, 2018 to 2022

    9.3. Current and Future Size Value (US$ Billion) & Volume (Billion Sq. meter) Analysis and Forecast By Material, 2023 to 2033

        9.3.1. Plastic

            9.3.1.1. Polyethylene (PE)

            9.3.1.2. Polypropylene (PP)

            9.3.1.3. Polyethylene Terephthalate (PET)

            9.3.1.4. Others (PA, EVOH)

        9.3.2. Paper

            9.3.2.1. Kraft Paper

            9.3.2.2. Recycled Paper

        9.3.3. Aluminium

    9.4. Y-o-Y Growth Trend Analysis By Material, 2018 to 2022

    9.5. Absolute $ Opportunity Analysis By Material, 2023 to 2033

10. Analysis 2018 to 2022 and Forecast 2023 to 2033, By Product

    10.1. Introduction / Key Findings

    10.2. Historical Size Value (US$ Billion) & Volume (Billion Sq. meter) Analysis By Product, 2018 to 2022

    10.3. Current and Future Size Value (US$ Billion) & Volume (Billion Sq. meter) Analysis and Forecast By Product, 2023 to 2033

        10.3.1. Pressure Sensitive Label

        10.3.2. Shrink Label

        10.3.3. Stretch Label

        10.3.4. Wet Glue Label

        10.3.5. Others (In-mold, Pre-gummed)

    10.4. Y-o-Y Growth Trend Analysis By Product, 2018 to 2022

    10.5. Absolute $ Opportunity Analysis By Product, 2023 to 2033

11. Analysis 2018 to 2022 and Forecast 2023 to 2033, By Category

    11.1. Introduction / Key Findings

    11.2. Historical Size Value (US$ Billion) & Volume (Billion Sq. meter) Analysis By Category, 2018 to 2022

    11.3. Current and Future Size Value (US$ Billion) & Volume (Billion Sq. meter) Analysis and Forecast By Category, 2023 to 2033

        11.3.1. Warning/Security Label

        11.3.2. Equipment Asset Label

        11.3.3. Weatherproof Label

        11.3.4. Branding Label

    11.4. Y-o-Y Growth Trend Analysis By Category, 2018 to 2022

    11.5. Absolute $ Opportunity Analysis By Category, 2023 to 2033

12. Analysis 2018 to 2022 and Forecast 2023 to 2033, By Ink Type

    12.1. Introduction / Key Findings

    12.2. Historical Size Value (US$ Billion) & Volume (Billion Sq. meter) Analysis By Ink Type, 2018 to 2022

    12.3. Current and Future Size Value (US$ Billion) & Volume (Billion Sq. meter) Analysis and Forecast By Ink Type, 2023 to 2033

        12.3.1. Solvent-based

        12.3.2. Water-based

        12.3.3. UV-based

        12.3.4. Others (Bio-based, Oil-based)

    12.4. Y-o-Y Growth Trend Analysis By Ink Type, 2018 to 2022

    12.5. Absolute $ Opportunity Analysis By Ink Type, 2023 to 2033

13. Analysis 2018 to 2022 and Forecast 2023 to 2033, By Printing Technology

    13.1. Introduction / Key Findings

    13.2. Historical Size Value (US$ Billion) & Volume (Billion Sq. meter) Analysis By Printing Technology, 2018 to 2022

    13.3. Current and Future Size Value (US$ Billion) & Volume (Billion Sq. meter) Analysis and Forecast By Printing Technology, 2023 to 2033

        13.3.1. Flexographic

        13.3.2. Digital

        13.3.3. Gravure

        13.3.4. Offset

        13.3.5. Letterpress

    13.4. Y-o-Y Growth Trend Analysis By Printing Technology, 2018 to 2022

    13.5. Absolute $ Opportunity Analysis By Printing Technology, 2023 to 2033

14. Analysis 2018 to 2022 and Forecast 2023 to 2033, By End Use

    14.1. Introduction / Key Findings

    14.2. Historical Size Value (US$ Billion) & Volume (Billion Sq. meter) Analysis By End Use, 2018 to 2022

    14.3. Current and Future Size Value (US$ Billion) & Volume (Billion Sq. meter) Analysis and Forecast By End Use, 2023 to 2033

        14.3.1. Food

            14.3.1.1. Bakery and Confectionaries

            14.3.1.2. Dairy

            14.3.1.3. Baby Food

            14.3.1.4. Chilled/Frozen Food

            14.3.1.5. Others (Snacks, Pet Food)

        14.3.2. Beverages

            14.3.2.1. Alcoholic Beverage

            14.3.2.2. Non-alcoholic Beverage

        14.3.3. Healthcare

            14.3.3.1. Medical Devices

            14.3.3.2. Medical Supplies

            14.3.3.3. Pharma and Biological

        14.3.4. Cosmetics and Personal Care

        14.3.5. Homecare and Toiletries

        14.3.6. Chemicals

        14.3.7. Automobiles

        14.3.8. Others Industrial

    14.4. Y-o-Y Growth Trend Analysis By End Use, 2018 to 2022

    14.5. Absolute $ Opportunity Analysis By End use, 2023 to 2033

15. Analysis 2018 to 2022 and Forecast 2023 to 2033, By Sub-region

    15.1. Introduction / Key Findings

    15.2. Historical Size Value (US$ Billion) & Volume (Billion Sq. meter) Analysis By Sub-region, 2018 to 2022

    15.3. Current and Future Size Value (US$ Billion) & Volume (Billion Sq. meter) Analysis and Forecast By Sub-region, 2023 to 2033

        15.3.1. Flexographic

        15.3.2. Digital

        15.3.3. Gravure

        15.3.4. Offset

        15.3.5. Letterpress

    15.4. Y-o-Y Growth Trend Analysis By Sub-region, 2018 to 2022

    15.5. Absolute $ Opportunity Analysis By Sub-region, 2023 to 2033

16. Northeast Analysis 2018 to 2022 and Forecast 2023 to 2033

    16.1. Introduction / Key Findings

    16.2. Historical Size Value (US$ Billion) & Volume (Billion Sq. meter) Analysis 2018 to 2022

    16.3. Current and Future Size Value (US$ Billion) & Volume (Billion Sq. meter) Analysis and Forecast 2023 to 2033

        16.3.1. Material

        16.3.2. Product

        16.3.3. Category

        16.3.4. Ink Type

        16.3.5. Printing Technology

        16.3.6. End Use

    16.4. Attractiveness Analysis

        16.4.1. Material

        16.4.2. Product

        16.4.3. Category

        16.4.4. Ink Type

        16.4.5. Printing Technology

        16.4.6. End Use

17. Southwest Analysis 2018 to 2022 and Forecast 2023 to 2033

    17.1. Introduction / Key Findings

    17.2. Historical Size Value (US$ Billion) & Volume (Billion Sq. meter) Analysis 2018 to 2022

    17.3. Current and Future Size Value (US$ Billion) & Volume (Billion Sq. meter) Analysis and Forecast 2023 to 2033

        17.3.1. Material

        17.3.2. Product

        17.3.3. Category

        17.3.4. Ink Type

        17.3.5. Printing Technology

        17.3.6. End Use

    17.4. Attractiveness Analysis

        17.4.1. Material

        17.4.2. Product

        17.4.3. Category

        17.4.4. Ink Type

        17.4.5. Printing Technology

        17.4.6. End Use

18. West Analysis 2018 to 2022 and Forecast 2023 to 2033

    18.1. Introduction / Key Findings

    18.2. Historical Size Value (US$ Billion) & Volume (Billion Sq. meter) Analysis 2018 to 2022

    18.3. Current and Future Size Value (US$ Billion) & Volume (Billion Sq. meter) Analysis and Forecast 2023 to 2033

        18.3.1. Material

        18.3.2. Product

        18.3.3. Category

        18.3.4. Ink Type

        18.3.5. Printing Technology

        18.3.6. End Use

    18.4. Attractiveness Analysis

        18.4.1. Material

        18.4.2. Product

        18.4.3. Category

        18.4.4. Ink Type

        18.4.5. Printing Technology

        18.4.6. End Use

19. Southeast Analysis 2018 to 2022 and Forecast 2023 to 2033

    19.1. Introduction / Key Findings

    19.2. Historical Size Value (US$ Billion) & Volume (Billion Sq. meter) Analysis 2018 to 2022

    19.3. Current and Future Size Value (US$ Billion) & Volume (Billion Sq. meter) Analysis and Forecast 2023 to 2033

        19.3.1. Material

        19.3.2. Product

        19.3.3. Category

        19.3.4. Ink Type

        19.3.5. Printing Technology

        19.3.6. End Use

    19.4. Attractiveness Analysis

        19.4.1. Material

        19.4.2. Product

        19.4.3. Category

        19.4.4. Ink Type

        19.4.5. Printing Technology

        19.4.6. End Use

20. Midwest Analysis 2018 to 2022 and Forecast 2023 to 2033

    20.1. Introduction / Key Findings

    20.2. Historical Size Value (US$ Billion) & Volume (Billion Sq. meter) Analysis 2018 to 2022

    20.3. Current and Future Size Value (US$ Billion) & Volume (Billion Sq. meter) Analysis and Forecast 2023 to 2033

        20.3.1. Material

        20.3.2. Product

        20.3.3. Category

        20.3.4. Ink Type

        20.3.5. Printing Technology

        20.3.6. End Use

    20.4. Attractiveness Analysis

        20.4.1. Material

        20.4.2. Product

        20.4.3. Category

        20.4.4. Ink Type

        20.4.5. Printing Technology

        20.4.6. End Use

21. Structure Analysis

    21.1. Analysis by Tier of Companies (Label)

    21.2. Share Analysis of Top Players

    21.3. Presence Analysis

22. Competition Analysis

    22.1. Competition Dashboard

    22.2. Competition Benchmarking

    22.3. Competition Deep Dive

        22.3.1. CCL Industries

            22.3.1.1. Overview

            22.3.1.2. Product Portfolio

            22.3.1.3. Profitability by Segments (Material/Product/Ink Type)

            22.3.1.4. Sales Footprint

            22.3.1.5. Strategy Overview

                22.3.1.5.1. Strategy

                22.3.1.5.2. Product Strategy

                22.3.1.5.3. Channel Strategy

        22.3.2. Multi-Color Corporation

            22.3.2.1. Overview

            22.3.2.2. Product Portfolio

            22.3.2.3. Profitability by Segments (Material/Product/Ink Type)

            22.3.2.4. Sales Footprint

            22.3.2.5. Strategy Overview

                22.3.2.5.1. Business Strategy

                22.3.2.5.2. Product Strategy

                22.3.2.5.3. Channel Strategy

        22.3.3. Avery Dennison

            22.3.3.1. Overview

            22.3.3.2. Product Portfolio

            22.3.3.3. Profitability by Segments (Material/Product/Ink Type)

            22.3.3.4. Sales Footprint

            22.3.3.5. Strategy Overview

                22.3.3.5.1. Business Strategy

                22.3.3.5.2. Product Strategy

                22.3.3.5.3. Channel Strategy

        22.3.4. 3M Company

            22.3.4.1. Overview

            22.3.4.2. Product Portfolio

            22.3.4.3. Profitability by Segments (Material/Product/Ink Type)

            22.3.4.4. Sales Footprint

            22.3.4.5. Strategy Overview

                22.3.4.5.1. Business Strategy

                22.3.4.5.2. Product Strategy

                22.3.4.5.3. Channel Strategy

        22.3.5. Fuji Seal International Inc.

            22.3.5.1. Overview

            22.3.5.2. Product Portfolio

            22.3.5.3. Profitability by Segments (Material/Product/Ink Type)

            22.3.5.4. Sales Footprint

            22.3.5.5. Strategy Overview

                22.3.5.5.1. Business Strategy

                22.3.5.5.2. Product Strategy

                22.3.5.5.3. Channel Strategy

        22.3.6. Huhtamaki OYJ

            22.3.6.1. Overview

            22.3.6.2. Product Portfolio

            22.3.6.3. Profitability by Segments (Material/Product/Ink Type)

            22.3.6.4. Sales Footprint

            22.3.6.5. Strategy Overview

                22.3.6.5.1. Business Strategy

                22.3.6.5.2. Product Strategy

                22.3.6.5.3. Channel Strategy

        22.3.7. Amcor P

            22.3.7.1. Overview

            22.3.7.2. Product Portfolio

            22.3.7.3. Profitability by Segments (Material/Product/Ink Type)

            22.3.7.4. Sales Footprint

            22.3.7.5. Strategy Overview

                22.3.7.5.1. Business Strategy

                22.3.7.5.2. Product Strategy

                22.3.7.5.3. Channel Strategy

        22.3.8. Klöckner Pentaplast Europe GmbH & Co. KGt

            22.3.8.1. Overview

            22.3.8.2. Product Portfolio

            22.3.8.3. Profitability by Segments (Material/Product/Ink Type)

            22.3.8.4. Sales Footprint

            22.3.8.5. Strategy Overview

                22.3.8.5.1. Business Strategy

                22.3.8.5.2. Product Strategy

                22.3.8.5.3. Channel Strategy

        22.3.9. Honeywell International Inc.

            22.3.9.1. Overview

            22.3.9.2. Product Portfolio

            22.3.9.3. Profitability by Segments (Material/Product/Ink Type)

            22.3.9.4. Sales Footprint

            22.3.9.5. Strategy Overview

                22.3.9.5.1. Business Strategy

                22.3.9.5.2. Product Strategy

                22.3.9.5.3. Channel Strategy

        22.3.10. Mondi Plc.

            22.3.10.1. Overview

            22.3.10.2. Product Portfolio

            22.3.10.3. Profitability by Segments (Material/Product/Ink Type)

            22.3.10.4. Sales Footprint

            22.3.10.5. Strategy Overview

                22.3.10.5.1. Business Strategy

                22.3.10.5.2. Product Strategy

                22.3.10.5.3. Channel Strategy

        22.3.11. Lintec Corporation.

            22.3.11.1. Overview

            22.3.11.2. Product Portfolio

            22.3.11.3. Profitability by Segments (Material/Product/Ink Type)

            22.3.11.4. Sales Footprint

            22.3.11.5. Strategy Overview

                22.3.11.5.1. Business Strategy

                22.3.11.5.2. Product Strategy

                22.3.11.5.3. Channel Strategy

        22.3.12. UPM Raflatac

            22.3.12.1. Overview

            22.3.12.2. Product Portfolio

            22.3.12.3. Profitability by Segments (Material/Product/Ink Type)

            22.3.12.4. Sales Footprint

            22.3.12.5. Strategy Overview

                22.3.12.5.1. Business Strategy

                22.3.12.5.2. Product Strategy

                22.3.12.5.3. Channel Strategy

        22.3.13. BRADY Corporation

            22.3.13.1. Overview

            22.3.13.2. Product Portfolio

            22.3.13.3. Profitability by Segments (Material/Product/Ink Type)

            22.3.13.4. Sales Footprint

            22.3.13.5. Strategy Overview

                22.3.13.5.1. Business Strategy

                22.3.13.5.2. Product Strategy

                22.3.13.5.3. Channel Strategy

        22.3.14. Sato Holdings Corporation

            22.3.14.1. Overview

            22.3.14.2. Product Portfolio

            22.3.14.3. Profitability by Segments (Material/Product/Ink Type)

            22.3.14.4. Sales Footprint

            22.3.14.5. Strategy Overview

                22.3.14.5.1. Business Strategy

                22.3.14.5.2. Product Strategy

                22.3.14.5.3. Channel Strategy

        22.3.15. Weber Packaging Solutions Inc.

            22.3.15.1. Overview

            22.3.15.2. Product Portfolio

            22.3.15.3. Profitability by Segments (Material/Product/Ink Type)

            22.3.15.4. Sales Footprint

            22.3.15.5. Strategy Overview

                22.3.15.5.1. Business Strategy

                22.3.15.5.2. Product Strategy

                22.3.15.5.3. Channel Strategy

        22.3.16. Derksen & Sons Company

            22.3.16.1. Overview

            22.3.16.2. Product Portfolio

            22.3.16.3. Profitability by Segments (Material/Product/Ink Type)

            22.3.16.4. Sales Footprint

            22.3.16.5. Strategy Overview

                22.3.16.5.1. Business Strategy

                22.3.16.5.2. Product Strategy

                22.3.16.5.3. Channel Strategy

        22.3.17. Traco Manufacturing Inc.

            22.3.17.1. Product Portfolio

            22.3.17.2. Profitability by Segments (Material/Product/Ink Type)

            22.3.17.3. Sales Footprint

            22.3.17.4. Strategy Overview

                22.3.17.4.1. Business Strategy

                22.3.17.4.2. Product Strategy

                22.3.17.4.3. Channel Strategy

        22.3.18. Sigma Aldrich corporation

            22.3.18.1. Product Portfolio

            22.3.18.2. Profitability by Segments (Material/Product/Ink Type)

            22.3.18.3. Sales Footprint

            22.3.18.4. Strategy Overview

                22.3.18.4.1. Business Strategy

                22.3.18.4.2. Product Strategy

                22.3.18.4.3. Channel Strategy

        22.3.19. Edwards Inc.

            22.3.19.1. Product Portfolio

            22.3.19.2. Profitability by Segments (Material/Product/Ink Type)

            22.3.19.3. Sales Footprint

            22.3.19.4. Strategy Overview

                22.3.19.4.1. Business Strategy

                22.3.19.4.2. Product Strategy

                22.3.19.4.3. Channel Strategy

        22.3.20. Resource Group LLC

            22.3.20.1. Product Portfolio

            22.3.20.2. Profitability by Segments (Material/Product/Ink Type)

            22.3.20.3. Sales Footprint

            22.3.20.4. Strategy Overview

                22.3.20.4.1. Business Strategy

                22.3.20.4.2. Product Strategy

                22.3.20.4.3. Channel Strategy

 *The above list is indicative in nature and is subject to change during the course of research

23. Assumptions and Acronyms Used

24. Research Methodology

List of Tables

Table 01: Value (US$ Billion) Analysis, by Material, 2018H to 2033F

Table 02: Volume (Billion Sq. meter) Analysis, by Material, 2018H to 2033F

Table 03: Value (US$ Billion) Analysis, by Product, 2018H to 2033F

Table 04: Volume (Billion Sq. meter) Analysis, by Product, 2018H to 2033F

Table 05: Value (US$ Billion) Analysis, by Category 2018H to 2033F

Table 06: Volume (Billion Sq. meter) Analysis, by Category 2018H to 2033F

Table 07: Value (US$ Billion) Analysis, by Ink Type, 2018H to 2033F

Table 08: Volume (Billion Sq. meter) Analysis, by Ink Type, 2018H to 2033F

Table 09: Value (US$ Billion) Analysis, by Printing Technology, 2018H to 2033F

Table 10: Volume (Billion Sq. meter) Analysis, by Printing Technology, 2018H to 2033F

Table 11: Value (US$ Billion) Analysis, by End Use, 2018H to 2033F

Table 12: Volume (Billion Sq. meter) Analysis, by End Use, 2018H to 2033F

Table 13: Value (US$ Billion) Analysis, by Sub-region, 2018H to 2033F

Table 14: Volume (Billion Sq. meter) Analysis, by Sub-region, 2018H to 2033F

List of Charts

Figure 01: Share Analysis by Material, 2023E to 2033F

Figure 02: Y-o-Y Analysis by Material, 2018H to 2033F

Figure 03: Attractiveness Analysis by Material, 2023E to 2033F

Figure 04: Share Analysis by Product, 2023E to 2033F

Figure 05: Y-o-Y Analysis by Product, 2018H to 2033F

Figure 06: Attractiveness Analysis by Product, 2023E to 2033F

Figure 07: Share Analysis by Category 2023E to 2033F

Figure 08: Y-o-Y Analysis by Category 2018H to 2033F

Figure 09: Attractiveness Analysis by Category 2023E to 2033F

Figure 10: Share Analysis by Ink Type, 2023E to 2033F

Figure 11: Y-o-Y Analysis by Ink Type, 2018H to 2033F

Figure 12: Attractiveness Analysis by Ink Type, 2023E to 2033F

Figure 13: Share Analysis by Printing Technology, 2023E to 2033F

Figure 14: Y-o-Y Analysis by Printing Technology, 2018H to 2033F

Figure 15: Attractiveness Analysis by Printing Technology, 2023E to 2033F

Figure 16: Share Analysis by End Use, 2023E to 2033F

Figure 17: Y-o-Y Analysis by End Use, 2018H to 2033F

Figure 18: Attractiveness Analysis by End Use, 2023E to 2033F

Figure 19: Y-o-Y Analysis by Sub-Region, 2018H to 2033F

Figure 20: Attractiveness Analysis by Sub-Region, 2023E to 2033F

Figure 21: Attractiveness Analysis by Sub-region, 2023E to 2033F

Recommendations

Packaging

Label Applicators Market

Published : July 2023

Packaging

In-mold Labels Market

Published : May 2023

Packaging

Healthcare and Laboratory Labels Market

Published : March 2023

Packaging

Label Printers Market

Published : January 2023

Explore Packaging Insights

View Reports

Label Industry Analysis in United States