In-mold Labels Market
Market Insights on In-mold Labels covering sales outlook, demand forecast & up-to-date key trends
In-mold Labels Market By Process (Blow Molding, Injection Molding, Thermoforming), Printing Method (Gravure, Flexo, Offset, Screen, Digital, Others) & Region - Forecast 2021 - 2031
In-mold Labels Market Snapshot
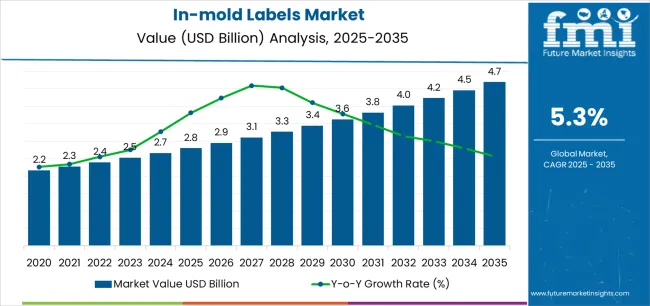
Future Market Insights’ (FMI’s) study on the in-mold labels market has forecast the global consumption of in-mold labels to increase year-on-year (YoY) by 3.2 %, reaching US$ 1.1 Bn in 2021.
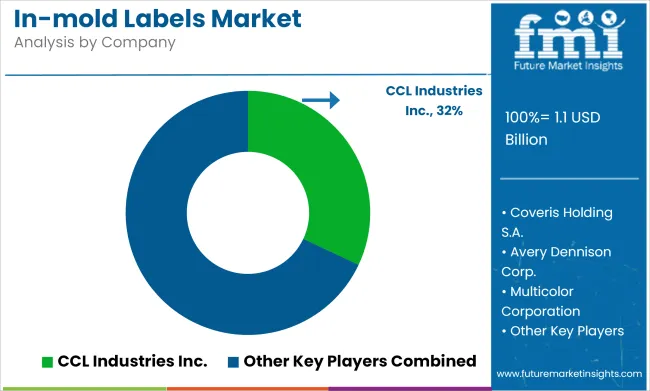
The demand for in-mold labels will continue accelerating through 2031, resulting in high competition. As per the study, top 5 in-mold label providers will account for 15% of the global market in 2021. The global in-mold labels market represented 3% of the ~US$ 42 Bn global label market in 2020.
In-mold Labels Market Estimated Year Value (2021E) |
US$ 1.1 Bn |
In-mold Labels Market Value CAGR (2021-2031) |
3.2% |
In-mold Labels Market Top Players Share (2021) |
15% |
Let us know your requirement to get
100% FREE customization
In-mold Labels Market Outlook for 2021-2031 In Comparison to Sales Registered in 2016-2020
The global market for In-mold labels is expected to continue gaining from the increasing in the food, beverages, pharma, domestic care, and personal care and cosmetics industries. FMI has projected the market to register 3.2% CAGR from 2021 to 2031 in comparison to the 2.3% CAGR registered from 2015 to 2020.
In-mold labels are the paper or plastic labels are attached to a container using different techniques like, injection molding, blow molding and thermoforming. These labels provide “no label look” to the container with the superior graphics representation, creating an attractive aesthetic appeal to the packaging.
In-mold labels also adhere to the principles of sustainability, as they are recyclable and regrindable. These labels have good aesthetic appearance, high durability and require no additional step of gluing process, which is an added advantage over the traditional labels.
They are available for application in different types of surfaces such as matte surfaces, glossy surfaces, and surfaces with the sparkling appearance. These labels are also suitable for the variety of the printing processes such as flexography printing, offset and rotogravure. The labels can also be customized and designed in different specifications and sizes, depending on the customer or manufacturer’s requirements.
Despite challenges witnessed amid COVID-19, the sales of in-mold labels will grow, thanks to recovery of operations in various industries. Also, with the increase in pharmaceutical production activities, the demand for in-mold labels are projected to rise.
How are Expanding Food & Beverages and Pharmaceuticals Industries Affecting In-mold Labels Market Growth?
In-mold labels are attached on the product or the container with the use of the in-mold film which is placed in to the mold. Pre-heated plastic is injected at a high pressure when the mold opens and finally the container is decorated with the label.
These labels are highly preferred in the food & beverages industry as they provide the aesthetic appearance to the product by customizing the printing surface, which eventually gives an attractive makeover to the product.
In-mold labeling process has various advantages, especially when used for application on the packaging of frozen products. In-mold labels don’t get eventually wet and damaged compared to the traditional labels which are attached with the application of glue.
In-mold labels are also preferred in the pharmaceutical industry, especially in the cryo pharmaceutical products like vaccines, antibiotics, and others, which are sensitive to the temperature changes or fluctuations. In-mold labels in the cryo pharmaceutical products allow excellent durability, improved product specifications and improved adherence property to the container. The outbreak of the COVID-19 pandemic has increased the production of the in-mold labels owing to the increase in the production of vaccines and related pharmaceutical products.
Thus, increase in the expansion of the pharmaceutical industry is forecast to boost the demand for the in-mold labels in the labelling of the cryo pharmaceutical products.
Find your sweet spots for generating winning opportunities in this market.
Talk to AnalystWhat is Fuelling the Demand in In-mold Labels Market?
Injection molding process and in-mold labeling machines used for the purpose of manufacturing enable faster and greater efficiency in production as compared to other printing processes. Implementation of in-mold labeling processes and machines that rely on recycled materials has been identified as a sustainable manufacturing move.
This also eventually leads to the decrease in the pollution along with the achievement in the efficiency in the production. Thus, the innovative food-grade un-mold labels are gaining worldwide popularity, creating immense growth opportunities for the market.
What is the Impact of COVID-19 on the Global Market for In-mold labels?
The COVID-19 pandemic had an adverse impact on the in-mold labels market as the declined during due to various factors. Decelerating sales of in-mold labels is attributable to the slowdown in operation of various end-use industries along with a disrupted supply chain.
The food, beverages, personal care & cosmetics, and other industries registered losses due to various government restriction on operating with full efficiency, improper supply chain, availability of raw material, and other which impacts the growth of In-mold labels market.
However following vaccination drives, stringent restrictions were withdrawn. Visible reduction in COVID-19 cases gradually helped the industries to return to normalcy. The shipping & logistics sector also started to experience a rise in demand due to increasing trade activities that supplemented the sales of in-mold labels for sealing purposes.

A unified Market Research Subscription Platform, built for today's disparate research needs.
Country-wise Insights
What is driving the U.S. In-mold Labels Market?
The United States is estimated to remain the most lucrative market in North America in-mold labels market. The United States holds around 90% of the market share for the North America. Backed by the presence of well-established food and pharmaceutical infrastructure, the country will offer opportunities for steady growth of the in-mold labels market.
Increasing focus on offering advanced packaging solutions that do not compromise with the aesthetic appeal of products will push the use of in-mold labels in the U.S.
Why is Demand Rising in Germany In-mold Labels Market?
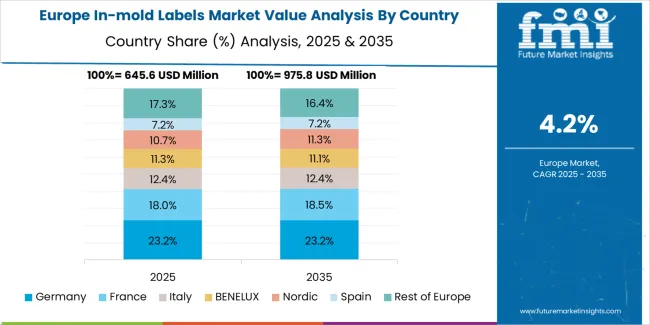
The leading share of the Europe in-mold labels market is held by Germany. As per FMI, Germany is anticipated to hold around 20% of the market share by the end of 2031. Also, it is anticipated to create an incremental opportunity of US$ 15 Mn during 2021-2031.
According to the Food and Agriculture Organization (FAO), Germany is the top country involved in the organic farming and marketing of the healthcare products. Therefore, this indicates the need for eco-labels for the packaging of the products. The recyclable nature of the in-mold labels is expected to encourage their application in the labelling of the eco-friendly products.
How will China In-mold Labels Market Fare?
The China market for in-mold labels is anticipated to expand by 1.6x the current market value in the next ten years along with creating an incremental opportunity for US$ 28 Mn. China holds lead in the APEJ in-mold labels market and is expected to remain dominant through the course of the forecast period.
According to the Food and Agricultural Organization of the United Nations, in 2020, China produced of one fourth of world’s grain output. The growing agricultural practices will propel the demand for effective packaging solution in the food industry. This will offer attractive prospects for the growth of in-mold labels market in China.
Will India In-mold Labels Market Exhibit Strong Growth?
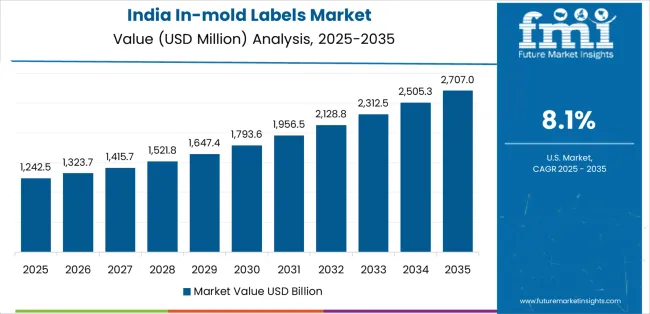
In-mold labels market in India is expected to create incremental opportunities of US$ 27 Mn by 2031. The expanding food & beverages sector in India is estimated to create growth opportunity for n-mold labels market during the forecast period.
According to the India Brand Equity Foundation (IBEF), India ranks third in terms of the pharmaceutical production by volume and fourteenth by value. The Indian pharmaceutical sector supplies over 50% of the global demand for various vaccines, 40% of generic demand in the U.S., and 25% of the medicines in the U.K.
Therefore, the expanding pharmaceutical industry in India is forecast to create ample opportunities for sales in the in-mold labels market.
Category-wise Insights
Will Polypropylene (PP) Remain the Preferred Material for In-mold Labels?
Based on the material type, the polypropylene (PP) in-mold labels segment holds the leading share in the market. The target segment is anticipated to hold approximately a 4/5th of the market share by the end of 2031.
Polypropylene (PP) is inexpensive in nature as compared to the other materials used in the manufacturing of the in-mold labels. The price of the polypropylene (PP) along with the high strength and excellent resistance are expected to result in their higher use for in-mold labels manufacturing.
Which is the Highly Sought-after In-mold Labels Process?
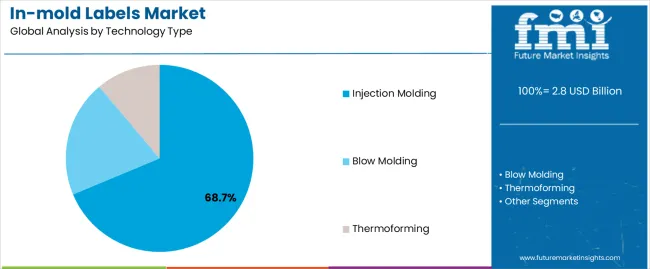
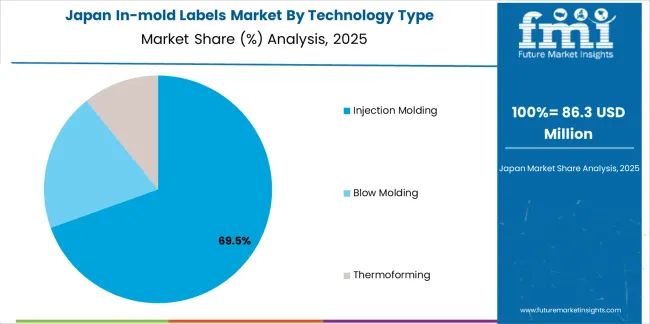
Based on process, injection moulding is expected to remain the leading segment owing to the fast and efficient production along with the high output. The target segment is projected to expand at a CAGR of 3.3% during 2021-2031 along with creating an incremental opportunity of US$ 245 Mn.
Which Printing Method is Most Preferred in In-mold Labels Market?
In terms of printing method, offset printing segment followed by Flexo and Gravure are anticipated to be the preferred printing methods in the in-mold labels market. These segments collectively are projected to hold around 83% of the market share in the forecasted period.
Who is the Leading In-mold Labels End User?
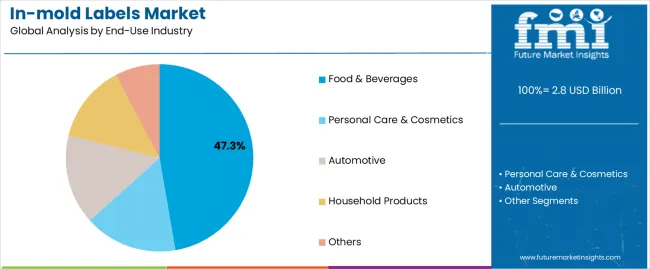
In terms of end use, the food sector is estimated to be dominant, followed by the beverage segment. The target segment is projected to create an incremental opportunity of US$ 164 Mn during the forecasted period. Demand for in-mold labels in the food industry is to expand 1.3x times the current market value by the end of 2031.
Competitive Landscape
Some of the leading in-mold labels market players are trying to focus on increasing their production capacity and are keen on research & development initiatives to meet the increasing demand for In-mold labels in industries such as food, beverages, pharmaceuticals, cosmetics and personal care and others. Moreover, the key players are increasing their product portfolio to cater for the growing market.
- In September 2021, CMG Plastics from the U.S. has announced expansion of in-mold labelling capabilities to fulfil increasing demand for these labels among customers.
- In April 2021, Australia based company, Herrods is acquired by Multi-Color Corporation (MCC). Herrods is one of the leading provider of in-mold labels in Australia and New Zealand markets. With the help of additional capacity of Herrods, MCC is planning to serve new and existing customers in Australia and New Zealand.
- In April 2021, Muller Technology, on eof the specialist for manufacturing in-mold labels has launched a new IML automation system
- In June 2021, Inland Packaging, a label and packaging manufacturer in the U.S. has established 40,000 SqFt facility for increasing production of in-mold labels for the CPG consumers of the company.
Scope of Report
Attribute |
Details |
Forecast Period |
2021-2031 |
Historical Data Available for |
2014-2020 |
Market Analysis |
US$ Million for Value and Thousand Square Meters (‘000 Sq. M) |
Key Regions Covered |
North America, Latin America, Western Europe, Eastern Europe, APEJ, Japan and Middle-East & Africa (MEA). |
Key Countries Covered |
US, Canada, Brazil, Mexico, Germany, Italy, France, U.K., Spain, Russia, GCC Countries, China, Japan, India, and Australia |
Key Segments Covered |
Process, Material, Printing Method, End-use and Region |
Key Companies Profiled |
|
Report Coverage |
Market Forecast, Company Share Analysis, Competition Intelligence, DROT Analysis, Market Dynamics and Challenges, and Strategic Growth Initiatives |
Customization & Pricing |
Available upon Request |
In-mold Labels Market by Category
By Process:
- Blow Molding
- Injection Molding
- Thermoforming
By Material:
- Polypropylene (PP)
- Polyethylene terephthalate (PET)
- Polystyrene (PS)
- Polyethylene (PE)
- Barrier
- Paper & Others
By Printing Method:
- Gravure
- Flexo
- Offset
- Screen
- Digital
- Others
By End-use:
- Food
- Beverage
- Pharmaceuticals
- Domestic Care
- Personal Care & Cosmetics
- Others
By Region:
- North America
- Latin America
- Western Europe
- Eastern Europe
- APEJ
- Japan
- Middle East and Africa (MEA)
Frequently Asked Questions
What is the In-mold labels current market valuation?
The in-mold labels market is expected to reach a valuation of US$ 1.1 Bn by 2021.
At what rate did the global market for in-mold labels expand in the last 5 years?
The global market for in-mold labels grew by 2.3% CAGR in the last five years from 2015 to 2020.
At what rate will the use of in-mold labels rise?
As per FMI, the global market for in-mold labels is projected to expand at a CAGR of 3.2% between 2021 and 2031.
What are the key trends driving the global in-mold labels market?
Kkey players operating in the in-mold labels market are making the use of injection moulding process to increase the speed of production as well as to improve the product efficiency. The manufacturers are focusing on the use of 100% recyclable material while manufacturing of the in-mold labels which will improve the printing processes causing less wastage and eventually cause less pollution.
What are the major factors driving the sales of in-mold Labels?
The exponential growth of the pharmaceutical sector and expansion of the food & beverages industry across the globe will drive the demand for in-mold labels. Moreover, the increased demand for durability of labels used in product packaging and elimination of the gluing process will fuel the demand for In-mold labels.
What is the Western Europe in-mold Labels market outlook?
The Western European market is projected to hold approximately 37% of the global market share in 2031.
What is the cumulative share of the top five companies in the global in-mold labels market?
The top five companies operating in the global market for In-mold labels are CCL Industries Inc., Multicolor Corporation, Avery Dennison Corp., and Constantia Flexibles Group GmbH. These players are estimated to hold nearly 15% to 20% share in the global market for In-mold labels.
At what rate will the global market for in-mold labels grow in APEJ?
According to FMI analysis, the APEJ market for in-mold labels is anticipated to register a CAGR of 5.4% between 2021 and 2031.
Which are the top 5 countries exhibiting high demand for in-mold labels?
The U.S., Germany, Italy, France, and Spain are the top 5 countries exhibiting high demand for in-mold labels.
At what rate will the China in-mold labels market grow?
According to FMI, the China in-mold labels market is estimated to expand at 5.2% CAGR between 2021 and 2031
Table of Content
1. Executive Summary 1.1. Global Market Outlook 1.2. Market Analysis 1.3. Analysis and Recommendations 2. Market Overview 2.1. Market Coverage 2.2. Market Definition 3. Key Market Trends 3.1. Key Trends Impacting the Market 3.2. Product Innovation Trends 4. Global Market Demand Analysis 2014–2020 and Forecast, 2021–2031 4.1. Historical Market Volume (‘000 sq.m.) Analysis, 2014–2020 4.2. Current and Future Market Volume (‘000 sq.m.) Projections, 2021–2031 4.3. Y-o-Y Growth Trend Analysis 5. Global Market - Pricing Analysis 5.1. Regional Pricing Analysis 5.2. Pricing Break-up 5.3. Global Average Pricing Analysis Benchmark 6. Global Market Demand (Value in US$ Mn) Analysis 2014–2020 and Forecast, 2021–2031 6.1. Historical Market Value (US$ Mn) Analysis, 2014–2020 6.2. Current and Future Market Value (US$ Mn) Projections, 2021–2031 6.2.1. Y-o-Y Growth Trend Analysis 6.2.2. Absolute $ Opportunity Analysis 7. Market Background 7.1. Global Packaging Industry Outlook 7.2. Global Rigid Packaging Industry Outlook 7.3. Macro-Economic Factors 7.3.1. Global GDP Growth Outlook 7.3.2. Manufacturing Value Added Growth 7.3.3. Global Plastic Production Growth 7.3.4. Global Industrial Packaging Market Growth 7.4. Forecast Factors - Relevance & Impact 7.4.1. Microeconomic and Macroeconomic outlook 7.4.2. Segmental revenue growth, by each key player 7.4.3. Manufacturing sector growth 7.4.4. Flexible packaging market growth 7.4.5. Plastic production by key regions 7.4.6. Per capita expenditure on packaging by key regions 7.5. Value Chain Analysis 7.5.1. Key Participants 7.5.1.1. Raw Material Suppliers 7.5.1.2. Manufacturers/Converters 7.5.1.3. Distributors 7.5.2. Profitability Margin 7.6. Market Dynamics 7.6.1. Drivers 7.6.2. Restraints 7.6.3. Opportunity Analysis 8. Impact of COVID-19 8.1. Current Statistics and Probable Future Impact 8.2. Impact of COVID-19 on Market 9. Global Market Analysis 2014–2020 and Forecast 2021–2031, By Process 9.1. Introduction 9.2. Historical Market Size (US$ Mn) and Volume Analysis, By Process, 2014–2020 9.3. Current and Future Market Size (US$ Mn) and Volume Analysis and Forecast, By Process, 2021–2031 9.3.1. Blow Molding 9.3.2. Injection Molding 9.3.3. Thermoforming 9.4. Market Attractiveness Analysis, By Process 10. Global Market Analysis 2014–2020 and Forecast 2021–2031, By Material 10.1. Introduction 10.2. Historical Market Size (US$ Mn) and Volume (‘000 sq.m.) Analysis, By Material, 2014–2020 10.3. Current and Future Market Size (US$ Mn) and Volume (‘000 sq.m.) Analysis and Forecast, By Material, 2021–2031 10.3.1. Polypropylene (PP) 10.3.2. Polyethylene terephthalate (PE) 10.3.3. Polystyrene (PS) 10.3.4. Polyethylene (PE) 10.3.5. Barrier Material (PA, EVOH, etc.) 10.3.6. Paper and Others 10.4. Market Attractiveness Analysis, By Material 11. Global Market Analysis 2014–2020 and Forecast 2021–2031, By Printing Method 11.1. Introduction 11.2. Historical Market Size (US$ Mn) and Volume Analysis, By Printing Method, 2014–2020 11.3. Current and Future Market Size (US$ Mn) and Volume Analysis and Forecast, By Printing Method, 2021–2031 11.3.1. Gravure 11.3.2. Flexo 11.3.3. Offset 11.3.4. Screen 11.3.5. Digital 11.3.6. Others 11.4. Market Attractiveness Analysis, By Printing Method 12. Global Market Analysis 2014–2020 and Forecast 2021–2031, By End Use 12.1. Introduction 12.2. Historical Market Size (US$ Mn) and Volume Analysis, By End Use, 2014–2020 12.3. Current and Future Market Size (US$ Mn) and Volume Analysis and Forecast, By End Use, 2021–2031 12.3.1. Food 12.3.2. Beverage 12.3.3. Pharma 12.3.4. Home Care 12.3.5. Cosmetic & Personal 12.3.6. Others 12.4. Market Attractiveness Analysis, By End Use 13. Global Market Analysis 2014–2020 and Forecast 2021–2031, by Region 13.1. Introduction 13.2. Historical Market Size (US$ Mn) and Volume Analysis, by Region, 2014–2020 13.3. Current Market Size (US$ Mn) and Volume Analysis and Forecast, by Region, 2021–2031 13.3.1. North America 13.3.2. Latin America 13.3.3. Western Europe 13.3.4. Eastern Europe 13.3.5. APEJ 13.3.6. Japan 13.3.7. MEA 13.4. Market Attractiveness Analysis, by Region 14. North America Market Analysis 2014–2020 and Forecast 2021–2031 14.1. Introduction 14.2. Pricing Analysis 14.3. Historical Market Size (US$ Mn) and Volume (‘000 sq.m.) Analysis, by Market Taxonomy, 2014–2020 14.4. Market Size (US$ Mn) and Volume (‘000 sq.m.) Forecast, by Market Taxonomy, 2021–2031 14.4.1. By Country 14.4.1.1. U.S. 14.4.1.2. Canada 14.4.2. By Process 14.4.3. By Material 14.4.4. Printing Method 14.4.5. By End Use 14.5. Market Attractiveness Analysis 14.5.1. By Country 14.5.2. By Process 14.5.3. By Material 14.5.4. Printing Method 14.5.5. By End Use 15. Latin America Market Analysis 2014–2020 and Forecast 2021–2031 15.1. Introduction 15.2. Pricing Analysis 15.3. Historical Market Size (US$ Mn) and Volume (‘000 sq.m.) Analysis, by Market Taxonomy, 2014–2020 15.4. Market Size (US$ Mn) and Volume (‘000 sq.m.) Forecast, by Market Taxonomy, 2021–2031 15.4.1. By Country 15.4.1.1. Brazil 15.4.1.2. Mexico 15.4.1.3. Rest of Latin America 15.4.2. By Process 15.4.3. By Material 15.4.4. Printing Method 15.4.5. By End Use 15.5. Market Attractiveness Analysis 15.5.1. By Country 15.5.2. By Process 15.5.3. By Material 15.5.4. Printing Method 15.5.5. By End Use 16. Western Europe Market Analysis 2014–2020 and Forecast 2021–2031 16.1. Introduction 16.2. Pricing Analysis 16.3. Historical Market Size (US$ Mn) and Volume (‘000 sq.m.) Analysis, by Market Taxonomy, 2014–2020 16.4. Market Size (US$ Mn) and Volume (‘000 sq.m.) Forecast, by Market Taxonomy, 2021–2031 16.4.1. By Country 16.4.1.1. Germany 16.4.1.2. Italy 16.4.1.3. France 16.4.1.4. U.K. 16.4.1.5. Spain 16.4.1.6. BENELUX 16.4.1.7. Rest of Western Europe 16.4.2. By Process 16.4.3. By Material 16.4.4. Printing Method 16.4.5. By End Use 16.5. Market Attractiveness Analysis 16.5.1. By Country 16.5.2. By Process 16.5.3. By Material 16.5.4. Printing Method 16.5.5. By End Use 17. Eastern Europe Market Analysis 2014–2020 and Forecast 2021–2031 17.1. Introduction 17.2. Pricing Analysis 17.3. Historical Market Size (US$ Mn) and Volume (‘000 sq.m.) Analysis, by Market Taxonomy, 2014–2020 17.4. Market Size (US$ Mn) and Volume (‘000 sq.m.) Forecast, by Market Taxonomy, 2021–2031 17.4.1. By Country 17.4.1.1. Russia 17.4.1.2. Poland 17.4.1.3. Rest of EE 17.4.2. By Process 17.4.3. By Material 17.4.4. Printing Method 17.4.5. By End Use 17.5. Market Attractiveness Analysis 17.5.1. By Country 17.5.2. By Process 17.5.3. By Material 17.5.4. Printing Method 17.5.5. By End Use 18. APEJ Market Analysis 2014–2020 and Forecast 2021–2031 18.1. Introduction 18.2. Pricing Analysis 18.3. Historical Market Size (US$ Mn) and Volume (‘000 sq.m.) Analysis, by Market Taxonomy, 2014–2020 18.4. Market Size (US$ Mn) and Volume (‘000 sq.m.) Forecast, by Market Taxonomy, 2021–2031 18.4.1. By Country 18.4.1.1. China 18.4.1.2. India 18.4.1.3. ASEAN 18.4.1.4. Aus & NZ 18.4.1.5. Rest of APEJ 18.4.2. By Process 18.4.3. By Material 18.4.4. Printing Method 18.4.5. By End Use 18.5. Market Attractiveness Analysis 18.5.1. By Country 18.5.2. By Process 18.5.3. By Material 18.5.4. Printing Method 18.5.5. By End Use 19. Japan Market Analysis 2014–2020 and Forecast 2021–2031 19.1. Introduction 19.2. Pricing Analysis 19.3. Historical Market Size (US$ Mn) and Volume (‘000 sq.m.) Analysis, by Market Taxonomy, 2014–2020 19.4. Market Size (US$ Mn) and Volume (‘000 sq.m.) Forecast, by Market Taxonomy, 2021–2031 19.4.1. By Process 19.4.2. By Material 19.4.3. Printing Method 19.4.4. By End Use 19.5. Market Attractiveness Analysis 19.5.1. By Process 19.5.2. By Material 19.5.3. Printing Method 19.5.4. By End Use 20. Middle East and Africa Market Analysis 2014–2020 and Forecast 2021–2031 20.1. Introduction 20.2. Pricing Analysis 20.3. Historical Market Size (US$ Mn) and Volume (‘000 sq.m.) Analysis, by Market Taxonomy, 2014–2020 20.4. Market Size (US$ Mn) and Volume (‘000 sq.m.) Forecast, by Market Taxonomy, 2021–2031 20.4.1. By Country 20.4.1.1. GCC Countries 20.4.1.2. Northern Africa 20.4.1.3. South Africa 20.4.1.4. Rest of Middle East and Africa 20.4.2. By Process 20.4.3. By Material 20.4.4. Printing Method 20.4.5. By End Use 20.5. Market Attractiveness Analysis 20.5.1. By Country 20.5.2. By Process 20.5.3. By Material 20.5.4. Printing Method 20.5.5. By End Use 21. Market Country wise Analysis 2021 & 2031 21.1. U.S. Market Analysis 21.1.1. Market Volume (‘000 sq.m.) and Value (US$ Mn) Analysis and Forecast, by Market Taxonomy 21.1.1.1. By Process 21.1.1.2. By Material 21.1.1.3. Printing Method 21.1.1.4. By End Use 21.2. Canada Market Analysis 21.2.1. Market Volume (‘000 sq.m.) and Value (US$ Mn) Analysis and Forecast, by Market Taxonomy 21.2.1.1. By Process 21.2.1.2. By Material 21.2.1.3. Printing Method 21.2.1.4. By End Use 21.3. Brazil Market Analysis 21.3.1. Market Volume (‘000 sq.m.) and Value (US$ Mn) Analysis and Forecast, by Market Taxonomy 21.3.1.1. By Process 21.3.1.2. By Material 21.3.1.3. Printing Method 21.3.1.4. By End Use 21.4. Mexico Market Analysis 21.4.1. Market Volume (‘000 sq.m.) and Value (US$ Mn) Analysis and Forecast, by Market Taxonomy 21.4.1.1. By Process 21.4.1.2. By Material 21.4.1.3. Printing Method 21.4.1.4. By End Use 21.5. Germany Market Analysis 21.5.1. Market Volume (‘000 sq.m.) and Value (US$ Mn) Analysis and Forecast, by Market Taxonomy 21.5.1.1. By Process 21.5.1.2. By Material 21.5.1.3. Printing Method 21.5.1.4. By End Use 21.6. Italy Market Analysis 21.6.1. Market Volume (‘000 sq.m.) and Value (US$ Mn) Analysis and Forecast, by Market Taxonomy 21.6.1.1. By Process 21.6.1.2. By Material 21.6.1.3. Printing Method 21.6.1.4. By End Use 21.7. France Market Analysis 21.7.1. Market Volume (‘000 sq.m.) and Value (US$ Mn) Analysis and Forecast, by Market Taxonomy 21.7.1.1. By Process 21.7.1.2. By Material 21.7.1.3. Printing Method 21.7.1.4. By End Use 21.8. U.K. Market Analysis 21.8.1. Market Volume (‘000 sq.m.) and Value (US$ Mn) Analysis and Forecast, by Market Taxonomy 21.8.1.1. By Process 21.8.1.2. By Material 21.8.1.3. Printing Method 21.8.1.4. By End Use 21.9. Russia Market Analysis 21.9.1. Market Volume (‘000 sq.m.) and Value (US$ Mn) Analysis and Forecast, by Market Taxonomy 21.9.1.1. By Process 21.9.1.2. By Material 21.9.1.3. Printing Method 21.9.1.4. By End Use 21.10. GCC Countries Market Analysis 21.10.1. Market Volume (‘000 sq.m.) and Value (US$ Mn) Analysis and Forecast, by Market Taxonomy 21.10.1.1. By Process 21.10.1.2. By Material 21.10.1.3. Printing Method 21.10.1.4. By End Use 21.11. Japan Market Analysis 21.11.1. Market Volume (‘000 sq.m.) and Value (US$ Mn) Analysis and Forecast, by Market Taxonomy 21.11.1.1. By Process 21.11.1.2. By Material 21.11.1.3. Printing Method 21.11.1.4. By End Use 21.12. Poland Market Analysis 21.12.1. Market Volume (‘000 sq.m.) and Value (US$ Mn) Analysis and Forecast, by Market Taxonomy 21.12.1.1. By Process 21.12.1.2. By Material 21.12.1.3. Printing Method 21.12.1.4. By End Use 21.13. India Market Analysis 21.13.1. Market Volume (‘000 sq.m.) and Value (US$ Mn) Analysis and Forecast, by Market Taxonomy 21.13.1.1. By Process 21.13.1.2. By Material 21.13.1.3. Printing Method 21.13.1.4. By End Use 21.14. China Market Analysis 21.14.1. Market Volume (‘000 sq.m.) and Value (US$ Mn) Analysis and Forecast, by Market Taxonomy 21.14.1.1. By Process 21.14.1.2. By Material 21.14.1.3. Printing Method 21.14.1.4. By End Use 21.15. Australia Market Analysis 21.15.1. Market Volume (‘000 sq.m.) and Value (US$ Mn) Analysis and Forecast, by Market Taxonomy 21.15.1.1. By Process 21.15.1.2. By Material 21.15.1.3. Printing Method 21.15.1.4. By End Use 22. Market Structure Analysis 22.1. Market Analysis, by Tier of Companies 22.2. Market Concentration 22.3. Market Share Analysis of Top Players 22.4. Market Presence Analysis 23. Competition Analysis 23.1. Competition Dashboard 23.2. Competition Benchmarking 23.3. Competition Deep Dive 23.3.1. CCL Industries Inc. 23.3.1.1. Overview 23.3.1.2. Product Portfolio 23.3.1.3. Profitability by Market Segments (Product/Channel/Region) 23.3.1.4. Sales Footprint 23.3.1.5. Strategy Overview 23.3.1.5.1. Marketing Strategy 23.3.1.5.2. Product Strategy 23.3.1.5.3. Channel Strategy 23.3.2. Constantia Flexibles Group GmbH 23.3.2.1. Overview 23.3.2.2. Product Portfolio 23.3.2.3. Profitability by Market Segments (Product/Channel/Region) 23.3.2.4. Sales Footprint 23.3.2.5. Strategy Overview 23.3.2.5.1. Marketing Strategy 23.3.2.5.2. Product Strategy 23.3.2.5.3. Channel Strategy 23.3.3. Coveris Holding S.A. 23.3.3.1. Overview 23.3.3.2. Product Portfolio 23.3.3.3. Profitability by Market Segments (Product/Channel/Region) 23.3.3.4. Sales Footprint 23.3.3.5. Strategy Overview 23.3.3.5.1. Marketing Strategy 23.3.3.5.2. Product Strategy 23.3.3.5.3. Channel Strategy 23.3.4. Avery Dennison Corp. 23.3.4.1. Overview 23.3.4.2. Product Portfolio 23.3.4.3. Profitability by Market Segments (Product/Channel/Region) 23.3.4.4. Sales Footprint 23.3.4.5. Strategy Overview 23.3.4.5.1. Marketing Strategy 23.3.4.5.2. Product Strategy 23.3.4.5.3. Channel Strategy 23.3.5. Multicolor Corporation 23.3.5.1. Overview 23.3.5.2. Product Portfolio 23.3.5.3. Profitability by Market Segments (Product/Channel/Region) 23.3.5.4. Sales Footprint 23.3.5.5. Strategy Overview 23.3.5.5.1. Marketing Strategy 23.3.5.5.2. Product Strategy 23.3.5.5.3. Channel Strategy 23.3.6. Fuji Seal International Inc. 23.3.6.1. Overview 23.3.6.2. Product Portfolio 23.3.6.3. Profitability by Market Segments (Product/Channel/Region) 23.3.6.4. Sales Footprint 23.3.6.5. Strategy Overview 23.3.6.5.1. Marketing Strategy 23.3.6.5.2. Product Strategy 23.3.6.5.3. Channel Strategy 23.3.7. Huhtamäki Oyj 23.3.7.1. Overview 23.3.7.2. Product Portfolio 23.3.7.3. Profitability by Market Segments (Product/Channel/Region) 23.3.7.4. Sales Footprint 23.3.7.5. Strategy Overview 23.3.7.5.1. Marketing Strategy 23.3.7.5.2. Product Strategy 23.3.7.5.3. Channel Strategy 23.3.8. Korsini Ambalaj San. Tic. A.S. 23.3.8.1. Overview 23.3.8.2. Product Portfolio 23.3.8.3. Profitability by Market Segments (Product/Channel/Region) 23.3.8.4. Sales Footprint 23.3.8.5. Strategy Overview 23.3.8.5.1. Marketing Strategy 23.3.8.5.2. Product Strategy 23.3.8.5.3. Channel Strategy 23.3.9. Walle Corporation 23.3.9.1. Overview 23.3.9.2. Product Portfolio 23.3.9.3. Profitability by Market Segments (Product/Channel/Region) 23.3.9.4. Sales Footprint 23.3.9.5. Strategy Overview 23.3.9.5.1. Marketing Strategy 23.3.9.5.2. Product Strategy 23.3.9.5.3. Channel Strategy 23.3.10. Duratech Industries Inc. 23.3.10.1. Overview 23.3.10.2. Product Portfolio 23.3.10.3. Profitability by Market Segments (Product/Channel/Region) 23.3.10.4. Sales Footprint 23.3.10.5. Strategy Overview 23.3.10.5.1. Marketing Strategy 23.3.10.5.2. Product Strategy 23.3.10.5.3. Channel Strategy 23.3.11. Papro Industries 23.3.11.1. Overview 23.3.11.2. Product Portfolio 23.3.11.3. Profitability by Market Segments (Product/Channel/Region) 23.3.11.4. Sales Footprint 23.3.11.5. Strategy Overview 23.3.11.5.1. Marketing Strategy 23.3.11.5.2. Product Strategy 23.3.11.5.3. Channel Strategy 23.3.12. MarksPrint 23.3.12.1. Overview 23.3.12.2. Product Portfolio 23.3.12.3. Profitability by Market Segments (Product/Channel/Region) 23.3.12.4. Sales Footprint 23.3.12.5. Strategy Overview 23.3.12.5.1. Marketing Strategy 23.3.12.5.2. Product Strategy 23.3.12.5.3. Channel Strategy 23.3.13. Makers Polyfilms Private Limited 23.3.13.1. Overview 23.3.13.2. Product Portfolio 23.3.13.3. Profitability by Market Segments (Product/Channel/Region) 23.3.13.4. Sales Footprint 23.3.13.5. Strategy Overview 23.3.13.5.1. Marketing Strategy 23.3.13.5.2. Product Strategy 23.3.13.5.3. Channel Strategy 23.3.14. Holostik India Limited 23.3.14.1. Overview 23.3.14.2. Product Portfolio 23.3.14.3. Profitability by Market Segments (Product/Channel/Region) 23.3.14.4. Sales Footprint 23.3.14.5. Strategy Overview 23.3.14.5.1. Marketing Strategy 23.3.14.5.2. Product Strategy 23.3.14.5.3. Channel Strategy 23.3.15. Yoshida Technoworks Co.,Ltd. 23.3.15.1. Overview 23.3.15.2. Product Portfolio 23.3.15.3. Profitability by Market Segments (Product/Channel/Region) 23.3.15.4. Sales Footprint 23.3.15.5. Strategy Overview 23.3.15.5.1. Marketing Strategy 23.3.15.5.2. Product Strategy 23.3.15.5.3. Channel Strategy 23.3.16. Ravi Print Pack Private Limited 23.3.16.1. Overview 23.3.16.2. Product Portfolio 23.3.16.3. Profitability by Market Segments (Product/Channel/Region) 23.3.16.4. Sales Footprint 23.3.16.5. Strategy Overview 23.3.16.5.1. Marketing Strategy 23.3.16.5.2. Product Strategy 23.3.16.5.3. Channel Strategy 23.3.17. Milan Decor Private Limited 23.3.17.1. Overview 23.3.17.2. Product Portfolio 23.3.17.3. Profitability by Market Segments (Product/Channel/Region) 23.3.17.4. Sales Footprint 23.3.17.5. Strategy Overview 23.3.17.5.1. Marketing Strategy 23.3.17.5.2. Product Strategy 23.3.17.5.3. Channel Strategy 23.3.18. Pb Holotech India Private Limited 23.3.18.1. Overview 23.3.18.2. Product Portfolio 23.3.18.3. Profitability by Market Segments (Product/Channel/Region) 23.3.18.4. Sales Footprint 23.3.18.5. Strategy Overview 23.3.18.5.1. Marketing Strategy 23.3.18.5.2. Product Strategy 23.3.18.5.3. Channel Strategy 23.3.19. Taizhou City Liyang Package Co.,Ltd. 23.3.19.1. Overview 23.3.19.2. Product Portfolio 23.3.19.3. Profitability by Market Segments (Product/Channel/Region) 23.3.19.4. Sales Footprint 23.3.19.5. Strategy Overview 23.3.19.5.1. Marketing Strategy 23.3.19.5.2. Product Strategy 23.3.19.5.3. Channel Strategy 23.3.20. Cosmo Films Ltd. 23.3.20.1. Overview 23.3.20.2. Product Portfolio 23.3.20.3. Profitability by Market Segments (Product/Channel/Region) 23.3.20.4. Sales Footprint 23.3.20.5. Strategy Overview 23.3.20.5.1. Marketing Strategy 23.3.20.5.2. Product Strategy 23.3.20.5.3. Channel Strategy *The above list is indicative in nature and is subject to change during the course of research 24. Assumptions and Acronyms Used 25. Research Methodology
Let us know your requirement to get
100% FREE customization
List of Tables
Table 01: Global Market Value (US$ Mn) and Volume (‘000 sq.m.) Forecast, by Process, 2014 – 2029 Table 02: Global Market Value (US$ Mn) and Volume (‘000 sq.m.) Forecast, by Material, 2014 – 2029 Table 03: Global Market Value (US$ Mn) and Volume (‘000 sq.m.) Forecast, by Printing Method, 2014 – 2029 Table 04: Global Market Value (US$ Mn) and Volume (‘000 sq.m.) Forecast, by End Use, 2014 – 2029 Table 05: Global Market Value (US$ Mn) and Volume (‘000 sq.m.) Forecast, by Region, 2014 – 2029 Table 06: North America Market Value (US$ Mn) and Volume (‘000 sq.m.) Forecast, by Country, 2014 – 2029 Table 07: North America Market Value (US$ Mn) and Volume (‘000 sq.m.) Forecast, by Process, 2014 – 2029 Table 08: North America Market Value (US$ Mn) and Volume (‘000 sq.m.) Forecast, by Material, 2014 – 2029 Table 09: North America Market Value (US$ Mn) and Volume (‘000 sq.m.) Forecast, by Printing Method, 2014 – 2029 Table 10: North America Market Value (US$ Mn) and Volume (‘000 sq.m.) Forecast, by End Use, 2014 – 2029 Table 11: Latin America Market Value (US$ Mn) and Volume (‘000 sq.m.) Forecast, by Country, 2014 – 2029 Table 12: Latin America Market Value (US$ Mn) and Volume (‘000 sq.m.) Forecast, by Process, 2014 – 2029 Table 13: Latin America Market Value (US$ Mn) and Volume (‘000 sq.m.) Forecast, by Material, 2014 – 2029 Table 14: Latin America Market Value (US$ Mn) and Volume (‘000 sq.m.) Forecast, by Printing Method, 2014 – 2029 Table 15: Latin America Market Value (US$ Mn) and Volume (‘000 sq.m.) Forecast, by End Use, 2014 – 2029 Table 16: Western Europe Market Value (US$ Mn) and Volume (‘000 sq.m.) Forecast, by Country, 2014 – 2029 Table 17: Western Europe Market Value (US$ Mn) and Volume (‘000 sq.m.) Forecast, by Process, 2014 – 2029 Table 18: Western Europe Market Value (US$ Mn) and Volume (‘000 sq.m.) Forecast, by Material, 2014 – 2029 Table 19: Western Europe Market Value (US$ Mn) and Volume (‘000 sq.m.) Forecast, by Printing Method, 2014 – 2029 Table 20: Western Europe Market Value (US$ Mn) and Volume (‘000 sq.m.) Forecast, by End Use, 2014 – 2029 Table 21: Eastern Europe Market Value (US$ Mn) and Volume (‘000 sq.m.) Forecast, by Country, 2014 – 2029 Table 22: Eastern Europe Market Value (US$ Mn) and Volume (‘000 sq.m.) Forecast, by Process, 2014 – 2029 Table 23: Eastern Europe Market Value (US$ Mn) and Volume (‘000 sq.m.) Forecast, by Material, 2014 – 2029 Table 24: Eastern Europe Market Value (US$ Mn) and Volume (‘000 sq.m.) Forecast, by Printing Method, 2014 – 2029 Table 25: Eastern Europe Market Value (US$ Mn) and Volume (‘000 sq.m.) Forecast, by End Use, 2014 – 2029 Table 26: APEJ Market Value (US$ Mn) and Volume (‘000 sq.m.) Forecast, by Country, 2014 – 2029 Table 27: APEJ Market Value (US$ Mn) and Volume (‘000 sq.m.) Forecast, by Process, 2014 – 2029 Table 28: APEJ Market Value (US$ Mn) and Volume (‘000 sq.m.) Forecast, by Material, 2014 – 2029 Table 29: APEJ Market Value (US$ Mn) and Volume (‘000 sq.m.) Forecast, by Printing Method, 2014 – 2029 Table 30: APEJ Market Value (US$ Mn) and Volume (‘000 sq.m.) Forecast, by End Use, 2014 – 2029 Table 31: Japan Market Value (US$ Mn) and Volume (‘000 sq.m.) Forecast, by Process, 2014 – 2029 Table 32: Japan Market Value (US$ Mn) and Volume (‘000 sq.m.) Forecast, by Material, 2014 – 2029 Table 33: Japan Market Value (US$ Mn) and Volume (‘000 sq.m.) Forecast, by Printing Method, 2014 – 2029 Table 34: Japan Market Value (US$ Mn) and Volume (‘000 sq.m.) Forecast, by End Use, 2014 – 2029 Table 35: MEA Market Value (US$ Mn) and Volume (‘000 sq.m.) Forecast, by Country, 2014 – 2029 Table 36: MEA Market Value (US$ Mn) and Volume (‘000 sq.m.) Forecast, by Process, 2014 – 2029 Table 37: MEA Market Value (US$ Mn) and Volume (‘000 sq.m.) Forecast, by Material, 2014 – 2029 Table 38: MEA Market Value (US$ Mn) and Volume (‘000 sq.m.) Forecast, by Printing Method, 2014 – 2029 Table 39: MEA Market Value (US$ Mn) and Volume (‘000 sq.m.) Forecast, by End Use, 2014 – 2029
Find your sweet spots for generating winning opportunities in this market.
Talk to AnalystList of Charts
Figure 01: Global Market Attractiveness Index by Process, 2019-2029 Figure 02: Global Market Value Share Analysis by Process, 2019 (E) Figure 03: Global Market Attractiveness Index by Material, 2019-2029 Figure 04: Global Market Value Share Analysis by Material, 2019 (E) Figure 05: Global Market Attractiveness Index by Printing Method, 2019-2029 Figure 06: Global Market Value Share Analysis by Printing Method, 2019 (E) Figure 07: Global Market Attractiveness Index by End Use, 2019-2029 Figure 08: Global Market Value Share Analysis by End Use, 2019 (E) Figure 09: Global Market Attractiveness Index by Region, 2019-2029 Figure 10: Global Market Value Share Analysis by Region, 2019 (E) Figure 11: North America Market Value (US$ Mn) and Volume (‘000 sq.m.) analysis 2014 - 2018 Figure 12: North America Market Value (US$ Mn) and Volume (‘000 sq.m.) Forecast, 2019 - 2029 Figure 13: North America Market Attractiveness Index by Country, 2019-2029 Figure 14: North America Market Value Share Analysis by Country, 2019 (E) Figure 15: North America Market Attractiveness Index by Process, 2019-2029 Figure 16: North America Market Value Share Analysis by Process, 2019 (E) Figure 17: North America Market Attractiveness Index by Material, 2019-2029 Figure 18: North America Market Value Share Analysis by Material, 2019 (E) Figure 19: North America Market Attractiveness Index by Printing Method, 2019-2029 Figure 20: North America Market Value Share Analysis by Printing Method, 2019 (E) Figure 21: North America Market Attractiveness Index by End Use, 2019-2029 Figure 22: North America Market Value Share Analysis by End Use, 2019 (E) Figure 23: Latin America Market Value (US$ Mn) and Volume (‘000 sq.m.) analysis 2014 - 2018 Figure 24: Latin America Market Value (US$ Mn) and Volume (‘000 sq.m.) Forecast, 2019 - 2029 Figure 25: Latin America Market Attractiveness Index by Country, 2019-2029 Figure 26: Latin America Market Value Share Analysis by Country, 2019 (E) Figure 27: Latin America Market Attractiveness Index by Process, 2019-2029 Figure 28: Latin America Market Value Share Analysis by Process, 2019 (E) Figure 29: Latin America Market Attractiveness Index by Material, 2019-2029 Figure 30: Latin America Market Value Share Analysis by Material, 2019 (E) Figure 31: Latin America Market Attractiveness Index by Printing Method, 2019-2029 Figure 32: Latin America Market Value Share Analysis by Printing Method, 2019 (E) Figure 33: Latin America Market Attractiveness Index by End Use, 2019-2029 Figure 34: Latin America Market Value Share Analysis by End Use, 2019 (E) Figure 35: Western Europe Market Value (US$ Mn) and Volume (‘000 sq.m.) analysis 2014 - 2018 Figure 36: Western Europe Market Value (US$ Mn) and Volume (‘000 sq.m.) Forecast, 2019 - 2029 Figure 37: Western Europe Market Attractiveness Index by Country, 2019-2029 Figure 38: Western Europe Market Value Share Analysis by Country, 2019 (E) Figure 39: Western Europe Market Attractiveness Index by Process, 2019-2029 Figure 40: Western Europe Market Value Share Analysis by Process, 2019 (E) Figure 41: Western Europe Market Attractiveness Index by Material, 2019-2029 Figure 42: Western Europe Market Value Share Analysis by Material, 2019 (E) Figure 43: Western Europe Market Attractiveness Index by Printing Method, 2019-2029 Figure 44: Western Europe Market Value Share Analysis by Printing Method, 2019 (E) Figure 45: Western Europe Market Attractiveness Index by End Use, 2019-2029 Figure 46: Western Europe Market Value Share Analysis by End Use, 2019 (E) Figure 47: Eastern Europe Market Value (US$ Mn) and Volume (‘000 sq.m.) analysis 2014 - 2018 Figure 48: Eastern Europe Market Value (US$ Mn) and Volume (‘000 sq.m.) Forecast, 2019 - 2029 Figure 49: Eastern Europe Market Attractiveness Index by Country, 2019-2029 Figure 50: Eastern Europe Market Value Share Analysis by Country, 2019 (E) Figure 51: Eastern Europe Market Attractiveness Index by Process, 2019-2029 Figure 52: Eastern Europe Market Value Share Analysis by Process, 2019 (E) Figure 53: Eastern Europe Market Attractiveness Index by Material, 2019-2029 Figure 54: Eastern Europe Market Value Share Analysis by Material, 2019 (E) Figure 55: Eastern Europe Market Attractiveness Index by Printing Method, 2019-2029 Figure 56: Eastern Europe Market Value Share Analysis by Printing Method, 2019 (E) Figure 57: Eastern Europe Market Attractiveness Index by End Use, 2019-2029 Figure 58: Eastern Europe Market Value Share Analysis by End Use, 2019 (E) Figure 59: APEJ Market Value (US$ Mn) and Volume (‘000 sq.m.) analysis 2014 - 2018 Figure 60: APEJ Market Value (US$ Mn) and Volume (‘000 sq.m.) Forecast, 2019 - 2029 Figure 61: APEJ Market Attractiveness Index by Country, 2019-2029 Figure 62: APEJ Market Value Share Analysis by Country, 2019 (E) Figure 63: APEJ Market Attractiveness Index by Process, 2019-2029 Figure 64: APEJ Market Value Share Analysis by Process, 2019 (E) Figure 65: APEJ Market Attractiveness Index by Material, 2019-2029 Figure 66: APEJ Market Value Share Analysis by Material, 2019 (E) Figure 67: APEJ Market Attractiveness Index by Printing Method, 2019-2029 Figure 68: APEJ Market Value Share Analysis by Printing Method, 2019 (E) Figure 69: APEJ Market Attractiveness Index by End Use, 2019-2029 Figure 70: APEJ Market Value Share Analysis by End Use, 2019 (E) Figure 71: Japan Market Value (US$ Mn) and Volume (‘000 sq.m.) analysis 2014 - 2018 Figure 72: Japan Market Value (US$ Mn) and Volume (‘000 sq.m.) Forecast, 2019 - 2029 Figure 73: Japan Market Attractiveness Index by Process, 2019-2029 Figure 74: Japan Market Value Share Analysis by Process, 2019 (E) Figure 75: Japan Market Attractiveness Index by Material, 2019-2029 Figure 76: Japan Market Value Share Analysis by Material, 2019 (E) Figure 77: Japan Market Attractiveness Index by Printing Method, 2019-2029 Figure 78: Japan Market Value Share Analysis by Printing Method, 2019 (E) Figure 79: Japan Market Attractiveness Index by End Use, 2019-2029 Figure 80: Japan Market Value Share Analysis by End Use, 2019 (E) Figure 81: MEA Market Value (US$ Mn) and Volume (‘000 sq.m.) analysis 2014 - 2018 Figure 82: MEA Market Value (US$ Mn) and Volume (‘000 sq.m.) Forecast, 2019 - 2029 Figure 83: MEA Market Attractiveness Index by Country, 2019-2029 Figure 84: MEA Market Value Share Analysis by Country, 2019 (E) Figure 85: MEA Market Attractiveness Index by Process, 2019-2029 Figure 86: MEA Market Value Share Analysis by Process, 2019 (E) Figure 87: MEA Market Attractiveness Index by Material, 2019-2029 Figure 88: MEA Market Value Share Analysis by Material, 2019 (E) Figure 89: MEA Market Attractiveness Index by Printing Method, 2019-2029 Figure 90: MEA Market Value Share Analysis by Printing Method, 2019 (E) Figure 91: MEA Market Attractiveness Index by End Use, 2019-2029 Figure 92: MEA Market Value Share Analysis by End Use, 2019 (E)
Need specific information?
Request CustomizationExplore Packaging Insights
View Reports