Sheeted Labels Market Size and Share Forecast Outlook 2025 to 2035

The Sheeted Labels Market is estimated to be valued at USD 2.9 billion in 2025 and is projected to reach USD 6.0 billion by 2035, registering a compound annual growth rate (CAGR) of 7.6% over the forecast period.
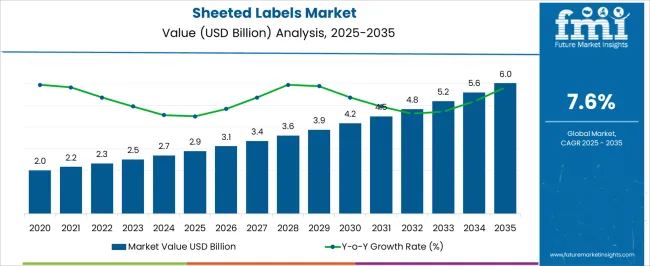
Quick Stats for Sheeted Labels Market

  • Sheeted Labels Market Value (2025): USD 2.9 billion
  • Sheeted Labels Market Forecast Value (2035): USD 6.0 billion
  • Sheeted Labels Market Forecast CAGR: 7.6%
  • Leading Segment in Sheeted Labels Market in 2025: Facestock (36.8%)
  • Key Growth Regions in Sheeted Labels Market: North America, Asia-Pacific, Europe
  • Top Key Players in Sheeted Labels Market: Coding Solutions, New York Label & Box Works, Ready Print Limited, Rebsons LabelsHub Labels, Blanco, Consolidated Label, RGS Labels, Performance Label Company

Sheeted Labels Market Market Value Analysis

Sheeted Labels Market Key Takeaways

Metric Value
Sheeted Labels Market Estimated Value in (2025 E) USD 2.9 billion
Sheeted Labels Market Forecast Value in (2035 F) USD 6.0 billion
Forecast CAGR (2025 to 2035) 7.6%

Why is the Sheeted Labels Market Growing?

The Sheeted Labels market is witnessing steady growth, driven by the increasing demand for organized and high-quality labeling solutions across consumer goods, food and beverages, healthcare, and industrial sectors. Rising emphasis on product differentiation, brand visibility, and regulatory compliance is contributing to the adoption of sheeted labels. Technological advancements in printing and material development, including high-resolution digital printing and sustainable substrates, are enhancing the durability, clarity, and customization capabilities of sheeted labels.

Companies are increasingly leveraging labels to convey product information, traceability data, and marketing messages efficiently. The growing trend toward automated packaging lines and high-speed labeling machines has further accelerated market adoption.

Sustainability considerations, including the use of recyclable paper and environmentally friendly adhesives, are influencing material selection and production processes As industries continue to prioritize product presentation, consumer engagement, and operational efficiency, the Sheeted Labels market is expected to sustain robust growth, with innovations in printing technologies, compositions, and materials shaping future opportunities and enabling scalable, high-quality labeling solutions.

Segmental Analysis

The sheeted labels market is segmented by composition, material, printing technology, end use industry, and geographic regions. By composition, sheeted labels market is divided into Facestock, Adhesive, and Release Liner. In terms of material, sheeted labels market is classified into Paper, Polyester, Vinyl, and Other. Based on printing technology, sheeted labels market is segmented into Flexographic and Lithography. By end use industry, sheeted labels market is segmented into Food And Beverages, Cosmetic & Personal Care, Pharmaceuticals, Electronics, and Other. Regionally, the sheeted labels industry is classified into North America, Latin America, Western Europe, Eastern Europe, Balkan & Baltic Countries, Russia & Belarus, Central Asia, East Asia, South Asia & Pacific, and the Middle East & Africa.
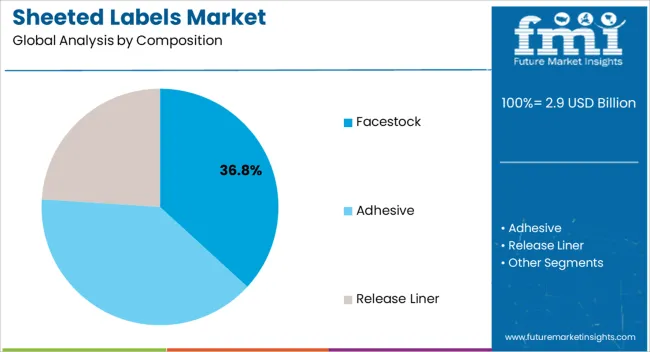
Insights into the Facestock Composition Segment

Sheeted Labels Market Analysis By Composition

The facestock composition segment is projected to hold 36.8% of the market revenue in 2025, establishing it as the leading segment. This dominance is being driven by the ability of facestock to provide a reliable surface for printing, enhance label durability, and support various adhesive types for different applications. Facestock materials are engineered to withstand environmental conditions, including moisture, temperature variations, and abrasion, making them suitable for consumer goods, healthcare, and industrial labeling.

The flexibility to integrate with multiple printing technologies, including flexographic and digital printing, enhances operational efficiency and versatility. Additionally, advancements in surface treatments and coatings have improved ink adhesion, image quality, and legibility, reinforcing preference among manufacturers and brand owners.

Scalability, cost-effectiveness, and compatibility with automated labeling lines further strengthen market leadership As the demand for high-quality, durable, and visually appealing labels continues to rise, the facestock composition segment is expected to maintain its top position, supported by ongoing innovations in material engineering and surface optimization techniques.
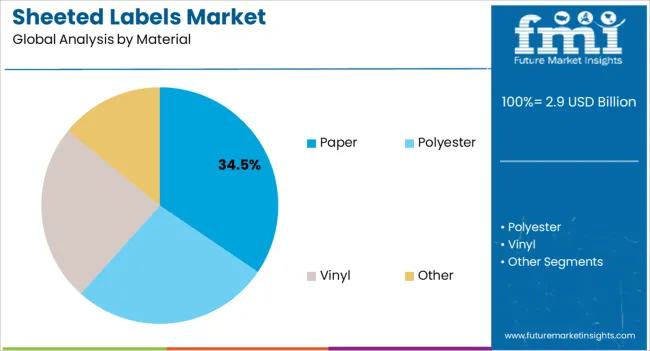
Insights into the Paper Material Segment

Sheeted Labels Market Analysis By Material

The paper material segment is anticipated to account for 34.5% of the market revenue in 2025, making it the leading material type. Growth is being driven by the sustainability, cost-effectiveness, and versatility of paper substrates, which are widely used across consumer goods, food and beverages, and pharmaceutical labeling. Paper materials offer excellent printability, ease of customization, and compatibility with a range of adhesives and coatings, allowing high-quality image reproduction and legible information display.

Advances in recyclable and biodegradable paper types are further enhancing environmental compliance and corporate sustainability initiatives. The ability to process paper substrates efficiently in high-speed labeling equipment contributes to their widespread adoption.

Regulatory compliance related to product information labeling and traceability is also driving demand for paper-based labels As brands focus on reducing environmental impact while ensuring high-quality label performance, the paper material segment is expected to retain its leading position, supported by ongoing development of eco-friendly and functional paper solutions.
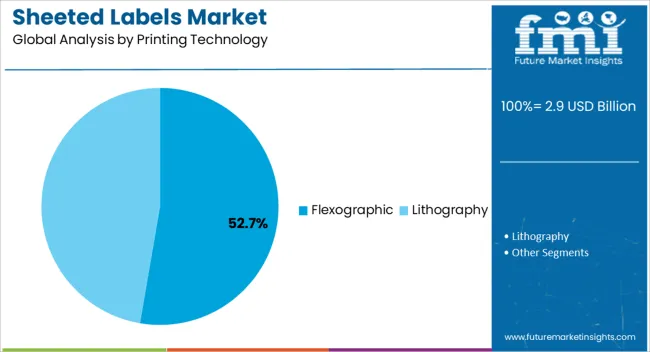
Insights into the Flexographic Printing Technology Segment

Sheeted Labels Market Analysis By Printing Technology

The flexographic printing technology segment is projected to hold 52.7% of the market revenue in 2025, establishing it as the leading printing method. This dominance is being driven by its high-speed printing capabilities, cost efficiency, and suitability for large-volume production runs. Flexographic printing allows high-quality image reproduction on a wide range of materials, including paper, film, and synthetic substrates, supporting diverse labeling applications.

The ability to print with multiple colors, consistent quality, and rapid changeover times enhances operational efficiency for manufacturers. Advancements in ink formulations, plate technology, and press automation have further improved print precision, reducing wastage and increasing production output.

Flexographic printing also supports integration with automated finishing processes such as cutting and laminating, ensuring scalability for industrial operations As demand for high-quality, visually appealing, and durable labels continues to grow, flexographic printing is expected to remain the preferred choice for sheeted labels, reinforced by its adaptability, speed, and cost-effectiveness across large-scale production environments.

Market Overview

Sheeted Labels Market Overview

Over the past few years, labelling has become an essential part of the product packaging. Labelling provides necessary information to consumers regarding product’s feature along with usage process of the product. However, labelling is not an only option for promoting a product but also it aids to protect the customers as well as the brand name.

Sheeted labels is one of the important labelling tool for brand owners and marketers. Sheeted labels market is gaining traction owing to the rising growth of cosmetics & personal care products along with the beverages industry.

Moreover, sheeted labels are one of the ideal solution for the promotional giveaways, these labels are also available as stickers and are used extensively in the magazines. Furthermore, sheeted labels have a high weather resistance and are also suitable for outdoor applications.
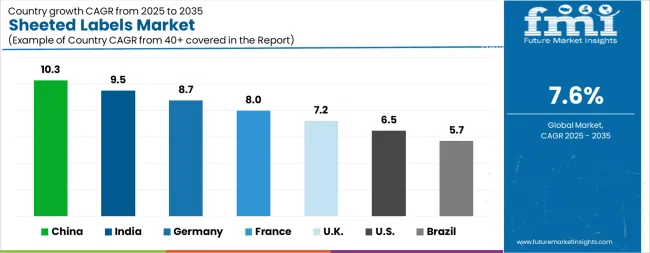
Analysis of Sheeted Labels Market By Key Countries

Sheeted Labels Market Cagr Analysis By Country

Country CAGR
China 10.3%
India 9.5%
Germany 8.7%
France 8.0%
UK 7.2%
USA 6.5%
Brazil 5.7%

Country-wise Analysis

The Sheeted Labels Market is expected to register a CAGR of 7.6% during the forecast period, exhibiting varied country level momentum. China leads with the highest CAGR of 10.3%, followed by India at 9.5%. Developed markets such as Germany, France, and the UK continue to expand steadily, while the USA is likely to grow at consistent rates. Brazil posts the lowest CAGR at 5.7%, yet still underscores a broadly positive trajectory for the global Sheeted Labels Market. In 2024, Germany held a dominant revenue in the Western Europe market and is expected to grow with a CAGR of 8.7%. The USA Sheeted Labels Market is estimated to be valued at USD 1.0 billion in 2025 and is anticipated to reach a valuation of USD 2.0 billion by 2035. Sales are projected to rise at a CAGR of 6.5% over the forecast period between 2025 and 2035. While Japan and South Korea markets are estimated to be valued at USD 132.9 million and USD 79.1 million respectively in 2025.
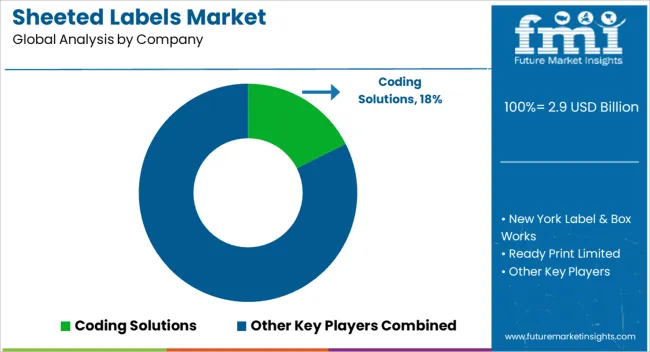
Key Players in the Sheeted Labels Market

Sheeted Labels Market Analysis By Company

  • Coding Solutions
  • New York Label & Box Works
  • Ready Print Limited
  • Rebsons LabelsHub Labels
  • Blanco
  • Consolidated Label
  • RGS Labels
  • Performance Label Company

Scope of the Report

Item Value
Quantitative Units USD 2.9 Billion
Composition Facestock, Adhesive, and Release Liner
Material Paper, Polyester, Vinyl, and Other
Printing Technology Flexographic and Lithography
End Use Industry Food And Beverages, Cosmetic & Personal Care, Pharmaceuticals, Electronics, and Other
Regions Covered North America, Europe, Asia-Pacific, Latin America, Middle East & Africa
Country Covered United States, Canada, Germany, France, United Kingdom, China, Japan, India, Brazil, South Africa
Key Companies Profiled Coding Solutions, New York Label & Box Works, Ready Print Limited, Rebsons LabelsHub Labels, Blanco, Consolidated Label, RGS Labels, and Performance Label Company

Sheeted Labels Market by Segments

Composition:

  • Facestock
  • Adhesive
  • Release Liner

Material:

  • Paper
  • Polyester
  • Vinyl
  • Other

Printing Technology:

  • Flexographic
  • Lithography

End Use Industry:

  • Food And Beverages
  • Cosmetic & Personal Care
  • Pharmaceuticals
  • Electronics
  • Other

Region:

  • North America
    • USA
    • Canada
    • Mexico
  • Latin America
    • Brazil
    • Chile
    • Rest of Latin America
  • Western Europe
    • Germany
    • UK
    • Italy
    • Spain
    • France
    • Nordic
    • BENELUX
    • Rest of Western Europe
  • Eastern Europe
    • Russia
    • Poland
    • Hungary
    • Balkan & Baltic
    • Rest of Eastern Europe
  • East Asia
    • China
    • Japan
    • South Korea
  • South Asia and Pacific
    • India
    • ASEAN
    • Australia & New Zealand
    • Rest of South Asia and Pacific
  • Middle East & Africa
    • Kingdom of Saudi Arabia
    • Other GCC Countries
    • Turkiye
    • South Africa
    • Other African Union
    • Rest of Middle East & Africa

Table of Content

  1. Executive Summary
    • Global Market Outlook
    • Demand-side Trends
    • Supply-side Trends
    • Technology Roadmap Analysis
    • Analysis and Recommendations
  2. Market Overview
    • Market Coverage / Taxonomy
    • Market Definition / Scope / Limitations
  3. Market Background
    • Market Dynamics
      • Drivers
      • Restraints
      • Opportunity
      • Trends
    • Scenario Forecast
      • Demand in Optimistic Scenario
      • Demand in Likely Scenario
      • Demand in Conservative Scenario
    • Opportunity Map Analysis
    • Product Life Cycle Analysis
    • Supply Chain Analysis
    • Investment Feasibility Matrix
    • Value Chain Analysis
    • PESTLE and Porter’s Analysis
    • Regulatory Landscape
    • Regional Parent Market Outlook
    • Production and Consumption Statistics
    • Import and Export Statistics
  4. Global Market Analysis 2020 to 2024 and Forecast, 2025 to 2035
    • Historical Market Size Value (USD Million) Analysis, 2020 to 2024
    • Current and Future Market Size Value (USD Million) Projections, 2025 to 2035
      • Y-o-Y Growth Trend Analysis
      • Absolute $ Opportunity Analysis
  5. Global Market Pricing Analysis 2020 to 2024 and Forecast 2025 to 2035
  6. Global Market Analysis 2020 to 2024 and Forecast 2025 to 2035, By Composition
    • Introduction / Key Findings
    • Historical Market Size Value (USD Million) Analysis By Composition , 2020 to 2024
    • Current and Future Market Size Value (USD Million) Analysis and Forecast By Composition , 2025 to 2035
      • Facestock
      • Adhesive
      • Release Liner
    • Y-o-Y Growth Trend Analysis By Composition , 2020 to 2024
    • Absolute $ Opportunity Analysis By Composition , 2025 to 2035
  7. Global Market Analysis 2020 to 2024 and Forecast 2025 to 2035, By Material
    • Introduction / Key Findings
    • Historical Market Size Value (USD Million) Analysis By Material, 2020 to 2024
    • Current and Future Market Size Value (USD Million) Analysis and Forecast By Material, 2025 to 2035
      • Paper
      • Polyester
      • Vinyl
      • Other
    • Y-o-Y Growth Trend Analysis By Material, 2020 to 2024
    • Absolute $ Opportunity Analysis By Material, 2025 to 2035
  8. Global Market Analysis 2020 to 2024 and Forecast 2025 to 2035, By Printing Technology
    • Introduction / Key Findings
    • Historical Market Size Value (USD Million) Analysis By Printing Technology, 2020 to 2024
    • Current and Future Market Size Value (USD Million) Analysis and Forecast By Printing Technology, 2025 to 2035
      • Flexographic
      • Lithography
    • Y-o-Y Growth Trend Analysis By Printing Technology, 2020 to 2024
    • Absolute $ Opportunity Analysis By Printing Technology, 2025 to 2035
  9. Global Market Analysis 2020 to 2024 and Forecast 2025 to 2035, By End Use Industry
    • Introduction / Key Findings
    • Historical Market Size Value (USD Million) Analysis By End Use Industry, 2020 to 2024
    • Current and Future Market Size Value (USD Million) Analysis and Forecast By End Use Industry, 2025 to 2035
      • Food And Beverages
      • Cosmetic & Personal Care
      • Pharmaceuticals
      • Electronics
      • Other
    • Y-o-Y Growth Trend Analysis By End Use Industry, 2020 to 2024
    • Absolute $ Opportunity Analysis By End Use Industry, 2025 to 2035
  10. Global Market Analysis 2020 to 2024 and Forecast 2025 to 2035, By Region
    • Introduction
    • Historical Market Size Value (USD Million) Analysis By Region, 2020 to 2024
    • Current Market Size Value (USD Million) Analysis and Forecast By Region, 2025 to 2035
      • North America
      • Latin America
      • Western Europe
      • Eastern Europe
      • East Asia
      • South Asia and Pacific
      • Middle East & Africa
    • Market Attractiveness Analysis By Region
  11. North America Market Analysis 2020 to 2024 and Forecast 2025 to 2035, By Country
    • Historical Market Size Value (USD Million) Trend Analysis By Market Taxonomy, 2020 to 2024
    • Market Size Value (USD Million) Forecast By Market Taxonomy, 2025 to 2035
      • By Country
        • USA
        • Canada
        • Mexico
      • By Composition
      • By Material
      • By Printing Technology
      • By End Use Industry
    • Market Attractiveness Analysis
      • By Country
      • By Composition
      • By Material
      • By Printing Technology
      • By End Use Industry
    • Key Takeaways
  12. Latin America Market Analysis 2020 to 2024 and Forecast 2025 to 2035, By Country
    • Historical Market Size Value (USD Million) Trend Analysis By Market Taxonomy, 2020 to 2024
    • Market Size Value (USD Million) Forecast By Market Taxonomy, 2025 to 2035
      • By Country
        • Brazil
        • Chile
        • Rest of Latin America
      • By Composition
      • By Material
      • By Printing Technology
      • By End Use Industry
    • Market Attractiveness Analysis
      • By Country
      • By Composition
      • By Material
      • By Printing Technology
      • By End Use Industry
    • Key Takeaways
  13. Western Europe Market Analysis 2020 to 2024 and Forecast 2025 to 2035, By Country
    • Historical Market Size Value (USD Million) Trend Analysis By Market Taxonomy, 2020 to 2024
    • Market Size Value (USD Million) Forecast By Market Taxonomy, 2025 to 2035
      • By Country
        • Germany
        • UK
        • Italy
        • Spain
        • France
        • Nordic
        • BENELUX
        • Rest of Western Europe
      • By Composition
      • By Material
      • By Printing Technology
      • By End Use Industry
    • Market Attractiveness Analysis
      • By Country
      • By Composition
      • By Material
      • By Printing Technology
      • By End Use Industry
    • Key Takeaways
  14. Eastern Europe Market Analysis 2020 to 2024 and Forecast 2025 to 2035, By Country
    • Historical Market Size Value (USD Million) Trend Analysis By Market Taxonomy, 2020 to 2024
    • Market Size Value (USD Million) Forecast By Market Taxonomy, 2025 to 2035
      • By Country
        • Russia
        • Poland
        • Hungary
        • Balkan & Baltic
        • Rest of Eastern Europe
      • By Composition
      • By Material
      • By Printing Technology
      • By End Use Industry
    • Market Attractiveness Analysis
      • By Country
      • By Composition
      • By Material
      • By Printing Technology
      • By End Use Industry
    • Key Takeaways
  15. East Asia Market Analysis 2020 to 2024 and Forecast 2025 to 2035, By Country
    • Historical Market Size Value (USD Million) Trend Analysis By Market Taxonomy, 2020 to 2024
    • Market Size Value (USD Million) Forecast By Market Taxonomy, 2025 to 2035
      • By Country
        • China
        • Japan
        • South Korea
      • By Composition
      • By Material
      • By Printing Technology
      • By End Use Industry
    • Market Attractiveness Analysis
      • By Country
      • By Composition
      • By Material
      • By Printing Technology
      • By End Use Industry
    • Key Takeaways
  16. South Asia and Pacific Market Analysis 2020 to 2024 and Forecast 2025 to 2035, By Country
    • Historical Market Size Value (USD Million) Trend Analysis By Market Taxonomy, 2020 to 2024
    • Market Size Value (USD Million) Forecast By Market Taxonomy, 2025 to 2035
      • By Country
        • India
        • ASEAN
        • Australia & New Zealand
        • Rest of South Asia and Pacific
      • By Composition
      • By Material
      • By Printing Technology
      • By End Use Industry
    • Market Attractiveness Analysis
      • By Country
      • By Composition
      • By Material
      • By Printing Technology
      • By End Use Industry
    • Key Takeaways
  17. Middle East & Africa Market Analysis 2020 to 2024 and Forecast 2025 to 2035, By Country
    • Historical Market Size Value (USD Million) Trend Analysis By Market Taxonomy, 2020 to 2024
    • Market Size Value (USD Million) Forecast By Market Taxonomy, 2025 to 2035
      • By Country
        • Kingdom of Saudi Arabia
        • Other GCC Countries
        • Turkiye
        • South Africa
        • Other African Union
        • Rest of Middle East & Africa
      • By Composition
      • By Material
      • By Printing Technology
      • By End Use Industry
    • Market Attractiveness Analysis
      • By Country
      • By Composition
      • By Material
      • By Printing Technology
      • By End Use Industry
    • Key Takeaways
  18. Key Countries Market Analysis
    • USA
      • Pricing Analysis
      • Market Share Analysis, 2024
        • By Composition
        • By Material
        • By Printing Technology
        • By End Use Industry
    • Canada
      • Pricing Analysis
      • Market Share Analysis, 2024
        • By Composition
        • By Material
        • By Printing Technology
        • By End Use Industry
    • Mexico
      • Pricing Analysis
      • Market Share Analysis, 2024
        • By Composition
        • By Material
        • By Printing Technology
        • By End Use Industry
    • Brazil
      • Pricing Analysis
      • Market Share Analysis, 2024
        • By Composition
        • By Material
        • By Printing Technology
        • By End Use Industry
    • Chile
      • Pricing Analysis
      • Market Share Analysis, 2024
        • By Composition
        • By Material
        • By Printing Technology
        • By End Use Industry
    • Germany
      • Pricing Analysis
      • Market Share Analysis, 2024
        • By Composition
        • By Material
        • By Printing Technology
        • By End Use Industry
    • UK
      • Pricing Analysis
      • Market Share Analysis, 2024
        • By Composition
        • By Material
        • By Printing Technology
        • By End Use Industry
    • Italy
      • Pricing Analysis
      • Market Share Analysis, 2024
        • By Composition
        • By Material
        • By Printing Technology
        • By End Use Industry
    • Spain
      • Pricing Analysis
      • Market Share Analysis, 2024
        • By Composition
        • By Material
        • By Printing Technology
        • By End Use Industry
    • France
      • Pricing Analysis
      • Market Share Analysis, 2024
        • By Composition
        • By Material
        • By Printing Technology
        • By End Use Industry
    • India
      • Pricing Analysis
      • Market Share Analysis, 2024
        • By Composition
        • By Material
        • By Printing Technology
        • By End Use Industry
    • ASEAN
      • Pricing Analysis
      • Market Share Analysis, 2024
        • By Composition
        • By Material
        • By Printing Technology
        • By End Use Industry
    • Australia & New Zealand
      • Pricing Analysis
      • Market Share Analysis, 2024
        • By Composition
        • By Material
        • By Printing Technology
        • By End Use Industry
    • China
      • Pricing Analysis
      • Market Share Analysis, 2024
        • By Composition
        • By Material
        • By Printing Technology
        • By End Use Industry
    • Japan
      • Pricing Analysis
      • Market Share Analysis, 2024
        • By Composition
        • By Material
        • By Printing Technology
        • By End Use Industry
    • South Korea
      • Pricing Analysis
      • Market Share Analysis, 2024
        • By Composition
        • By Material
        • By Printing Technology
        • By End Use Industry
    • Russia
      • Pricing Analysis
      • Market Share Analysis, 2024
        • By Composition
        • By Material
        • By Printing Technology
        • By End Use Industry
    • Poland
      • Pricing Analysis
      • Market Share Analysis, 2024
        • By Composition
        • By Material
        • By Printing Technology
        • By End Use Industry
    • Hungary
      • Pricing Analysis
      • Market Share Analysis, 2024
        • By Composition
        • By Material
        • By Printing Technology
        • By End Use Industry
    • Kingdom of Saudi Arabia
      • Pricing Analysis
      • Market Share Analysis, 2024
        • By Composition
        • By Material
        • By Printing Technology
        • By End Use Industry
    • Turkiye
      • Pricing Analysis
      • Market Share Analysis, 2024
        • By Composition
        • By Material
        • By Printing Technology
        • By End Use Industry
    • South Africa
      • Pricing Analysis
      • Market Share Analysis, 2024
        • By Composition
        • By Material
        • By Printing Technology
        • By End Use Industry
  19. Market Structure Analysis
    • Competition Dashboard
    • Competition Benchmarking
    • Market Share Analysis of Top Players
      • By Regional
      • By Composition
      • By Material
      • By Printing Technology
      • By End Use Industry
  20. Competition Analysis
    • Competition Deep Dive
      • Coding Solutions
        • Overview
        • Product Portfolio
        • Profitability by Market Segments (Product/Age /Sales Channel/Region)
        • Sales Footprint
        • Strategy Overview
          • Marketing Strategy
          • Product Strategy
          • Channel Strategy
      • New York Label & Box Works
      • Ready Print Limited
      • Rebsons LabelsHub Labels
      • Blanco
      • Consolidated Label
      • RGS Labels
      • Performance Label Company
  21. Assumptions & Acronyms Used
  22. Research Methodology

List of Tables

  • Table 1: Global Market Value (USD Million) Forecast by Region, 2020 to 2035
  • Table 2: Global Market Value (USD Million) Forecast by Composition , 2020 to 2035
  • Table 3: Global Market Value (USD Million) Forecast by Material, 2020 to 2035
  • Table 4: Global Market Value (USD Million) Forecast by Printing Technology, 2020 to 2035
  • Table 5: Global Market Value (USD Million) Forecast by End Use Industry, 2020 to 2035
  • Table 6: North America Market Value (USD Million) Forecast by Country, 2020 to 2035
  • Table 7: North America Market Value (USD Million) Forecast by Composition , 2020 to 2035
  • Table 8: North America Market Value (USD Million) Forecast by Material, 2020 to 2035
  • Table 9: North America Market Value (USD Million) Forecast by Printing Technology, 2020 to 2035
  • Table 10: North America Market Value (USD Million) Forecast by End Use Industry, 2020 to 2035
  • Table 11: Latin America Market Value (USD Million) Forecast by Country, 2020 to 2035
  • Table 12: Latin America Market Value (USD Million) Forecast by Composition , 2020 to 2035
  • Table 13: Latin America Market Value (USD Million) Forecast by Material, 2020 to 2035
  • Table 14: Latin America Market Value (USD Million) Forecast by Printing Technology, 2020 to 2035
  • Table 15: Latin America Market Value (USD Million) Forecast by End Use Industry, 2020 to 2035
  • Table 16: Western Europe Market Value (USD Million) Forecast by Country, 2020 to 2035
  • Table 17: Western Europe Market Value (USD Million) Forecast by Composition , 2020 to 2035
  • Table 18: Western Europe Market Value (USD Million) Forecast by Material, 2020 to 2035
  • Table 19: Western Europe Market Value (USD Million) Forecast by Printing Technology, 2020 to 2035
  • Table 20: Western Europe Market Value (USD Million) Forecast by End Use Industry, 2020 to 2035
  • Table 21: Eastern Europe Market Value (USD Million) Forecast by Country, 2020 to 2035
  • Table 22: Eastern Europe Market Value (USD Million) Forecast by Composition , 2020 to 2035
  • Table 23: Eastern Europe Market Value (USD Million) Forecast by Material, 2020 to 2035
  • Table 24: Eastern Europe Market Value (USD Million) Forecast by Printing Technology, 2020 to 2035
  • Table 25: Eastern Europe Market Value (USD Million) Forecast by End Use Industry, 2020 to 2035
  • Table 26: East Asia Market Value (USD Million) Forecast by Country, 2020 to 2035
  • Table 27: East Asia Market Value (USD Million) Forecast by Composition , 2020 to 2035
  • Table 28: East Asia Market Value (USD Million) Forecast by Material, 2020 to 2035
  • Table 29: East Asia Market Value (USD Million) Forecast by Printing Technology, 2020 to 2035
  • Table 30: East Asia Market Value (USD Million) Forecast by End Use Industry, 2020 to 2035
  • Table 31: South Asia and Pacific Market Value (USD Million) Forecast by Country, 2020 to 2035
  • Table 32: South Asia and Pacific Market Value (USD Million) Forecast by Composition , 2020 to 2035
  • Table 33: South Asia and Pacific Market Value (USD Million) Forecast by Material, 2020 to 2035
  • Table 34: South Asia and Pacific Market Value (USD Million) Forecast by Printing Technology, 2020 to 2035
  • Table 35: South Asia and Pacific Market Value (USD Million) Forecast by End Use Industry, 2020 to 2035
  • Table 36: Middle East & Africa Market Value (USD Million) Forecast by Country, 2020 to 2035
  • Table 37: Middle East & Africa Market Value (USD Million) Forecast by Composition , 2020 to 2035
  • Table 38: Middle East & Africa Market Value (USD Million) Forecast by Material, 2020 to 2035
  • Table 39: Middle East & Africa Market Value (USD Million) Forecast by Printing Technology, 2020 to 2035
  • Table 40: Middle East & Africa Market Value (USD Million) Forecast by End Use Industry, 2020 to 2035

List of Figures

  • Figure 1: Global Market Pricing Analysis
  • Figure 2: Global Market Value (USD Million) Forecast 2020 to 2035
  • Figure 3: Global Market Value Share and BPS Analysis by Composition , 2025 and 2035
  • Figure 4: Global Market Y-o-Y Growth Comparison by Composition , 2025 to 2035
  • Figure 5: Global Market Attractiveness Analysis by Composition
  • Figure 6: Global Market Value Share and BPS Analysis by Material, 2025 and 2035
  • Figure 7: Global Market Y-o-Y Growth Comparison by Material, 2025 to 2035
  • Figure 8: Global Market Attractiveness Analysis by Material
  • Figure 9: Global Market Value Share and BPS Analysis by Printing Technology, 2025 and 2035
  • Figure 10: Global Market Y-o-Y Growth Comparison by Printing Technology, 2025 to 2035
  • Figure 11: Global Market Attractiveness Analysis by Printing Technology
  • Figure 12: Global Market Value Share and BPS Analysis by End Use Industry, 2025 and 2035
  • Figure 13: Global Market Y-o-Y Growth Comparison by End Use Industry, 2025 to 2035
  • Figure 14: Global Market Attractiveness Analysis by End Use Industry
  • Figure 15: Global Market Value (USD Million) Share and BPS Analysis by Region, 2025 and 2035
  • Figure 16: Global Market Y-o-Y Growth Comparison by Region, 2025 to 2035
  • Figure 17: Global Market Attractiveness Analysis by Region
  • Figure 18: North America Market Incremental Dollar Opportunity, 2025 to 2035
  • Figure 19: Latin America Market Incremental Dollar Opportunity, 2025 to 2035
  • Figure 20: Western Europe Market Incremental Dollar Opportunity, 2025 to 2035
  • Figure 21: Eastern Europe Market Incremental Dollar Opportunity, 2025 to 2035
  • Figure 22: East Asia Market Incremental Dollar Opportunity, 2025 to 2035
  • Figure 23: South Asia and Pacific Market Incremental Dollar Opportunity, 2025 to 2035
  • Figure 24: Middle East & Africa Market Incremental Dollar Opportunity, 2025 to 2035
  • Figure 25: North America Market Value Share and BPS Analysis by Country, 2025 and 2035
  • Figure 26: North America Market Value Share and BPS Analysis by Composition , 2025 and 2035
  • Figure 27: North America Market Y-o-Y Growth Comparison by Composition , 2025 to 2035
  • Figure 28: North America Market Attractiveness Analysis by Composition
  • Figure 29: North America Market Value Share and BPS Analysis by Material, 2025 and 2035
  • Figure 30: North America Market Y-o-Y Growth Comparison by Material, 2025 to 2035
  • Figure 31: North America Market Attractiveness Analysis by Material
  • Figure 32: North America Market Value Share and BPS Analysis by Printing Technology, 2025 and 2035
  • Figure 33: North America Market Y-o-Y Growth Comparison by Printing Technology, 2025 to 2035
  • Figure 34: North America Market Attractiveness Analysis by Printing Technology
  • Figure 35: North America Market Value Share and BPS Analysis by End Use Industry, 2025 and 2035
  • Figure 36: North America Market Y-o-Y Growth Comparison by End Use Industry, 2025 to 2035
  • Figure 37: North America Market Attractiveness Analysis by End Use Industry
  • Figure 38: Latin America Market Value Share and BPS Analysis by Country, 2025 and 2035
  • Figure 39: Latin America Market Value Share and BPS Analysis by Composition , 2025 and 2035
  • Figure 40: Latin America Market Y-o-Y Growth Comparison by Composition , 2025 to 2035
  • Figure 41: Latin America Market Attractiveness Analysis by Composition
  • Figure 42: Latin America Market Value Share and BPS Analysis by Material, 2025 and 2035
  • Figure 43: Latin America Market Y-o-Y Growth Comparison by Material, 2025 to 2035
  • Figure 44: Latin America Market Attractiveness Analysis by Material
  • Figure 45: Latin America Market Value Share and BPS Analysis by Printing Technology, 2025 and 2035
  • Figure 46: Latin America Market Y-o-Y Growth Comparison by Printing Technology, 2025 to 2035
  • Figure 47: Latin America Market Attractiveness Analysis by Printing Technology
  • Figure 48: Latin America Market Value Share and BPS Analysis by End Use Industry, 2025 and 2035
  • Figure 49: Latin America Market Y-o-Y Growth Comparison by End Use Industry, 2025 to 2035
  • Figure 50: Latin America Market Attractiveness Analysis by End Use Industry
  • Figure 51: Western Europe Market Value Share and BPS Analysis by Country, 2025 and 2035
  • Figure 52: Western Europe Market Value Share and BPS Analysis by Composition , 2025 and 2035
  • Figure 53: Western Europe Market Y-o-Y Growth Comparison by Composition , 2025 to 2035
  • Figure 54: Western Europe Market Attractiveness Analysis by Composition
  • Figure 55: Western Europe Market Value Share and BPS Analysis by Material, 2025 and 2035
  • Figure 56: Western Europe Market Y-o-Y Growth Comparison by Material, 2025 to 2035
  • Figure 57: Western Europe Market Attractiveness Analysis by Material
  • Figure 58: Western Europe Market Value Share and BPS Analysis by Printing Technology, 2025 and 2035
  • Figure 59: Western Europe Market Y-o-Y Growth Comparison by Printing Technology, 2025 to 2035
  • Figure 60: Western Europe Market Attractiveness Analysis by Printing Technology
  • Figure 61: Western Europe Market Value Share and BPS Analysis by End Use Industry, 2025 and 2035
  • Figure 62: Western Europe Market Y-o-Y Growth Comparison by End Use Industry, 2025 to 2035
  • Figure 63: Western Europe Market Attractiveness Analysis by End Use Industry
  • Figure 64: Eastern Europe Market Value Share and BPS Analysis by Country, 2025 and 2035
  • Figure 65: Eastern Europe Market Value Share and BPS Analysis by Composition , 2025 and 2035
  • Figure 66: Eastern Europe Market Y-o-Y Growth Comparison by Composition , 2025 to 2035
  • Figure 67: Eastern Europe Market Attractiveness Analysis by Composition
  • Figure 68: Eastern Europe Market Value Share and BPS Analysis by Material, 2025 and 2035
  • Figure 69: Eastern Europe Market Y-o-Y Growth Comparison by Material, 2025 to 2035
  • Figure 70: Eastern Europe Market Attractiveness Analysis by Material
  • Figure 71: Eastern Europe Market Value Share and BPS Analysis by Printing Technology, 2025 and 2035
  • Figure 72: Eastern Europe Market Y-o-Y Growth Comparison by Printing Technology, 2025 to 2035
  • Figure 73: Eastern Europe Market Attractiveness Analysis by Printing Technology
  • Figure 74: Eastern Europe Market Value Share and BPS Analysis by End Use Industry, 2025 and 2035
  • Figure 75: Eastern Europe Market Y-o-Y Growth Comparison by End Use Industry, 2025 to 2035
  • Figure 76: Eastern Europe Market Attractiveness Analysis by End Use Industry
  • Figure 77: East Asia Market Value Share and BPS Analysis by Country, 2025 and 2035
  • Figure 78: East Asia Market Value Share and BPS Analysis by Composition , 2025 and 2035
  • Figure 79: East Asia Market Y-o-Y Growth Comparison by Composition , 2025 to 2035
  • Figure 80: East Asia Market Attractiveness Analysis by Composition
  • Figure 81: East Asia Market Value Share and BPS Analysis by Material, 2025 and 2035
  • Figure 82: East Asia Market Y-o-Y Growth Comparison by Material, 2025 to 2035
  • Figure 83: East Asia Market Attractiveness Analysis by Material
  • Figure 84: East Asia Market Value Share and BPS Analysis by Printing Technology, 2025 and 2035
  • Figure 85: East Asia Market Y-o-Y Growth Comparison by Printing Technology, 2025 to 2035
  • Figure 86: East Asia Market Attractiveness Analysis by Printing Technology
  • Figure 87: East Asia Market Value Share and BPS Analysis by End Use Industry, 2025 and 2035
  • Figure 88: East Asia Market Y-o-Y Growth Comparison by End Use Industry, 2025 to 2035
  • Figure 89: East Asia Market Attractiveness Analysis by End Use Industry
  • Figure 90: South Asia and Pacific Market Value Share and BPS Analysis by Country, 2025 and 2035
  • Figure 91: South Asia and Pacific Market Value Share and BPS Analysis by Composition , 2025 and 2035
  • Figure 92: South Asia and Pacific Market Y-o-Y Growth Comparison by Composition , 2025 to 2035
  • Figure 93: South Asia and Pacific Market Attractiveness Analysis by Composition
  • Figure 94: South Asia and Pacific Market Value Share and BPS Analysis by Material, 2025 and 2035
  • Figure 95: South Asia and Pacific Market Y-o-Y Growth Comparison by Material, 2025 to 2035
  • Figure 96: South Asia and Pacific Market Attractiveness Analysis by Material
  • Figure 97: South Asia and Pacific Market Value Share and BPS Analysis by Printing Technology, 2025 and 2035
  • Figure 98: South Asia and Pacific Market Y-o-Y Growth Comparison by Printing Technology, 2025 to 2035
  • Figure 99: South Asia and Pacific Market Attractiveness Analysis by Printing Technology
  • Figure 100: South Asia and Pacific Market Value Share and BPS Analysis by End Use Industry, 2025 and 2035
  • Figure 101: South Asia and Pacific Market Y-o-Y Growth Comparison by End Use Industry, 2025 to 2035
  • Figure 102: South Asia and Pacific Market Attractiveness Analysis by End Use Industry
  • Figure 103: Middle East & Africa Market Value Share and BPS Analysis by Country, 2025 and 2035
  • Figure 104: Middle East & Africa Market Value Share and BPS Analysis by Composition , 2025 and 2035
  • Figure 105: Middle East & Africa Market Y-o-Y Growth Comparison by Composition , 2025 to 2035
  • Figure 106: Middle East & Africa Market Attractiveness Analysis by Composition
  • Figure 107: Middle East & Africa Market Value Share and BPS Analysis by Material, 2025 and 2035
  • Figure 108: Middle East & Africa Market Y-o-Y Growth Comparison by Material, 2025 to 2035
  • Figure 109: Middle East & Africa Market Attractiveness Analysis by Material
  • Figure 110: Middle East & Africa Market Value Share and BPS Analysis by Printing Technology, 2025 and 2035
  • Figure 111: Middle East & Africa Market Y-o-Y Growth Comparison by Printing Technology, 2025 to 2035
  • Figure 112: Middle East & Africa Market Attractiveness Analysis by Printing Technology
  • Figure 113: Middle East & Africa Market Value Share and BPS Analysis by End Use Industry, 2025 and 2035
  • Figure 114: Middle East & Africa Market Y-o-Y Growth Comparison by End Use Industry, 2025 to 2035
  • Figure 115: Middle East & Africa Market Attractiveness Analysis by End Use Industry
  • Figure 116: Global Market – Tier Structure Analysis
  • Figure 117: Global Market – Company Share Analysis

Frequently Asked Questions

How big is the sheeted labels market in 2025?

The global sheeted labels market is estimated to be valued at USD 2.9 billion in 2025.

What will be the size of sheeted labels market in 2035?

The market size for the sheeted labels market is projected to reach USD 6.0 billion by 2035.

How much will be the sheeted labels market growth between 2025 and 2035?

The sheeted labels market is expected to grow at a 7.6% CAGR between 2025 and 2035.

What are the key product types in the sheeted labels market?

The key product types in sheeted labels market are facestock, adhesive and release liner.

Which material segment to contribute significant share in the sheeted labels market in 2025?

In terms of material, paper segment to command 34.5% share in the sheeted labels market in 2025.

Explore Similar Insights

Future Market Insights

Sheeted Labels Market

Chat With

MaRIA

Hi There, I am MaRIA, Your Market Research Intelligence Assistant. How may I help you?