Insight only matters if it leads to action. Our numbers hold up under CFO and procurement scrutiny, our scenarios stay relevant when markets change, and our dashboards are designed for teams that act, not just analyze.
Every decision is linked to an owner, a date, and defined parameters such as entry sequence or price band. Partner and channel frameworks include guardrails for risk and compliance. Each scenario outlines what to do when conditions shift so responses are immediate and disciplined.
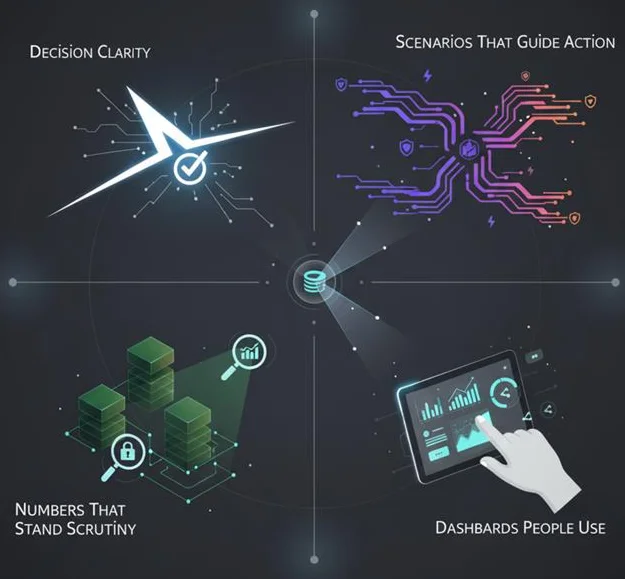
Each scenario defines how decisions evolve under changing conditions. Triggers and mitigations are pre-set: if a price index rises by a certain percentage, or if demand falls beyond a threshold, the next step is already clear. Every plan is tested against tariff, currency, and regulatory shocks, as well as supply and demand disruptions.
Every figure is backed by an evidence ledger, explicit assumptions, and a clear audit trail. Each model includes unit economics, sensitivity ranges, and scenario cards that show how results hold under different conditions.
Each dashboard we build presents essential metrics in a single view, organized by role and ownership. Quarterly tracking connects KPIs to accountable teams, keeping performance visible and comparable across cycles.

Made for teams that act, not just analyze.
Executive briefs, detailed models, and 16:9 dashboards that track outcomes quarter after quarter, spanning sourcing, manufacturing, GTM, partnerships, and compliance.
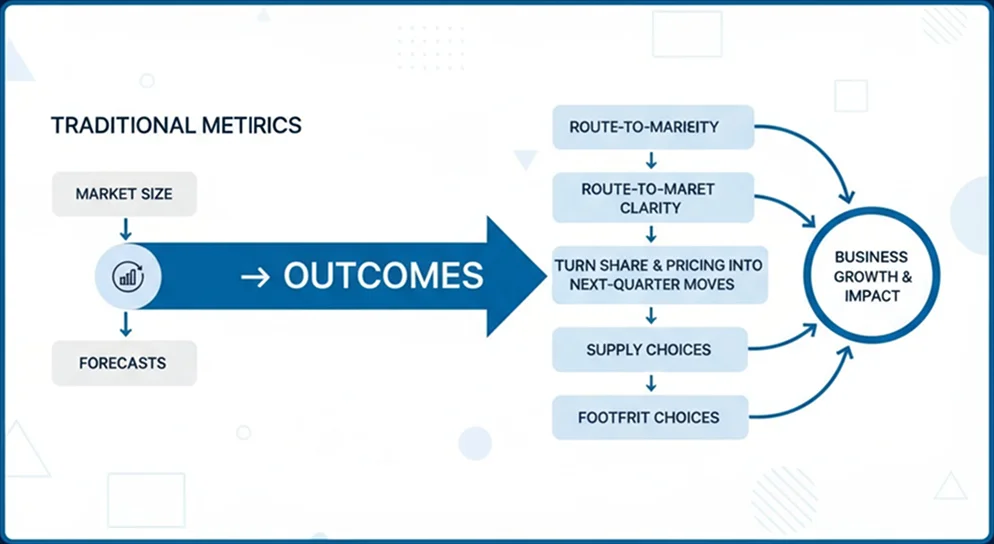
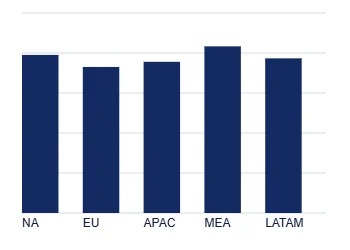
A preview of how we turn data into decision-grade dashboards that update easily with your latest KPI inputs.
| Aspect | Typical Research Firm | FMI |
|---|---|---|
| Purpose | Shares market information | Helps teams make decisions that influence profit and growth |
| Engagement Completion | Ends with a delivered report | Ends with an action taken and results tracked |
| Market size use | Treated as the final output | Used as input for portfolio, pricing, and rollout choices |
| Deliverables | Static PDFs and online portals | Action briefs, models, dashboards, and playbooks |
| Customization | Mostly generic, one-size-fits-all | Tailored to role, decision, and business context |
| Scenario planning | Basic or limited | “If X changes, do Y” playbooks with clear triggers |
| Sourcing & footprint | Usually excluded | Includes supplier options, cost models, and payback analysis |
| Go-to-market | General recommendations | Detailed entry plans, price bands, and channel budgets |
| Partner strategy | Conceptual advice | Concrete plans with value logic |
| KPI ownership | Rarely defined | Agreed upfront and reviewed quarterly |
| After delivery | Short Q&A follow-up | Continuous tracking and course correction |
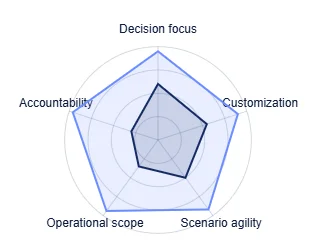

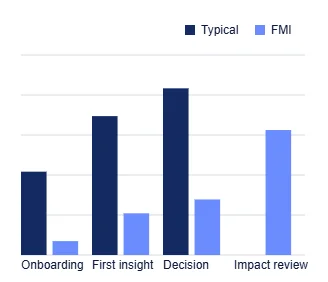
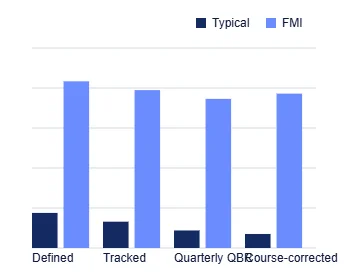
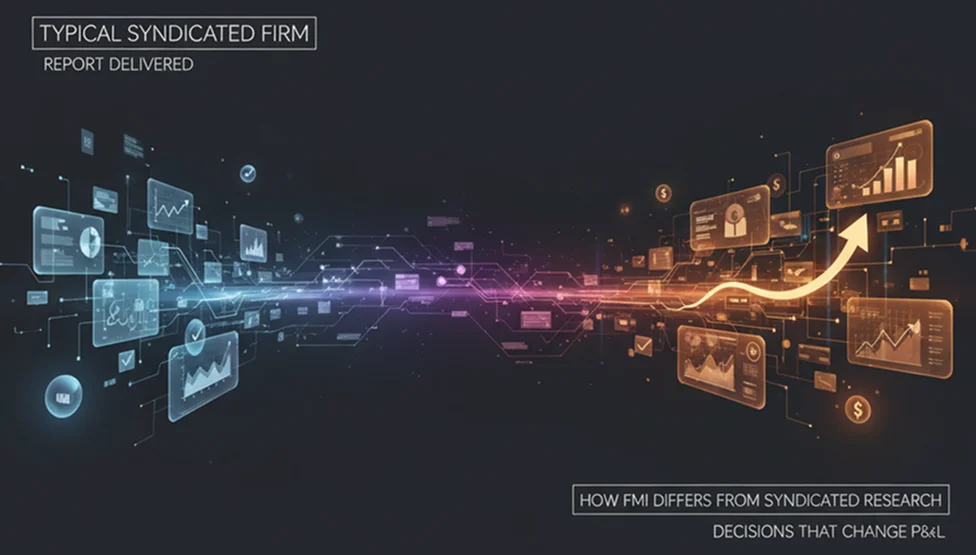
Unlike syndicated subscriptions that end with delivery, FMI programs continue through quarterly checkpoints to measure what changed.
BRONZE STEVIE®
Recognized for:
Thought Leadership in Sustainable Packaging
in 20th annual IBAs.
Certified Member
*Esomar is a business community of insights and analytics.
Member of
Greater New York, Chamber of Commerce
Recognized by
Top Business Intelligence Consulting Company 2024
Yes, but only as inputs. Size, growth, share, price, and channel splits are used to inform portfolio, capacity, pricing, and rollout decisions.
Every program includes an Outcome Tracker with baseline KPIs, targets, and quarterly actuals reviewed in QBRs. Success is defined by actions taken and value created.
You receive decision briefs, option models, dashboards, and execution playbooks, each tied to owners, timelines, and trigger-based scenarios.
We cover Food & Beverage, Packaging, Chemicals & Materials, Healthcare & MedTech, Technology & Industrial, Consumer Goods, and Mobility & Equipment, along with adjacent categories on request.
Projects typically run four weeks: frame the problem, model the evidence, decide, and move straight into a 90-day execution cycle.
We combine primary interviews with data from industry associations, company filings, trade flows, and price or commodity indices. Where clients allow, we also connect to internal systems such as CRM, ERP, or PLM to ground our analysis in real operating data.
Each assumption is logged in the Assumption Register and tested through the Scenario Lab (e.g., “if X ± Y %, then do Z”). Every assumption has an owner and a validation method.
Yes. We connect with your BI stack and secure data rooms. Dashboards are delivered as single-page 16:9 views with PNG, CSV, and PPT exports plus role-based filters.
KPIs are set collaboratively during project framing. The goal is to track only what moves the business cost and delivery in sourcing, efficiency in manufacturing, or pricing and margin in commercial functions.
Our pricing is program-based. Most clients choose an annual plan that covers delivery, quarterly reviews, and scenario updates as markets shift. We also run shorter pilot engagements for specific challenges or proof of concept.
We operate under strict NDAs, follow regional data-privacy regimes, and apply full citation and source-rating within the Evidence Ledger for auditability.
After delivery, we continue tracking signals and adjusting models each quarter to keep your strategy live.

Thank you!
You will receive an email from our Business Development Manager. Please be sure to check your SPAM/JUNK folder too.
Chat With
MaRIA