Reports

- Global Locations -

Headquarters

Future Market Insights, Inc.

Christiana Corporate, 200
Continental Drive, Suite 401,
Newark, Delaware - 19713,
United States

T: +1-845-579-5705

Americas

Future Market Insights, Inc.

616 Corporate Way, Suite 2-9018,
Valley Cottage, NY 10989, United States

T: +1-347-918-3531

MEA

Future Market Insights

1602-6 Jumeirah Bay X2 Tower, Plot No: JLT-PH2-X2A,
Jumeirah Lakes Towers, Dubai,
United Arab Emirates

Europe

Future Market Insights

3rd Floor, 207 Regent Street,
W1B 3HH London
United Kingdom

T: + 44 (0) 20 8123 9659
D: +44 (0) 20 3287 4268

Asia Pacific

Future Market Insights

IndiaLand Global Tech Park, Unit UG-1, Behind Grand HighStreet, Phase 1, Hinjawadi, MH, Pune – 411057, India

Ready-to-eat Food Market Outlook from 2024 to 2034

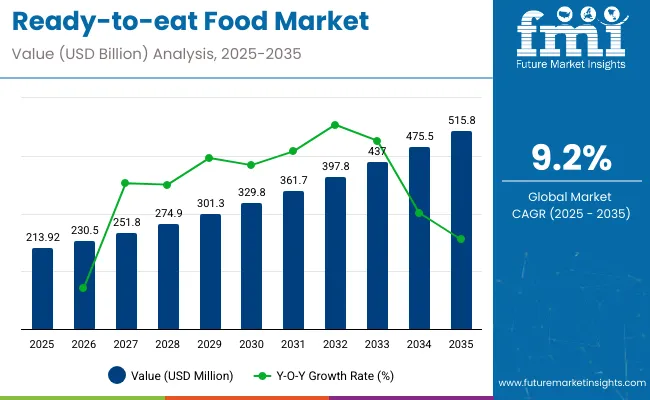
The global ready-to-eat food market is expected to reach US$ 195.9 billion in 2024 and US$ 391.1 billion by 2034. By 2034, the market is projected to rise at a 9.2% CAGR.

Attributes Key Insights
Estimated Global Ready-to-eat Food Market Size (2024E) US$ 195.9 billion
Projected Ready-to-eat Food Market Value (2034F) US$ 391.1 billion
Value-based CAGR (2024 to 2034) 9.2%

Growing consumer desire for long-lasting, minimally processed, additive-free food items is anticipated to drive market expansion. Consumers are gravitating toward meals that are easy to prepare. Due to their busy work schedules, people all around the world are purchasing ready-to-eat (RTE) food items and meals.

Rising busy lifestyles, working-class individuals, teenagers, hostel residents, and single people are expected to push the demand for ready-to-eat food. The flavor and convenience of ready-to-eat food products have led to a trend among young people to replace traditional meals with ready-to-eat meals. This is anticipated to drive the market's expansion.

The food service industry, including hotels, restaurants, cafes, and bakeries, plays a significant role in driving the growth of the ready-to-eat food market. These establishments cater to the increasing consumer preference for convenient and on-the-go food options.

Urban lives, increasing distances between home & workplace, women at work, and changes in family cohesion are also contributing to the increasing demand for processed, ready-to-eat foods. This is resulting in a very active food processing industry in terms of manufacturing RTE food globally.

Don't pay for what you don't need

Customize your report by selecting specific countries or regions and save 30%!

2019 to 2023 Global Ready-to-eat Food Market Sales Outlook Vs. 2024 to 2034

Ready-to-eat food sales grew at a CAGR of 7.1% from 2019 to 2023. By 2034, the worldwide market for ready-to-eat food is expected to surge at a 9.2% CAGR.

The consumer convenience factor was a key driver of market growth from 2019 to 2023. Consumers with busy lifestyles were gravitating toward ready-to-eat options as a quick and hassle-free meal solution. This era witnessed a wave of innovation in the RTE market.

At this stage, the demand for frozen, prepared foods increased rapidly. These meals catered to consumers' desire for nutritious and balanced options, offering convenience and a quality dining experience.

Today, the demand for healthy, natural, and customized foods without sacrificing health goals or ingredients is increasing. Working professionals are ready to spend money on convenience food without compromising their health. This trend is creating a market and client base for the high-end convenience and ready-to-eat food market.

With the increasing demand for RTE foods, a wide range of RTE products are available in the market, including instant breakfast & cereals, bakery & confectionery products, and meat products. Further, ready-to-eat vegetables and salads are becoming highly popular in emerging countries due to the convenience of consumption, good taste, and growing awareness of the health benefits of vegetables.

Ready-to-eat Food Market Trends

  • Vegetarian and vegan ready-to-eat (RTE) foods are in high demand, catering to ethical dietary preferences and being plant-based.
  • Consumers are exploring different ready-to-eat (RTE) brands to find products that align with their dietary needs and taste preferences.
  • The growing number of working women is urging households to switch to ready-to-eat food to replace normal lunch and dinner.
  • The surging practice of high-pressure processing (HPP) technology in the food industry is set to boost market growth.
  • There is a rising demand for high-protein, ready-to-eat food products among fitness enthusiasts looking to increase their protein intake.
Nandini Roy Choudhury

Principal Consultant

Talk to Analyst

Find your sweet spots for generating winning opportunities in this market.

Ready-to-eat Food Market Opportunities

  • Food supply chain companies' sales of ready-to-eat frozen convenience foods continue to be a key source of income. Convenience stores are anticipated to add more revenue share soon as they broaden their selection of frozen-ready meals and take advantage of unexplored online sales potential.
  • In industrialized nations, where consumption is higher than in developing countries, ready-to-eat food is growing in terms of popularity. The old paradigm of daily cooking has gradually been abandoned due to the rising number of workers in emerging economies and the trend toward longer and more flexible working hours.
  • Two of the most recent industry developments are the advent of new apps that make it simpler for customers to choose their products and do grocery shopping online. Due to its convenience and variety, online shopping is preferred by consumers.

Restraining Factors in the Ready-to-eat Food Market

  • The belief that ready-to-eat or processed meals are less healthful than their fresh counterparts is set to impede the expansion of the industry.
  • Some RTE foods employ preservatives and additives to prolong shelf life and preserve flavor, which is expected to put off consumers concerned about their health. Demand for products with clear labels and no artificial additives is rising.

Get the data you need at a Fraction of the cost

Personalize your report by choosing insights you need
and save 40%!

Comparative View of Adjacent Ready-to-eat Food Markets

The peer or tangential markets in the food and beverages division are expected to impact the ready-to-eat food market. These include other types of markets, such as the ready-to-eat cup and customized premix industries.

Demand for ready-to-eat cups is projected to expand at a 4.0% CAGR during the forecast period. Manufacturers are using recyclable and biodegradable materials to expand their client base with rising environmentally friendly packaging trend among consumers.

On the contrary, the customized premix industry is poised to thrive at a CAGR of 6.1% through 2034. Demand for personalized premixes with functional ingredients and apparent health benefits is rising.

Ready-to-eat Food Industry:

Attributes Ready-to-eat Food Market
CAGR (2024 to 2034) 9.2%
Growth Factor The RTE food market is influenced by the popularity of plant-based diets and growing public awareness of environmental sustainability. Demand for animal substitutes as well as plant-based, vegetarian, and vegan products is increasing.
Trend in the Ready-to-eat Food Market As customers look for variety and distinctive culinary sensations, ready-to-eat food with flavors from around the world and ethnic backgrounds is gaining momentum.

Ready-to-eat Cup Market:

Attributes Ready-to-eat Cup Market
CAGR (2024 to 2034) 4.0%
Growth Factor Customization is a popular trend in several industries, and packaging is no exception. Products that let customers personalize their experience are gaining attention.
Key Trends Convenience-focused products are in high demand, particularly those that can be consumed while traveling. Ready-to-eat cups that are portable and need little preparation are a great fit for people with hectic schedules.

Customized Premix Market:

Attributes Customized Premix Market
CAGR (2024 to 2034) 6.1%
Growth Factor In response to consumer demands for products that are environmentally conscious, brands are embracing eco-friendly packaging materials and placing a strong emphasis on sustainable operations.
Key Trends Online platforms are being used by brands to facilitate direct-to-consumer sales, giving customers simple access to a vast array of customizable choices.

Country-wise Insights

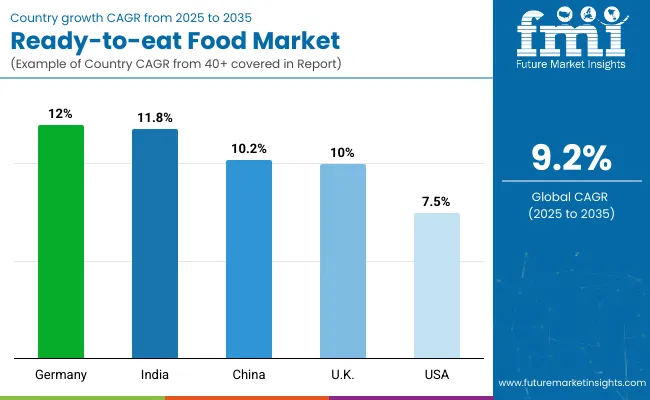
The below table shows the estimated growth rates of the top four countries. The United States, India, and China are set to record high CAGRs of 6.5%, 6.9%, and 7.3%, respectively, through 2034.

Countries CAGR
United States 6.5%
Germany 5.3%
India 6.9%
China 7.3%

Increasing Reliance on Ready-to-eat Meals to Surge Demand in the United States

The United States is expected to surge at a CAGR of 6.5% by 2034. Emerging patterns in the United States market are as follows:

  • The United States’ market growth is attributed to the country's increasing consumption of ready-to-eat foods, including frozen products such as frozen pizza.
  • The affordability of ready-to-eat foods, combined with their quality and freshness, drives the growth of the market in the United States.
  • Increasing reliance on ready-to-eat meals among the working population is expected to promote regional market growth.
  • The trend toward health-conscious lives is increasing the demand for healthy, fast food alternatives, thereby driving market growth.

Rising Disposable Income of Consumers in India to Uplift Market

India’s ready-to-eat food market is anticipated to expand at an impressive 6.9% CAGR, demonstrating the nation's robust demand for quick & easy food options and its promising future. The factors driving the market are as follows:

  • With leading working populations in the world and rising disposable income, the ready-to-eat food market in India is gaining traction.
  • Less time for cooking and food preparation due to the rising urban working cultures and fast-paced lifestyles is fueling market expansion.
  • Several food items, such as world cuisines, snacks, and traditional Chinese foods, make up India’s ready-to-eat food market. This diversity caters to the population's varying interests and preferences.

Rise of E-commerce Sector in China to Gain Traction by 2034

Through 2034, China is projected to expand at a CAGR of 7.3%, driven by the following factors:

  • In China, e-commerce is a key factor in distributing ready-to-eat (RTE) food items. Customers can easily buy a range of ready-to-eat meals, snacks, and convenience goods online in China.
  • Customers in China increasingly seek ready-to-eat options made with natural and healthier ingredients in line with worldwide trends. Products that fit into a healthy and nutritious lifestyle are becoming immensely popular.
  • Different culinary traditions and preferences are found throughout China's large and diverse areas. RTE food producers are set to modify their offerings to accommodate local preferences and cultural subtleties.

Category-wise Insights

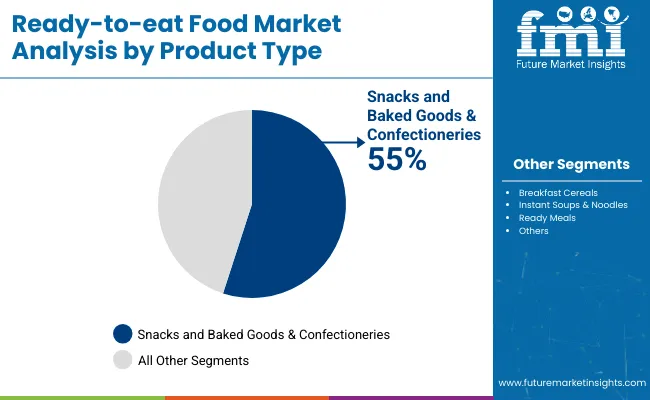
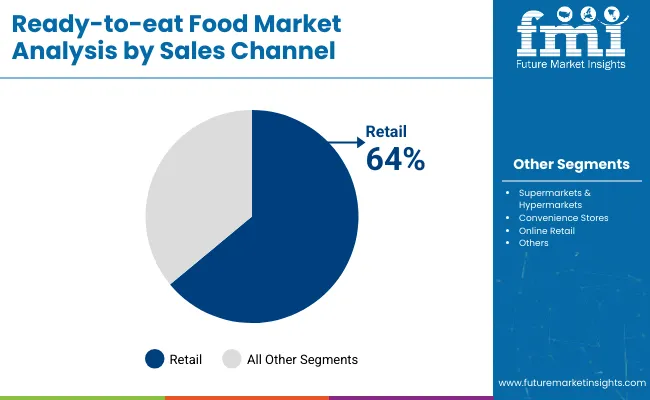
The below section shows the dairy products segment dominating by product type. It is predicted to hold a market share of 15.7% in 2024. Based on sales channel, the food service segment is anticipated to generate a dominant share through 2024. It is set to hold a share of 35% in 2024.

Segment Market Share (2024)
Dairy Products (Product Type) 15.7%
Food Service (Sales Channel) 35%

Demand for Dairy Products to Remain High in the Market

The dairy products segment is projected to hold a market share of 15.7% in 2024. Ready-to-eat milk-based options such as cheese, yogurt, paneer, and milk-based desserts offer convenience, nutritional value, and appeal to a wide range of consumer base.

Innovations in preservation and packaging technologies are extending the shelf life of dairy products, increasing their appeal to end-users seeking portable meal solutions. Ready-to-eat dairy-based meals for children are specially formulated to meet the nutritional needs of growing kids.

Innovative meals are designed to be easily consumed without additional preparation, making them a time-saving option for busy parents. The demand for dairy products in the ready-to-eat food market is expected to remain high, driven by consumer preferences for convenient and nutritious options.

Food Service Segment Takes a Lead Meeting the On-the-go Demand

The food service sector is the core of the ready-to-eat food market, and is expected to hold a significant share of 35% in 2024. The food service industry caters to diverse consumer needs, including restaurants, hotels, cafes, bakeries & patisseries, and quick service restaurants. The efficiency and convenience of pre-made meals fit the fast-paced food service industry perfectly, contributing to its dominance.

The food service industry is also offering ready-to-eat options on its menus as the trend of ordering in or dining out continues to gain traction. Ready-to-eat products' flexibility to fit different dietary needs and cuisines further solidifies their dominance in the market and positions them as a key factor in the sector's expansion.

Competitive Landscape

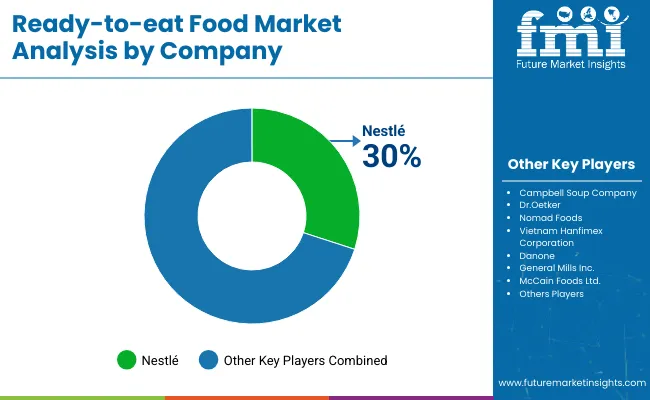
The ready-to-eat food market is fragmented due to several international and domestic companies. Leading manufacturers are focusing on product innovation to meet the emerging health choices of consumers around the world. Key companies are directing toward strategies such as partnerships, innovation, online advertising campaigns, and new product developments to expand their product portfolios and customer bases.

Recent Developments

  • In 2022, VegaBytz Company introduced plant-based, 100% vegan meat products in India, offering ready-to-eat meat, chicken, tuna meals, and curry products made from plants.
  • In 2021, Nomad acquired Fortenova's Frozen Food Business Group (FFBG) to expand its product portfolio.
  • In 2022, McCain Foods acquired Scelta Products. Through this acquisition, the company's position in the prepared frozen appetizer market will be strengthened, and frozen prepared meals are set to gain more creativity and capacity.

Key Companies Profiled

  • Nestlé
  • Dr. Oetker
  • Campbell Soup Company
  • Nomad Foods
  • Danone
  • Vietnam Hanfimex Corporation
  • General Mills Inc.
  • California Pizza Kitchen
  • McCain Foods Ltd.
  • MTR Foods Private Limited
  • Conagra Brands, Inc.
  • Atkins Nutritionals, Inc.

Ready-to-eat Food Market Segmentation by Category

By Product Type:

  • Dairy Products
  • Instant Breakfast/Cereals
  • Bakery and Confectionary
  • Meat and Poultry
  • Frozen Pizza
  • Pasta and Noodles
  • Savory Snacks
  • Prepared Salads

By Sales Channel:

  • Food Service
    • Hotel, Restaurant, Cafes
    • Bakeries and Patisseries
    • Quick Service Restaurants (Sandwicheries, Fast Casual, Coffee Shops)
  • Airport Retail
  • Travel Retail
  • Retail
    • Hypermarket/Supermarket
    • Convenience Stores
    • Departmental Stores
    • Wholesale Stores
    • Mass Grocery Retailers
    • Specialty Stores
  • Online

By Region:

  • North America
  • Latin America
  • Europe
  • East Asia
  • South Asia
  • Oceania
  • Middle East and Africa

Frequently Asked Questions

How big is the ready-to-eat food market?

The market is set to reach US$ 195.9 billion in 2024.

What is the ready-to-eat food market forecast?

Demand for ready-to-eat food is slated to expand at a 9.2% CAGR by 2034.

What is the outlook for the ready-to-eat food market?

The market is expected to reach US$ 391.1 billion in 2034.

Who are the key players in the ready-to-eat food market sphere?

Nestlé, Dr. Oetker, and Campbell Soup Company are the key players.

Which product type would lead the ready-to-eat food market?

Dairy product segment is estimated to hold a market share of 15.7% in 2024.

Table of Content

1. Executive Summary

    1.1. Global Market Outlook

    1.2. Demand Side Trends

    1.3. Supply Side Trends

    1.4. Technology Roadmap

    1.5. Analysis and Recommendations

2. Market Overview

    2.1. Market Coverage / Taxonomy

    2.2. Market Definition

3. Market Background

    3.1. Drivers

        3.1.1. Supply Side Drivers

        3.1.2. Demand Side Drivers

        3.1.3. Economic Side Drivers

    3.2. Restraints

    3.3. Opportunity

    3.4. Market trends By Region

    3.5. Forecast Factors - Relevance and Impact

    3.6. Regulations and Policies

4. Global Market- Pricing Analysis

    4.1. Price Point Assessment by Region

        4.1.1. Manufacturer Level Pricing

        4.1.2. Distributor Level Pricing

        4.1.3. Retail Level Pricing

    4.2. Price Point Assessment By Product Type

    4.3. Price Forecast till 2034

5. Value Chain Analysis

    5.1. Operating margins at each node of supply chain

    5.2. List of Active Market Participants

6. Global Market Size in Value (US$ billion) and Volume (Unit) Analysis 2019 to 2023 and Forecast, 2024 to 2034

    6.1. Historical Market Size in Value (US$ billion) and Volume (Unit) Analysis, 2019 to 2023

    6.2. Current and Future Market Size in Value (US$ billion) and Volume (Unit) Analysis, 2024 to 2034

        6.2.1. Y-o-Y Growth Trend Analysis

        6.2.2. Absolute $ Opportunity Analysis

7. Global Market Analysis 2019 to 2023 and Forecast 2024 to 2034, By Product Type

    7.1. Introduction / Key Findings

    7.2. Historical Market Size in Value (US$ billion) and Volume (Unit) Analysis By Product Type, 2019 to 2023

    7.3. Current and Future Market Size in Value (US$ billion) and Volume (Unit) Analysis and Forecast By Product Type, 2024 to 2034

        7.3.1. Instant Breakfast/Cereals

        7.3.2. Bakery and Confectionary

        7.3.3. Meat and Poultry

        7.3.4. Frozen Pizza

        7.3.5. Pasta and Noodles

        7.3.6. Dairy Products

        7.3.7. Savory Snacks

        7.3.8. Prepared Salads

    7.4. Market Attractiveness Analysis By Product Type

8. Global Market Analysis 2019 to 2023 and Forecast 2024 to 2034, By Sales Channel

    8.1. Introduction / Key Findings

    8.2. Historical Market Size in Value (US$ billion) and Volume (Unit) Analysis By Sales Channel, 2019 to 2023

    8.3. Current and Future Market Size in Value (US$ billion) and Volume (Unit) Analysis and Forecast By Sales Channel, 2024 to 2034

        8.3.1. Food Service

            8.3.1.1. Hotel, Restaurant, Cafes

            8.3.1.2. Bakeries and Patisseries

            8.3.1.3. Quick Service Restaurants (Sandwicheries, Fast Casual, Coffee Shops)

        8.3.2. Airport Retail

        8.3.3. Travel Retail

        8.3.4. Retail

            8.3.4.1. Hypermarket/Supermarket

            8.3.4.2. Convenience Stores

            8.3.4.3. Departmental Stores

            8.3.4.4. Wholesale Stores

            8.3.4.5. Mass Grocery Retailers

            8.3.4.6. Specialty Stores

        8.3.5. Online

    8.4. Market Attractiveness Analysis By Sales Channel

9. Global Market Analysis 2019 to 2023 and Forecast 2024 to 2034, by Region

    9.1. Introduction

    9.2. Historical Market Size in Value (US$ billion) and Volume (Unit) Analysis By Region, 2019 to 2023

    9.3. Current Market Size in Value (US$ billion) and Volume (Unit) Analysis and Forecast By Region, 2024 to 2034

        9.3.1. North America

        9.3.2. Latin America

        9.3.3. Europe

        9.3.4. East Asia

        9.3.5. South Asia

        9.3.6. Oceania

        9.3.7. Middle East and Africa

    9.4. Market Attractiveness Analysis By Region

10. North America Market Analysis 2019 to 2023 and Forecast 2024 to 2034

    10.1. Introduction

    10.2. Historical Market Size (US$ billion) and Volume(Unit) Trend Analysis By Market Taxonomy, 2019 to 2023

    10.3. Market Size (US$ billion) and Volume(Unit) Forecast By Market Taxonomy, 2024 to 2034

        10.3.1. By Country

            10.3.1.1. United States

            10.3.1.2. Canada

        10.3.2. By Product Type

        10.3.3. By Sales Channel

    10.4. Market Attractiveness Analysis

        10.4.1. By Country

        10.4.2. By Product Type

        10.4.3. By Sales Channel

    10.5. Key takeaways

11. Latin America Market Analysis 2019 to 2023 and Forecast 2024 to 2034

    11.1. Introduction

    11.2. Historical Market Size (US$ billion) and Volume(Unit) Trend Analysis By Market Taxonomy, 2019 to 2023

    11.3. Market Size (US$ billion) and Volume (Unit) Forecast By Market Taxonomy, 2024 to 2034

        11.3.1. By Country

            11.3.1.1. Brazil

            11.3.1.2. Mexico

            11.3.1.3. Argentina

            11.3.1.4. Rest of Latin America

        11.3.2. By Product Type

        11.3.3. By Sales Channel

    11.4. Market Attractiveness Analysis

        11.4.1. By Country

        11.4.2. By Product Type

        11.4.3. By Sales Channel

    11.5. Key takeaways

12. Europe Market Analysis 2019 to 2023 and Forecast 2024 to 2034

    12.1. Introduction

    12.2. Historical Market Size (US$ billion) and Volume(Unit) Trend Analysis By Market Taxonomy, 2019 to 2023

    12.3. Market Size (US$ billion) and Volume(Unit) Forecast By Market Taxonomy, 2024 to 2034

        12.3.1. By Country

            12.3.1.1. Germany

            12.3.1.2. United Kingdom

            12.3.1.3. France

            12.3.1.4. Italy

            12.3.1.5. Spain

            12.3.1.6. BENELUX

            12.3.1.7. Nordic

            12.3.1.8. Russia

            12.3.1.9. Poland

            12.3.1.10. Rest of Europe

        12.3.2. By Product Type

        12.3.3. By Sales Channel

    12.4. Market Attractiveness Analysis

        12.4.1. By Country

        12.4.2. By Product Type

        12.4.3. By Sales Channel

    12.5. Key takeaways

13. East Asia Market Analysis 2019 to 2023 and Forecast 2024 to 2034

    13.1. Introduction

    13.2. Historical Market Size (US$ billion) and Volume(Unit) Trend Analysis By Market Taxonomy, 2019 to 2023

    13.3. Market Size (US$ billion) and Volume(Unit) Forecast By Market Taxonomy, 2024 to 2034

        13.3.1. By Country

            13.3.1.1. China

            13.3.1.2. Japan

            13.3.1.3. South Korea

        13.3.2. By Product Type

        13.3.3. By Sales Channel

    13.4. Market Attractiveness Analysis

        13.4.1. By Country

        13.4.2. By Product Type

        13.4.3. By Sales Channel

    13.5. Key takeaways

14. South Asia Market Analysis 2019 to 2023 and Forecast 2024 to 2034

    14.1. Introduction

    14.2. Historical Market Size (US$ billion) and Volume(Unit) Trend Analysis By Market Taxonomy, 2019 to 2023

    14.3. Market Size (US$ billion) and Volume(Unit) Forecast By Market Taxonomy, 2024 to 2034

        14.3.1. By Country

            14.3.1.1. India

            14.3.1.2. Thailand

            14.3.1.3. Malaysia

            14.3.1.4. Indonesia

            14.3.1.5. Vietnam

            14.3.1.6. Philippines

            14.3.1.7. Singapore

            14.3.1.8. Rest of South Asia

        14.3.2. By Product Type

        14.3.3. By Sales Channel

    14.4. Market Attractiveness Analysis

        14.4.1. By Country

        14.4.2. By Product Type

        14.4.3. By Sales Channel

    14.5. Key takeaways

15. Oceania Market Analysis 2019 to 2023 and Forecast 2024 to 2034

    15.1. Introduction

    15.2. Historical Market Size (US$ billion) and Volume(Unit) Trend Analysis By Market Taxonomy, 2019 to 2023

    15.3. Market Size (US$ billion) and Volume(Unit) Forecast By Market Taxonomy, 2024 to 2034

        15.3.1. By Country

            15.3.1.1. Australia

            15.3.1.2. New Zealand

        15.3.2. By Product Type

        15.3.3. By Sales Channel

    15.4. Market Attractiveness Analysis

        15.4.1. By Country

        15.4.2. By Product Type

        15.4.3. By Sales Channel

    15.5. Key takeaways

16. Middle East and Africa Market Analysis 2019 to 2023 and Forecast 2024 to 2034

    16.1. Introduction

    16.2. Historical Market Size (US$ billion) and Volume(Unit) Trend Analysis By Market Taxonomy, 2019 to 2023

    16.3. Market Size (US$ billion) and Volume(Unit) Forecast By Market Taxonomy, 2024 to 2034

        16.3.1. By Country

            16.3.1.1. GCC Countries

            16.3.1.2. Turkiye

            16.3.1.3. Egypt

            16.3.1.4. South Africa

            16.3.1.5. Rest of Middle East and Africa

        16.3.2. By Product Type

        16.3.3. By Sales Channel

    16.4. Market Attractiveness Analysis

        16.4.1. By Country

        16.4.2. By Product Type

        16.4.3. By Sales Channel

    16.5. Key takeaways

17. Country-level Market Analysis, 2022

    17.1. United States Market Analysis

        17.1.1. By Product Type

        17.1.2. By Sales Channel

    17.2. Canada Market Analysis

        17.2.1. By Product Type

        17.2.2. By Sales Channel

    17.3. Brazil Market Analysis

        17.3.1. By Product Type

        17.3.2. By Sales Channel

    17.4. Mexico Market Analysis

        17.4.1. By Product Type

        17.4.2. By Sales Channel

    17.5. Argentina Market Analysis

        17.5.1. By Product Type

        17.5.2. By Sales Channel

    17.6. Germany Market Analysis

        17.6.1. By Product Type

        17.6.2. By Sales Channel

    17.7. United Kingdom Market Analysis

        17.7.1. By Product Type

        17.7.2. By Sales Channel

    17.8. France Market Analysis

        17.8.1. By Product Type

        17.8.2. By Sales Channel

    17.9. Italy Market Analysis

        17.9.1. By Product Type

        17.9.2. By Sales Channel

    17.10. Spain Market Analysis

        17.10.1. By Product Type

        17.10.2. By Sales Channel

    17.11. BENELUX Market Analysis

        17.11.1. By Product Type

        17.11.2. By Sales Channel

    17.12. Nordic Market Analysis

        17.12.1. By Product Type

        17.12.2. By Sales Channel

    17.13. Russia Region Market Analysis

        17.13.1. By Product Type

        17.13.2. By Sales Channel

    17.14. Poland Market Analysis

        17.14.1. By Product Type

        17.14.2. By Sales Channel

    17.15. China Market Analysis

        17.15.1. By Product Type

        17.15.2. By Sales Channel

    17.16. Japan Market Analysis

        17.16.1. By Product Type

        17.16.2. By Sales Channel

    17.17. South Korea Market Analysis

        17.17.1. By Product Type

        17.17.2. By Sales Channel

    17.18. India Market Analysis

        17.18.1. By Product Type

        17.18.2. By Sales Channel

    17.19. Thailand Market Analysis

        17.19.1. By Product Type

        17.19.2. By Sales Channel

    17.20. Malaysia Market Analysis

        17.20.1. By Product Type

        17.20.2. By Sales Channel

    17.21. Indonesia Market Analysis

        17.21.1. By Product Type

        17.21.2. By Sales Channel

    17.22. Vietnam Market Analysis

        17.22.1. By Product Type

        17.22.2. By Sales Channel

    17.23. Philippines Market Analysis

        17.23.1. By Product Type

        17.23.2. By Sales Channel

    17.24. Singapore Market Analysis

        17.24.1. By Product Type

        17.24.2. By Sales Channel

    17.25. Australia Market Analysis

        17.25.1. By Product Type

        17.25.2. By Sales Channel

    17.26. New Zealand Market Analysis

        17.26.1. By Product Type

        17.26.2. By Sales Channel

    17.27. GCC Countries Market Analysis

        17.27.1. By Product Type

        17.27.2. By Sales Channel

    17.28. Turkiye Market Analysis

        17.28.1. By Product Type

        17.28.2. By Sales Channel

    17.29. Egypt Market Analysis

        17.29.1. By Product Type

        17.29.2. By Sales Channel

    17.30. South Africa Market Analysis

        17.30.1. By Product Type

        17.30.2. By Sales Channel

18. Market Structure Analysis

    18.1. Global Market Competition - a Dashboard View

    18.2. Industry Structure Analysis

    18.3. Global Market Company Share Analysis

        18.3.1. For Tier 1 Market Players, 2024

        18.3.2. Company Market Share Analysis of Top Players, By Region

    18.4. Key Participants Market Presence (Intensity Mapping) by Region

19. Competition Analysis

    19.1. Competition Dashboard

    19.2. Competition Benchmarking

    19.3. Competition Deep Dive

        19.3.1. DIC Corporation

            19.3.1.1. Product Portfolio

            19.3.1.2. Product Claim

            19.3.1.3. Revenue by Market Segments

            19.3.1.4. Sales Footprint

            19.3.1.5. Strategy Overview

            19.3.1.6. SWOT Analysis

        19.3.2. Nestlé

        19.3.3. Dr. Oetker

        19.3.4. Campbell Soup Company

        19.3.5. Nomad Foods

        19.3.6. Danone

        19.3.7. Vietnam Hanfimex Corporation

        19.3.8. General Mills Inc.

        19.3.9. California Pizza Kitchen

        19.3.10. McCain Foods Ltd.

        19.3.11. MTR Foods Private Limited

        19.3.12. Conagra Brands, Inc.

        19.3.13. Atkins Nutritionals, Inc.

        19.3.14. Other Players

20. Research Methodology

Don't pay for what you don't need

Customize your report by selecting specific countries or regions and save 30%!

List of Tables

Table 1: Global Market Value (US$ billion) Forecast by Region, 2019 to 2034

Table 2: Global Market Volume (MT) Forecast by Region, 2019 to 2034

Table 3: Global Market Value (US$ billion) Forecast by Product Type, 2019 to 2034

Table 4: Global Market Volume (MT) Forecast by Product Type, 2019 to 2034

Table 5: Global Market Value (US$ billion) Forecast by Sales Channel, 2019 to 2034

Table 6: Global Market Volume (MT) Forecast by Sales Channel, 2019 to 2034

Table 7: North America Market Value (US$ billion) Forecast by Country, 2019 to 2034

Table 8: North America Market Volume (MT) Forecast by Country, 2019 to 2034

Table 9: North America Market Value (US$ billion) Forecast by Product Type, 2019 to 2034

Table 10: North America Market Volume (MT) Forecast by Product Type, 2019 to 2034

Table 11: North America Market Value (US$ billion) Forecast by Sales Channel, 2019 to 2034

Table 12: North America Market Volume (MT) Forecast by Sales Channel, 2019 to 2034

Table 13: Latin America Market Value (US$ billion) Forecast by Country, 2019 to 2034

Table 14: Latin America Market Volume (MT) Forecast by Country, 2019 to 2034

Table 15: Latin America Market Value (US$ billion) Forecast by Product Type, 2019 to 2034

Table 16: Latin America Market Volume (MT) Forecast by Product Type, 2019 to 2034

Table 17: Latin America Market Value (US$ billion) Forecast by Sales Channel, 2019 to 2034

Table 18: Latin America Market Volume (MT) Forecast by Sales Channel, 2019 to 2034

Table 19: Europe Market Value (US$ billion) Forecast by Country, 2019 to 2034

Table 20: Europe Market Volume (MT) Forecast by Country, 2019 to 2034

Table 21: Europe Market Value (US$ billion) Forecast by Product Type, 2019 to 2034

Table 22: Europe Market Volume (MT) Forecast by Product Type, 2019 to 2034

Table 23: Europe Market Value (US$ billion) Forecast by Sales Channel, 2019 to 2034

Table 24: Europe Market Volume (MT) Forecast by Sales Channel, 2019 to 2034

Table 25: East Asia Market Value (US$ billion) Forecast by Country, 2019 to 2034

Table 26: East Asia Market Volume (MT) Forecast by Country, 2019 to 2034

Table 27: East Asia Market Value (US$ billion) Forecast by Product Type, 2019 to 2034

Table 28: East Asia Market Volume (MT) Forecast by Product Type, 2019 to 2034

Table 29: East Asia Market Value (US$ billion) Forecast by Sales Channel, 2019 to 2034

Table 30: East Asia Market Volume (MT) Forecast by Sales Channel, 2019 to 2034

Table 31: South Asia Market Value (US$ billion) Forecast by Country, 2019 to 2034

Table 32: South Asia Market Volume (MT) Forecast by Country, 2019 to 2034

Table 33: South Asia Market Value (US$ billion) Forecast by Product Type, 2019 to 2034

Table 34: South Asia Market Volume (MT) Forecast by Product Type, 2019 to 2034

Table 35: South Asia Market Value (US$ billion) Forecast by Sales Channel, 2019 to 2034

Table 36: South Asia Market Volume (MT) Forecast by Sales Channel, 2019 to 2034

Table 37: Oceania Market Value (US$ billion) Forecast by Country, 2019 to 2034

Table 38: Oceania Market Volume (MT) Forecast by Country, 2019 to 2034

Table 39: Oceania Market Value (US$ billion) Forecast by Product Type, 2019 to 2034

Table 40: Oceania Market Volume (MT) Forecast by Product Type, 2019 to 2034

Table 41: Oceania Market Value (US$ billion) Forecast by Sales Channel, 2019 to 2034

Table 42: Oceania Market Volume (MT) Forecast by Sales Channel, 2019 to 2034

Table 43: Middle East and Africa Market Value (US$ billion) Forecast by Country, 2019 to 2034

Table 44: Middle East and Africa Market Volume (MT) Forecast by Country, 2019 to 2034

Table 45: Middle East and Africa Market Value (US$ billion) Forecast by Product Type, 2019 to 2034

Table 46: Middle East and Africa Market Volume (MT) Forecast by Product Type, 2019 to 2034

Table 47: Middle East and Africa Market Value (US$ billion) Forecast by Sales Channel, 2019 to 2034

Table 48: Middle East and Africa Market Volume (MT) Forecast by Sales Channel, 2019 to 2034
Nandini Roy Choudhury

Principal Consultant

Talk to Analyst

Find your sweet spots for generating winning opportunities in this market.

List of Charts

Figure 1: Global Market Value (US$ billion) by Product Type, 2024 to 2034

Figure 2: Global Market Value (US$ billion) by Sales Channel, 2024 to 2034

Figure 3: Global Market Value (US$ billion) by Region, 2024 to 2034

Figure 4: Global Market Value (US$ billion) Analysis by Region, 2019 to 2034

Figure 5: Global Market Volume (MT) Analysis by Region, 2019 to 2034

Figure 6: Global Market Value Share (%) and BPS Analysis by Region, 2024 to 2034

Figure 7: Global Market Y-o-Y Growth (%) Projections by Region, 2024 to 2034

Figure 8: Global Market Value (US$ billion) Analysis by Product Type, 2019 to 2034

Figure 9: Global Market Volume (MT) Analysis by Product Type, 2019 to 2034

Figure 10: Global Market Value Share (%) and BPS Analysis by Product Type, 2024 to 2034

Figure 11: Global Market Y-o-Y Growth (%) Projections by Product Type, 2024 to 2034

Figure 12: Global Market Value (US$ billion) Analysis by Sales Channel, 2019 to 2034

Figure 13: Global Market Volume (MT) Analysis by Sales Channel, 2019 to 2034

Figure 14: Global Market Value Share (%) and BPS Analysis by Sales Channel, 2024 to 2034

Figure 15: Global Market Y-o-Y Growth (%) Projections by Sales Channel, 2024 to 2034

Figure 16: Global Market Attractiveness by Product Type, 2024 to 2034

Figure 17: Global Market Attractiveness by Sales Channel, 2024 to 2034

Figure 18: Global Market Attractiveness by Region, 2024 to 2034

Figure 19: North America Market Value (US$ billion) by Product Type, 2024 to 2034

Figure 20: North America Market Value (US$ billion) by Sales Channel, 2024 to 2034

Figure 21: North America Market Value (US$ billion) by Country, 2024 to 2034

Figure 22: North America Market Value (US$ billion) Analysis by Country, 2019 to 2034

Figure 23: North America Market Volume (MT) Analysis by Country, 2019 to 2034

Figure 24: North America Market Value Share (%) and BPS Analysis by Country, 2024 to 2034

Figure 25: North America Market Y-o-Y Growth (%) Projections by Country, 2024 to 2034

Figure 26: North America Market Value (US$ billion) Analysis by Product Type, 2019 to 2034

Figure 27: North America Market Volume (MT) Analysis by Product Type, 2019 to 2034

Figure 28: North America Market Value Share (%) and BPS Analysis by Product Type, 2024 to 2034

Figure 29: North America Market Y-o-Y Growth (%) Projections by Product Type, 2024 to 2034

Figure 30: North America Market Value (US$ billion) Analysis by Sales Channel, 2019 to 2034

Figure 31: North America Market Volume (MT) Analysis by Sales Channel, 2019 to 2034

Figure 32: North America Market Value Share (%) and BPS Analysis by Sales Channel, 2024 to 2034

Figure 33: North America Market Y-o-Y Growth (%) Projections by Sales Channel, 2024 to 2034

Figure 34: North America Market Attractiveness by Product Type, 2024 to 2034

Figure 35: North America Market Attractiveness by Sales Channel, 2024 to 2034

Figure 36: North America Market Attractiveness by Country, 2024 to 2034

Figure 37: Latin America Market Value (US$ billion) by Product Type, 2024 to 2034

Figure 38: Latin America Market Value (US$ billion) by Sales Channel, 2024 to 2034

Figure 39: Latin America Market Value (US$ billion) by Country, 2024 to 2034

Figure 40: Latin America Market Value (US$ billion) Analysis by Country, 2019 to 2034

Figure 41: Latin America Market Volume (MT) Analysis by Country, 2019 to 2034

Figure 42: Latin America Market Value Share (%) and BPS Analysis by Country, 2024 to 2034

Figure 43: Latin America Market Y-o-Y Growth (%) Projections by Country, 2024 to 2034

Figure 44: Latin America Market Value (US$ billion) Analysis by Product Type, 2019 to 2034

Figure 45: Latin America Market Volume (MT) Analysis by Product Type, 2019 to 2034

Figure 46: Latin America Market Value Share (%) and BPS Analysis by Product Type, 2024 to 2034

Figure 47: Latin America Market Y-o-Y Growth (%) Projections by Product Type, 2024 to 2034

Figure 48: Latin America Market Value (US$ billion) Analysis by Sales Channel, 2019 to 2034

Figure 49: Latin America Market Volume (MT) Analysis by Sales Channel, 2019 to 2034

Figure 50: Latin America Market Value Share (%) and BPS Analysis by Sales Channel, 2024 to 2034

Figure 51: Latin America Market Y-o-Y Growth (%) Projections by Sales Channel, 2024 to 2034

Figure 52: Latin America Market Attractiveness by Product Type, 2024 to 2034

Figure 53: Latin America Market Attractiveness by Sales Channel, 2024 to 2034

Figure 54: Latin America Market Attractiveness by Country, 2024 to 2034

Figure 55: Europe Market Value (US$ billion) by Product Type, 2024 to 2034

Figure 56: Europe Market Value (US$ billion) by Sales Channel, 2024 to 2034

Figure 57: Europe Market Value (US$ billion) by Country, 2024 to 2034

Figure 58: Europe Market Value (US$ billion) Analysis by Country, 2019 to 2034

Figure 59: Europe Market Volume (MT) Analysis by Country, 2019 to 2034

Figure 60: Europe Market Value Share (%) and BPS Analysis by Country, 2024 to 2034

Figure 61: Europe Market Y-o-Y Growth (%) Projections by Country, 2024 to 2034

Figure 62: Europe Market Value (US$ billion) Analysis by Product Type, 2019 to 2034

Figure 63: Europe Market Volume (MT) Analysis by Product Type, 2019 to 2034

Figure 64: Europe Market Value Share (%) and BPS Analysis by Product Type, 2024 to 2034

Figure 65: Europe Market Y-o-Y Growth (%) Projections by Product Type, 2024 to 2034

Figure 66: Europe Market Value (US$ billion) Analysis by Sales Channel, 2019 to 2034

Figure 67: Europe Market Volume (MT) Analysis by Sales Channel, 2019 to 2034

Figure 68: Europe Market Value Share (%) and BPS Analysis by Sales Channel, 2024 to 2034

Figure 69: Europe Market Y-o-Y Growth (%) Projections by Sales Channel, 2024 to 2034

Figure 70: Europe Market Attractiveness by Product Type, 2024 to 2034

Figure 71: Europe Market Attractiveness by Sales Channel, 2024 to 2034

Figure 72: Europe Market Attractiveness by Country, 2024 to 2034

Figure 73: East Asia Market Value (US$ billion) by Product Type, 2024 to 2034

Figure 74: East Asia Market Value (US$ billion) by Sales Channel, 2024 to 2034

Figure 75: East Asia Market Value (US$ billion) by Country, 2024 to 2034

Figure 76: East Asia Market Value (US$ billion) Analysis by Country, 2019 to 2034

Figure 77: East Asia Market Volume (MT) Analysis by Country, 2019 to 2034

Figure 78: East Asia Market Value Share (%) and BPS Analysis by Country, 2024 to 2034

Figure 79: East Asia Market Y-o-Y Growth (%) Projections by Country, 2024 to 2034

Figure 80: East Asia Market Value (US$ billion) Analysis by Product Type, 2019 to 2034

Figure 81: East Asia Market Volume (MT) Analysis by Product Type, 2019 to 2034

Figure 82: East Asia Market Value Share (%) and BPS Analysis by Product Type, 2024 to 2034

Figure 83: East Asia Market Y-o-Y Growth (%) Projections by Product Type, 2024 to 2034

Figure 84: East Asia Market Value (US$ billion) Analysis by Sales Channel, 2019 to 2034

Figure 85: East Asia Market Volume (MT) Analysis by Sales Channel, 2019 to 2034

Figure 86: East Asia Market Value Share (%) and BPS Analysis by Sales Channel, 2024 to 2034

Figure 87: East Asia Market Y-o-Y Growth (%) Projections by Sales Channel, 2024 to 2034

Figure 88: East Asia Market Attractiveness by Product Type, 2024 to 2034

Figure 89: East Asia Market Attractiveness by Sales Channel, 2024 to 2034

Figure 90: East Asia Market Attractiveness by Country, 2024 to 2034

Figure 91: South Asia Market Value (US$ billion) by Product Type, 2024 to 2034

Figure 92: South Asia Market Value (US$ billion) by Sales Channel, 2024 to 2034

Figure 93: South Asia Market Value (US$ billion) by Country, 2024 to 2034

Figure 94: South Asia Market Value (US$ billion) Analysis by Country, 2019 to 2034

Figure 95: South Asia Market Volume (MT) Analysis by Country, 2019 to 2034

Figure 96: South Asia Market Value Share (%) and BPS Analysis by Country, 2024 to 2034

Figure 97: South Asia Market Y-o-Y Growth (%) Projections by Country, 2024 to 2034

Figure 98: South Asia Market Value (US$ billion) Analysis by Product Type, 2019 to 2034

Figure 99: South Asia Market Volume (MT) Analysis by Product Type, 2019 to 2034

Figure 100: South Asia Market Value Share (%) and BPS Analysis by Product Type, 2024 to 2034

Figure 101: South Asia Market Y-o-Y Growth (%) Projections by Product Type, 2024 to 2034

Figure 102: South Asia Market Value (US$ billion) Analysis by Sales Channel, 2019 to 2034

Figure 103: South Asia Market Volume (MT) Analysis by Sales Channel, 2019 to 2034

Figure 104: South Asia Market Value Share (%) and BPS Analysis by Sales Channel, 2024 to 2034

Figure 105: South Asia Market Y-o-Y Growth (%) Projections by Sales Channel, 2024 to 2034

Figure 106: South Asia Market Attractiveness by Product Type, 2024 to 2034

Figure 107: South Asia Market Attractiveness by Sales Channel, 2024 to 2034

Figure 108: South Asia Market Attractiveness by Country, 2024 to 2034

Figure 109: Oceania Market Value (US$ billion) by Product Type, 2024 to 2034

Figure 110: Oceania Market Value (US$ billion) by Sales Channel, 2024 to 2034

Figure 111: Oceania Market Value (US$ billion) by Country, 2024 to 2034

Figure 112: Oceania Market Value (US$ billion) Analysis by Country, 2019 to 2034

Figure 113: Oceania Market Volume (MT) Analysis by Country, 2019 to 2034

Figure 114: Oceania Market Value Share (%) and BPS Analysis by Country, 2024 to 2034

Figure 115: Oceania Market Y-o-Y Growth (%) Projections by Country, 2024 to 2034

Figure 116: Oceania Market Value (US$ billion) Analysis by Product Type, 2019 to 2034

Figure 117: Oceania Market Volume (MT) Analysis by Product Type, 2019 to 2034

Figure 118: Oceania Market Value Share (%) and BPS Analysis by Product Type, 2024 to 2034

Figure 119: Oceania Market Y-o-Y Growth (%) Projections by Product Type, 2024 to 2034

Figure 120: Oceania Market Value (US$ billion) Analysis by Sales Channel, 2019 to 2034

Figure 121: Oceania Market Volume (MT) Analysis by Sales Channel, 2019 to 2034

Figure 122: Oceania Market Value Share (%) and BPS Analysis by Sales Channel, 2024 to 2034

Figure 123: Oceania Market Y-o-Y Growth (%) Projections by Sales Channel, 2024 to 2034

Figure 124: Oceania Market Attractiveness by Product Type, 2024 to 2034

Figure 125: Oceania Market Attractiveness by Sales Channel, 2024 to 2034

Figure 126: Oceania Market Attractiveness by Country, 2024 to 2034

Figure 127: Middle East and Africa Market Value (US$ billion) by Product Type, 2024 to 2034

Figure 128: Middle East and Africa Market Value (US$ billion) by Sales Channel, 2024 to 2034

Figure 129: Middle East and Africa Market Value (US$ billion) by Country, 2024 to 2034

Figure 130: Middle East and Africa Market Value (US$ billion) Analysis by Country, 2019 to 2034

Figure 131: Middle East and Africa Market Volume (MT) Analysis by Country, 2019 to 2034

Figure 132: Middle East and Africa Market Value Share (%) and BPS Analysis by Country, 2024 to 2034

Figure 133: Middle East and Africa Market Y-o-Y Growth (%) Projections by Country, 2024 to 2034

Figure 134: Middle East and Africa Market Value (US$ billion) Analysis by Product Type, 2019 to 2034

Figure 135: Middle East and Africa Market Volume (MT) Analysis by Product Type, 2019 to 2034

Figure 136: Middle East and Africa Market Value Share (%) and BPS Analysis by Product Type, 2024 to 2034

Figure 137: Middle East and Africa Market Y-o-Y Growth (%) Projections by Product Type, 2024 to 2034

Figure 138: Middle East and Africa Market Value (US$ billion) Analysis by Sales Channel, 2019 to 2034

Figure 139: Middle East and Africa Market Volume (MT) Analysis by Sales Channel, 2019 to 2034

Figure 140: Middle East and Africa Market Value Share (%) and BPS Analysis by Sales Channel, 2024 to 2034

Figure 141: Middle East and Africa Market Y-o-Y Growth (%) Projections by Sales Channel, 2024 to 2034

Figure 142: Middle East and Africa Market Attractiveness by Product Type, 2024 to 2034

Figure 143: Middle East and Africa Market Attractiveness by Sales Channel, 2024 to 2034

Figure 144: Middle East and Africa Market Attractiveness by Country, 2024 to 2034

Recommendations

Food and Beverage

Customized Premix Market

Published : January 2024

Food and Beverage

Ready-to-eat Cups Market

Published : June 2023

Food and Beverage

Dinner Ready-to-Eat (RTE) Food Market

Published : March 2023

Food and Beverage

Ready-to-Use Therapeutic Food Market

Published : March 2023

Explore Food and Beverage Insights

View Reports