Food Processing Equipment Market Overview

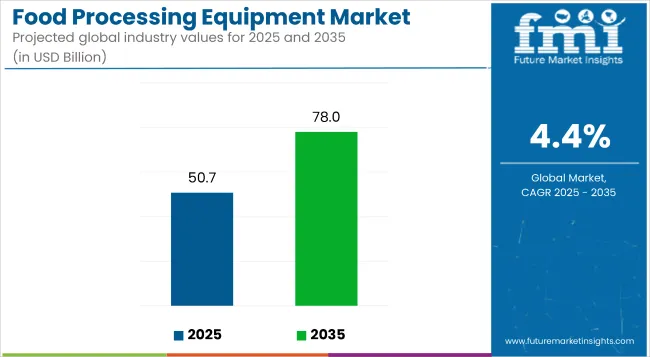
Future Market Insights’ updated report on the food processing equipment ecosystem is set to account for a current valuation of USD 48.58 billion in 2024.

Following this pattern, demand could rise and equate to a market valuation of USD 74.66 billion, with a sluggish CAGR of 4.4% by 2034.

Attributes Details
Market Value for 2024 USD 48.58 billion
Market Value for 2034 USD 74.66 billion
Market Forecast CAGR for 2024 to 2034 4.4%

Historical Performance and Future Growth of the Food Processing Equipment Market

Historical CAGR (2019 to 2023) 3.50%
Forecast CAGR (2024 to 2034) 4.40%

The food processing equipment market has grown sluggishly over the past few years, with a historical CAGR of 3.50%. Factors such as changing consumer preferences, busy lifestyles, and the need for convenience have fueled the demand for processed and packaged food, propelling the demand for food processing equipment.

The forecasted CAGR for the food processing equipment market from 2024 to 2034 stands at 4.40%, indicating a slightly accelerated growth trajectory compared to the historical trend.

The forecasted growth is expected to be compelled by further advancements in food processing technologies, increasing automation and efficiency in food production processes, and the growing focus on food safety and hygiene standards.

Expanding food and beverage industries in emerging economies and adopting novel processing techniques are anticipated to contribute to the sustained growth of the market in the coming years.

Key Factors Pushing the Food Processing Equipment Market Forward

  • Growing urbanization, busy lifestyles, and changing dietary preferences have led to a rising demand for processed and convenience food products worldwide.
  • Food processing equipment plays an important role in meeting this demand by enabling efficient processing, packaging, and preservation of food items, stimulating market growth.
  • Heightened awareness among consumers and stringent regulations regarding food safety and hygiene are compelling food manufacturers to invest in advanced processing equipment.

Key Factors Hampering the Food Processing Equipment Market

  • The significant upfront investment required for purchasing and installing food processing equipment can be a barrier for small and medium-sized enterprises (SMEs) and startups.
  • Maintaining and servicing sophisticated equipment adds to the overall operational expenses, deterring market entry and expansion for some players.
  • Compliance with stringent regulatory standards and food safety regulations adds complexity and costs to developing, manufacturing, and operating food processing equipment.
  • Meeting these requirements often necessitates continuous upgrades and modifications to equipment designs and processes, a rise in operational challenges, and hinders market growth.
  • While demand for processed foods is growing globally, advanced food processing equipment adoption remains limited in certain developing regions due to a lack of infrastructure, inadequate technical expertise, and economic constraints.

Category-wise Insights

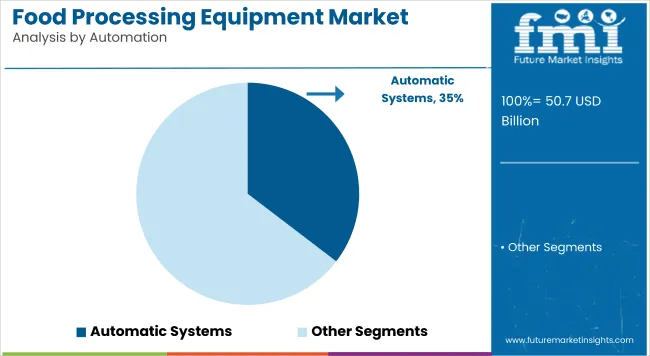
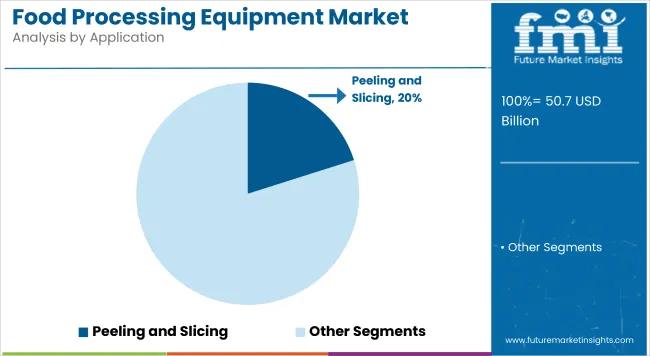
The below section shows the leading segment. Based on the automation type, the automatic segment is accounted to hold a market share of 35.4% in 2024. Based on application, the peeling and slicing segment is accounted to hold a market share of 20.1% in 2024.

Categories Market Share in 2024
Automatic 35.4%
Peeling and Slicing 20.1%

Automatic Segment to Hold a Significant Share in the Market

Based on automation type, the automatic segment stands out, capturing a significant market share of 35.4%. The growing adoption of automatic food processing equipment can be attributed to several factors, including the need for improved efficiency, consistency, and precision in food production processes.

By automating repetitive tasks and minimizing human intervention, automatic equipment helps enhance productivity, reduce labor costs, and maintain product quality and hygiene standards.

Advancements in automation technologies such as robotics, artificial intelligence, and machine learning are further driving the demand for automatic food processing equipment as manufacturers seek to optimize their operations and stay competitive.

Peeling and Slicing Segment to Hold a Dominant Share in the Market

Based on application, the peeling and slicing segment is accounted to hold a market share of 20.1% in 2024. The segment encompasses a variety of machines designed to efficiently peel, slice, dice, or cut food items to desired specifications, facilitating food preparation and production processes.

The high market share of peeling and slicing equipment can be attributed to the widespread use of processed fruits and vegetables in various food products, including salads, snacks, canned goods, and frozen foods.

As consumer demand for convenience and ready-to-eat food products continues to grow, the need for efficient peeling and slicing equipment is expected to remain strong, propelling market growth in this segment.

Country-wise Insights

The table describes the top five countries ranked by revenue, with India holding the top position. India dominates the market due to its moderate growth rate, driven by a burgeoning population, rising incomes, and increasing urbanization.

The diverse food culture and rich agricultural resources fuel the demand for advanced equipment, emphasizing value addition, food safety, and enhanced productivity.

Forecast CAGRs from 2024 to 2034

Countries CAGR
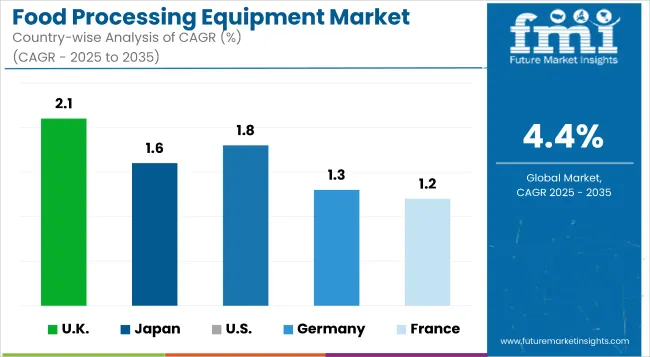
The United States 1.8%
Germany 1.3%
The United Kingdom 2.1%
China 4.3%
India 5.6%

Extensive Usage of Technological Innovation and Automation Retains the United States Market

With a CAGR of 1.8%, the market in the United States is characterized by a strong emphasis on technological innovation and automation. Food processing equipment is widely employed in producing diverse food products, including processed meats, dairy products, snacks, baked goods, and beverages.

The United States is home to numerous food processing companies, ranging from large multinational corporations to small and medium-sized enterprises, which rely on advanced processing equipment to ensure efficiency, consistency, and compliance with stringent quality and safety standards.

Presence of Precision Engineering and High-quality Manufacturing Boost the Market in Germany

In Germany, known for its precision engineering and high-quality manufacturing, the food processing equipment market is important in supporting the renowned food and beverage industry of the country.

German manufacturers are known for producing state-of-the-art equipment tailored to the specific needs of different food processing applications, emphasizing precision, reliability, and energy efficiency.

Rise in Advanced Processing Equipment is Ensuring Market Growth in the United Kingdom

The market in the United Kingdom is integral to the diverse and dynamic food industry. Food processing equipment is utilized by manufacturers across sectors such as meat processing, dairy processing, fruit and vegetable processing, bakery, and ready meals.

Given the emphasis on food safety, quality, and sustainability, there is a boom in demand for advanced processing equipment that meets stringent regulatory requirements while offering efficiency, flexibility, and cost-effectiveness.

Developing the Food and Beverage Industry in China Sustains the Market

The market in China is experiencing rapid growth, augmented by the expanding food and beverage industry and increasing urbanization. With a CAGR of 4.3%, the market in China is characterized by a growing demand for advanced processing equipment to meet the needs of a burgeoning population and changing consumer preferences.

The manufacturers of China are investing in research and development for innovating equipment solutions tailored to the unique requirements of domestic and international markets, focusing on automation, efficiency, and food safety.

Rising Affluence of the Disposable Incomes Gives Rise to a Greater Demand for Food Processing Equipment in India

In India, the market is witnessing robust growth driven by the growing population, rising disposable incomes, and surge in urbanization of the country.

With the rich agricultural resources and diverse food culture, a boom in demand for advanced processing equipment enables value addition, improves food safety and quality, and enhances productivity and efficiency in food production processes.

Competitive Landscape

Regional players cater to niche markets with specialized equipment offerings. Market competition thus intensifies with a focus on innovation, customization, and strategic partnerships to meet evolving consumer demands and stringent regulations.

Some of the key developments

  • In February 2023, Middleby Corporation bolstered its presence in the beverage and bakery industries through strategic acquisitions. The addition of Flavor Burst enriched Middleby's beverage group with advanced flavoring technology, solidifying its position as an innovative food processing and service leader.
  • In February 2023, Escher Mixers expanded Middleby's bakery offerings, integrating automated dough handling and mixing solutions. This move enhanced Middleby's ability to provide comprehensive, efficient solutions to bakery producers, optimizing production, reducing costs, and elevating product quality.

Key Coverage in the Food Processing Equipment Industry Report

  • Adjacent Study on Food Processing Equipment Market, Food Processing and Handling Equipment Market
  • India Food Processing Equipment Market
  • Food Processing Equipment Market Size, Current Insights, and Demographic Trends
  • Global Food Processing Equipment Market Demand
  • Key Opportunities of the Global Food Processing Equipment Market

Report Scope

Attributes Details
Estimated Market Size in 2024 USD 48.58 billion
Projected Market Valuation in 2034 USD 74.66 billion
Value-based CAGR 2024 to 2034 4.4%
Forecast Period 2024 to 2034
Historical Data Available for 2019 to 2023
Market Analysis Value in USD billion
Key Regions Covered North America; Latin America; Western Europe; Eastern Europe; South Asia and Pacific; East Asia; The Middle East and Africa
Key Market Segments Covered Material, Product Type, End Use, Region
Key Countries Profiled

The United States, Canada, Brazil, Mexico, Germany, The United Kingdom, France, Spain, Italy, Russia, Poland, Czech Republic, Romania, India, Bangladesh, Australia, New Zealand, China, Japan, South Korea, GCC countries, South Africa, Israel

Key Companies Profiled

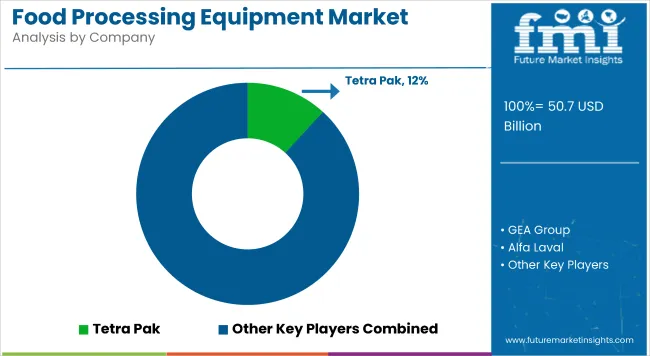
Tetra Pak; Hoshizaki Corp; Gea Group; Alfa Laval; Krones; Middleby; Buhler; Marel; Atlas Pacific Engineering Company Inc.; Welbilt Inc.; Dover; Rational AG

Key Segments

By Automation Type:

  • Automatic
  • Semi-Automatic
  • Manual

By Application:

  • Storage Tank
  • Chiller
  • Pasteurizer
  • Filters
  • CIP Unit
  • Cream Separators
  • Spray Dryer
  • Homogenizer
  • Batch Collectors & Feeders
  • Pulverizing and Mixing
  • Fermenting
  • Peeling and Slicing
  • Others

By Region:

  • North America
  • Latin America
  • Western Europe
  • Eastern Europe
  • South Asia and Pacific
  • East Asia
  • The Middle East and Africa

Table of Content

  • 1. Executive Summary
  • 2. Market Overview
  • 3. Market Background
  • 4. Global Market Analysis 2019 to 2023 and Forecast, 2024 to 2034
  • 5. Global Market Analysis 2019 to 2023 and Forecast 2024 to 2034, By Automation Type
    • 5.1. Automatic
    • 5.2. Semi-Automatic
    • 5.3. Manual
  • 6. Global Market Analysis 2019 to 2023 and Forecast 2024 to 2034, By Application
    • 6.1. Storage Tank
    • 6.2. Chiller
    • 6.3. Pasteurizer
    • 6.4. Filters
    • 6.5. CIP Unit
    • 6.6. Cream Separators
    • 6.7. Spray Dryer
    • 6.8. Homogenizer
    • 6.9. Batch Collectors & Feeders
    • 6.10. Pulverizing and Mixing
    • 6.11. Fermenting
    • 6.12. Peeling and Slicing
    • 6.13. Others
  • 7. Global Market Analysis 2019 to 2023 and Forecast 2024 to 2034, By Region
    • 7.1. North America
    • 7.2. Latin America
    • 7.3. Western Europe
    • 7.4. Eastern Europe
    • 7.5. South Asia and Pacific
    • 7.6. East Asia
    • 7.7. Middle East and Africa
  • 8. North America Market Analysis 2019 to 2023 and Forecast 2024 to 2034, By Country
  • 9. Latin America Market Analysis 2019 to 2023 and Forecast 2024 to 2034, By Country
  • 10. Western Europe Market Analysis 2019 to 2023 and Forecast 2024 to 2034, By Country
  • 11. Eastern Europe Market Analysis 2019 to 2023 and Forecast 2024 to 2034, By Country
  • 12. South Asia and Pacific Market Analysis 2019 to 2023 and Forecast 2024 to 2034, By Country
  • 13. East Asia Market Analysis 2019 to 2023 and Forecast 2024 to 2034, By Country
  • 14. Middle East and Africa Market Analysis 2019 to 2023 and Forecast 2024 to 2034, By Country
  • 15. Key Countries Market Analysis
  • 16. Market Structure Analysis
  • 17. Competition Analysis
    • 17.1. Tetra Pak
    • 17.2. Hoshizaki Corp
    • 17.3. Gea Group
    • 17.4. Alfa Laval
    • 17.5. Krones
    • 17.6. Middleby
    • 17.7. Buhler
    • 17.8. Marel
    • 17.9. Atlas Pacific Engineering Company Inc.
    • 17.10. Welbilt, Inc.
    • 17.11. Dover
    • 17.12. Rational AG
  • 18. Assumptions & Acronyms Used
  • 19. Research Methodology

List of Tables

Table 1: Global Market Value (US$ Million) Forecast by Region, 2019 to 2034

Table 2: Global Market Volume (Units) Forecast by Region, 2019 to 2034

Table 3: Global Market Value (US$ Million) Forecast by Automation Type, 2019 to 2034

Table 4: Global Market Volume (Units) Forecast by Automation Type, 2019 to 2034

Table 5: Global Market Value (US$ Million) Forecast by Application, 2019 to 2034

Table 6: Global Market Volume (Units) Forecast by Application, 2019 to 2034

Table 7: North America Market Value (US$ Million) Forecast by Country, 2019 to 2034

Table 8: North America Market Volume (Units) Forecast by Country, 2019 to 2034

Table 9: North America Market Value (US$ Million) Forecast by Automation Type, 2019 to 2034

Table 10: North America Market Volume (Units) Forecast by Automation Type, 2019 to 2034

Table 11: North America Market Value (US$ Million) Forecast by Application, 2019 to 2034

Table 12: North America Market Volume (Units) Forecast by Application, 2019 to 2034

Table 13: Latin America Market Value (US$ Million) Forecast by Country, 2019 to 2034

Table 14: Latin America Market Volume (Units) Forecast by Country, 2019 to 2034

Table 15: Latin America Market Value (US$ Million) Forecast by Automation Type, 2019 to 2034

Table 16: Latin America Market Volume (Units) Forecast by Automation Type, 2019 to 2034

Table 17: Latin America Market Value (US$ Million) Forecast by Application, 2019 to 2034

Table 18: Latin America Market Volume (Units) Forecast by Application, 2019 to 2034

Table 19: Western Europe Market Value (US$ Million) Forecast by Country, 2019 to 2034

Table 20: Western Europe Market Volume (Units) Forecast by Country, 2019 to 2034

Table 21: Western Europe Market Value (US$ Million) Forecast by Automation Type, 2019 to 2034

Table 22: Western Europe Market Volume (Units) Forecast by Automation Type, 2019 to 2034

Table 23: Western Europe Market Value (US$ Million) Forecast by Application, 2019 to 2034

Table 24: Western Europe Market Volume (Units) Forecast by Application, 2019 to 2034

Table 25: Eastern Europe Market Value (US$ Million) Forecast by Country, 2019 to 2034

Table 26: Eastern Europe Market Volume (Units) Forecast by Country, 2019 to 2034

Table 27: Eastern Europe Market Value (US$ Million) Forecast by Automation Type, 2019 to 2034

Table 28: Eastern Europe Market Volume (Units) Forecast by Automation Type, 2019 to 2034

Table 29: Eastern Europe Market Value (US$ Million) Forecast by Application, 2019 to 2034

Table 30: Eastern Europe Market Volume (Units) Forecast by Application, 2019 to 2034

Table 31: South Asia and Pacific Market Value (US$ Million) Forecast by Country, 2019 to 2034

Table 32: South Asia and Pacific Market Volume (Units) Forecast by Country, 2019 to 2034

Table 33: South Asia and Pacific Market Value (US$ Million) Forecast by Automation Type, 2019 to 2034

Table 34: South Asia and Pacific Market Volume (Units) Forecast by Automation Type, 2019 to 2034

Table 35: South Asia and Pacific Market Value (US$ Million) Forecast by Application, 2019 to 2034

Table 36: South Asia and Pacific Market Volume (Units) Forecast by Application, 2019 to 2034

Table 37: East Asia Market Value (US$ Million) Forecast by Country, 2019 to 2034

Table 38: East Asia Market Volume (Units) Forecast by Country, 2019 to 2034

Table 39: East Asia Market Value (US$ Million) Forecast by Automation Type, 2019 to 2034

Table 40: East Asia Market Volume (Units) Forecast by Automation Type, 2019 to 2034

Table 41: East Asia Market Value (US$ Million) Forecast by Application, 2019 to 2034

Table 42: East Asia Market Volume (Units) Forecast by Application, 2019 to 2034

Table 43: Middle East and Africa Market Value (US$ Million) Forecast by Country, 2019 to 2034

Table 44: Middle East and Africa Market Volume (Units) Forecast by Country, 2019 to 2034

Table 45: Middle East and Africa Market Value (US$ Million) Forecast by Automation Type, 2019 to 2034

Table 46: Middle East and Africa Market Volume (Units) Forecast by Automation Type, 2019 to 2034

Table 47: Middle East and Africa Market Value (US$ Million) Forecast by Application, 2019 to 2034

Table 48: Middle East and Africa Market Volume (Units) Forecast by Application, 2019 to 2034

List of Figures

Figure 1: Global Market Value (US$ Million) by Automation Type, 2024 to 2034

Figure 2: Global Market Value (US$ Million) by Application, 2024 to 2034

Figure 3: Global Market Value (US$ Million) by Region, 2024 to 2034

Figure 4: Global Market Value (US$ Million) Analysis by Region, 2019 to 2034

Figure 5: Global Market Volume (Units) Analysis by Region, 2019 to 2034

Figure 6: Global Market Value Share (%) and BPS Analysis by Region, 2024 to 2034

Figure 7: Global Market Y-o-Y Growth (%) Projections by Region, 2024 to 2034

Figure 8: Global Market Value (US$ Million) Analysis by Automation Type, 2019 to 2034

Figure 9: Global Market Volume (Units) Analysis by Automation Type, 2019 to 2034

Figure 10: Global Market Value Share (%) and BPS Analysis by Automation Type, 2024 to 2034

Figure 11: Global Market Y-o-Y Growth (%) Projections by Automation Type, 2024 to 2034

Figure 12: Global Market Value (US$ Million) Analysis by Application, 2019 to 2034

Figure 13: Global Market Volume (Units) Analysis by Application, 2019 to 2034

Figure 14: Global Market Value Share (%) and BPS Analysis by Application, 2024 to 2034

Figure 15: Global Market Y-o-Y Growth (%) Projections by Application, 2024 to 2034

Figure 16: Global Market Attractiveness by Automation Type, 2024 to 2034

Figure 17: Global Market Attractiveness by Application, 2024 to 2034

Figure 18: Global Market Attractiveness by Region, 2024 to 2034

Figure 19: North America Market Value (US$ Million) by Automation Type, 2024 to 2034

Figure 20: North America Market Value (US$ Million) by Application, 2024 to 2034

Figure 21: North America Market Value (US$ Million) by Country, 2024 to 2034

Figure 22: North America Market Value (US$ Million) Analysis by Country, 2019 to 2034

Figure 23: North America Market Volume (Units) Analysis by Country, 2019 to 2034

Figure 24: North America Market Value Share (%) and BPS Analysis by Country, 2024 to 2034

Figure 25: North America Market Y-o-Y Growth (%) Projections by Country, 2024 to 2034

Figure 26: North America Market Value (US$ Million) Analysis by Automation Type, 2019 to 2034

Figure 27: North America Market Volume (Units) Analysis by Automation Type, 2019 to 2034

Figure 28: North America Market Value Share (%) and BPS Analysis by Automation Type, 2024 to 2034

Figure 29: North America Market Y-o-Y Growth (%) Projections by Automation Type, 2024 to 2034

Figure 30: North America Market Value (US$ Million) Analysis by Application, 2019 to 2034

Figure 31: North America Market Volume (Units) Analysis by Application, 2019 to 2034

Figure 32: North America Market Value Share (%) and BPS Analysis by Application, 2024 to 2034

Figure 33: North America Market Y-o-Y Growth (%) Projections by Application, 2024 to 2034

Figure 34: North America Market Attractiveness by Automation Type, 2024 to 2034

Figure 35: North America Market Attractiveness by Application, 2024 to 2034

Figure 36: North America Market Attractiveness by Country, 2024 to 2034

Figure 37: Latin America Market Value (US$ Million) by Automation Type, 2024 to 2034

Figure 38: Latin America Market Value (US$ Million) by Application, 2024 to 2034

Figure 39: Latin America Market Value (US$ Million) by Country, 2024 to 2034

Figure 40: Latin America Market Value (US$ Million) Analysis by Country, 2019 to 2034

Figure 41: Latin America Market Volume (Units) Analysis by Country, 2019 to 2034

Figure 42: Latin America Market Value Share (%) and BPS Analysis by Country, 2024 to 2034

Figure 43: Latin America Market Y-o-Y Growth (%) Projections by Country, 2024 to 2034

Figure 44: Latin America Market Value (US$ Million) Analysis by Automation Type, 2019 to 2034

Figure 45: Latin America Market Volume (Units) Analysis by Automation Type, 2019 to 2034

Figure 46: Latin America Market Value Share (%) and BPS Analysis by Automation Type, 2024 to 2034

Figure 47: Latin America Market Y-o-Y Growth (%) Projections by Automation Type, 2024 to 2034

Figure 48: Latin America Market Value (US$ Million) Analysis by Application, 2019 to 2034

Figure 49: Latin America Market Volume (Units) Analysis by Application, 2019 to 2034

Figure 50: Latin America Market Value Share (%) and BPS Analysis by Application, 2024 to 2034

Figure 51: Latin America Market Y-o-Y Growth (%) Projections by Application, 2024 to 2034

Figure 52: Latin America Market Attractiveness by Automation Type, 2024 to 2034

Figure 53: Latin America Market Attractiveness by Application, 2024 to 2034

Figure 54: Latin America Market Attractiveness by Country, 2024 to 2034

Figure 55: Western Europe Market Value (US$ Million) by Automation Type, 2024 to 2034

Figure 56: Western Europe Market Value (US$ Million) by Application, 2024 to 2034

Figure 57: Western Europe Market Value (US$ Million) by Country, 2024 to 2034

Figure 58: Western Europe Market Value (US$ Million) Analysis by Country, 2019 to 2034

Figure 59: Western Europe Market Volume (Units) Analysis by Country, 2019 to 2034

Figure 60: Western Europe Market Value Share (%) and BPS Analysis by Country, 2024 to 2034

Figure 61: Western Europe Market Y-o-Y Growth (%) Projections by Country, 2024 to 2034

Figure 62: Western Europe Market Value (US$ Million) Analysis by Automation Type, 2019 to 2034

Figure 63: Western Europe Market Volume (Units) Analysis by Automation Type, 2019 to 2034

Figure 64: Western Europe Market Value Share (%) and BPS Analysis by Automation Type, 2024 to 2034

Figure 65: Western Europe Market Y-o-Y Growth (%) Projections by Automation Type, 2024 to 2034

Figure 66: Western Europe Market Value (US$ Million) Analysis by Application, 2019 to 2034

Figure 67: Western Europe Market Volume (Units) Analysis by Application, 2019 to 2034

Figure 68: Western Europe Market Value Share (%) and BPS Analysis by Application, 2024 to 2034

Figure 69: Western Europe Market Y-o-Y Growth (%) Projections by Application, 2024 to 2034

Figure 70: Western Europe Market Attractiveness by Automation Type, 2024 to 2034

Figure 71: Western Europe Market Attractiveness by Application, 2024 to 2034

Figure 72: Western Europe Market Attractiveness by Country, 2024 to 2034

Figure 73: Eastern Europe Market Value (US$ Million) by Automation Type, 2024 to 2034

Figure 74: Eastern Europe Market Value (US$ Million) by Application, 2024 to 2034

Figure 75: Eastern Europe Market Value (US$ Million) by Country, 2024 to 2034

Figure 76: Eastern Europe Market Value (US$ Million) Analysis by Country, 2019 to 2034

Figure 77: Eastern Europe Market Volume (Units) Analysis by Country, 2019 to 2034

Figure 78: Eastern Europe Market Value Share (%) and BPS Analysis by Country, 2024 to 2034

Figure 79: Eastern Europe Market Y-o-Y Growth (%) Projections by Country, 2024 to 2034

Figure 80: Eastern Europe Market Value (US$ Million) Analysis by Automation Type, 2019 to 2034

Figure 81: Eastern Europe Market Volume (Units) Analysis by Automation Type, 2019 to 2034

Figure 82: Eastern Europe Market Value Share (%) and BPS Analysis by Automation Type, 2024 to 2034

Figure 83: Eastern Europe Market Y-o-Y Growth (%) Projections by Automation Type, 2024 to 2034

Figure 84: Eastern Europe Market Value (US$ Million) Analysis by Application, 2019 to 2034

Figure 85: Eastern Europe Market Volume (Units) Analysis by Application, 2019 to 2034

Figure 86: Eastern Europe Market Value Share (%) and BPS Analysis by Application, 2024 to 2034

Figure 87: Eastern Europe Market Y-o-Y Growth (%) Projections by Application, 2024 to 2034

Figure 88: Eastern Europe Market Attractiveness by Automation Type, 2024 to 2034

Figure 89: Eastern Europe Market Attractiveness by Application, 2024 to 2034

Figure 90: Eastern Europe Market Attractiveness by Country, 2024 to 2034

Figure 91: South Asia and Pacific Market Value (US$ Million) by Automation Type, 2024 to 2034

Figure 92: South Asia and Pacific Market Value (US$ Million) by Application, 2024 to 2034

Figure 93: South Asia and Pacific Market Value (US$ Million) by Country, 2024 to 2034

Figure 94: South Asia and Pacific Market Value (US$ Million) Analysis by Country, 2019 to 2034

Figure 95: South Asia and Pacific Market Volume (Units) Analysis by Country, 2019 to 2034

Figure 96: South Asia and Pacific Market Value Share (%) and BPS Analysis by Country, 2024 to 2034

Figure 97: South Asia and Pacific Market Y-o-Y Growth (%) Projections by Country, 2024 to 2034

Figure 98: South Asia and Pacific Market Value (US$ Million) Analysis by Automation Type, 2019 to 2034

Figure 99: South Asia and Pacific Market Volume (Units) Analysis by Automation Type, 2019 to 2034

Figure 100: South Asia and Pacific Market Value Share (%) and BPS Analysis by Automation Type, 2024 to 2034

Figure 101: South Asia and Pacific Market Y-o-Y Growth (%) Projections by Automation Type, 2024 to 2034

Figure 102: South Asia and Pacific Market Value (US$ Million) Analysis by Application, 2019 to 2034

Figure 103: South Asia and Pacific Market Volume (Units) Analysis by Application, 2019 to 2034

Figure 104: South Asia and Pacific Market Value Share (%) and BPS Analysis by Application, 2024 to 2034

Figure 105: South Asia and Pacific Market Y-o-Y Growth (%) Projections by Application, 2024 to 2034

Figure 106: South Asia and Pacific Market Attractiveness by Automation Type, 2024 to 2034

Figure 107: South Asia and Pacific Market Attractiveness by Application, 2024 to 2034

Figure 108: South Asia and Pacific Market Attractiveness by Country, 2024 to 2034

Figure 109: East Asia Market Value (US$ Million) by Automation Type, 2024 to 2034

Figure 110: East Asia Market Value (US$ Million) by Application, 2024 to 2034

Figure 111: East Asia Market Value (US$ Million) by Country, 2024 to 2034

Figure 112: East Asia Market Value (US$ Million) Analysis by Country, 2019 to 2034

Figure 113: East Asia Market Volume (Units) Analysis by Country, 2019 to 2034

Figure 114: East Asia Market Value Share (%) and BPS Analysis by Country, 2024 to 2034

Figure 115: East Asia Market Y-o-Y Growth (%) Projections by Country, 2024 to 2034

Figure 116: East Asia Market Value (US$ Million) Analysis by Automation Type, 2019 to 2034

Figure 117: East Asia Market Volume (Units) Analysis by Automation Type, 2019 to 2034

Figure 118: East Asia Market Value Share (%) and BPS Analysis by Automation Type, 2024 to 2034

Figure 119: East Asia Market Y-o-Y Growth (%) Projections by Automation Type, 2024 to 2034

Figure 120: East Asia Market Value (US$ Million) Analysis by Application, 2019 to 2034

Figure 121: East Asia Market Volume (Units) Analysis by Application, 2019 to 2034

Figure 122: East Asia Market Value Share (%) and BPS Analysis by Application, 2024 to 2034

Figure 123: East Asia Market Y-o-Y Growth (%) Projections by Application, 2024 to 2034

Figure 124: East Asia Market Attractiveness by Automation Type, 2024 to 2034

Figure 125: East Asia Market Attractiveness by Application, 2024 to 2034

Figure 126: East Asia Market Attractiveness by Country, 2024 to 2034

Figure 127: Middle East and Africa Market Value (US$ Million) by Automation Type, 2024 to 2034

Figure 128: Middle East and Africa Market Value (US$ Million) by Application, 2024 to 2034

Figure 129: Middle East and Africa Market Value (US$ Million) by Country, 2024 to 2034

Figure 130: Middle East and Africa Market Value (US$ Million) Analysis by Country, 2019 to 2034

Figure 131: Middle East and Africa Market Volume (Units) Analysis by Country, 2019 to 2034

Figure 132: Middle East and Africa Market Value Share (%) and BPS Analysis by Country, 2024 to 2034

Figure 133: Middle East and Africa Market Y-o-Y Growth (%) Projections by Country, 2024 to 2034

Figure 134: Middle East and Africa Market Value (US$ Million) Analysis by Automation Type, 2019 to 2034

Figure 135: Middle East and Africa Market Volume (Units) Analysis by Automation Type, 2019 to 2034

Figure 136: Middle East and Africa Market Value Share (%) and BPS Analysis by Automation Type, 2024 to 2034

Figure 137: Middle East and Africa Market Y-o-Y Growth (%) Projections by Automation Type, 2024 to 2034

Figure 138: Middle East and Africa Market Value (US$ Million) Analysis by Application, 2019 to 2034

Figure 139: Middle East and Africa Market Volume (Units) Analysis by Application, 2019 to 2034

Figure 140: Middle East and Africa Market Value Share (%) and BPS Analysis by Application, 2024 to 2034

Figure 141: Middle East and Africa Market Y-o-Y Growth (%) Projections by Application, 2024 to 2034

Figure 142: Middle East and Africa Market Attractiveness by Automation Type, 2024 to 2034

Figure 143: Middle East and Africa Market Attractiveness by Application, 2024 to 2034

Figure 144: Middle East and Africa Market Attractiveness by Country, 2024 to 2034

Frequently Asked Questions

What is the expected worth of the food processing equipment market in 2024?

As of 2024, the market for food processing equipment is expected to be valued at USD 48.58 billion.

What is the market potential for food processing equipment?

The food processing equipment market is projected to expand at a CAGR of 4.4% between 2024 and 2034.

Which automation type segment dominates the food processing equipment market?

The automatic segment is projected to dominate the industry.

What is the anticipated market value for food processing equipment in 2034?

By 2034, the market value of the food processing equipment is expected to reach USD 74.66 billion.

Which country is likely to dominate the food processing equipment market?

India is likely the top-performing market, with a CAGR of 5.6%.

Explore Similar Insights

Future Market Insights

Food Processing Equipment Market