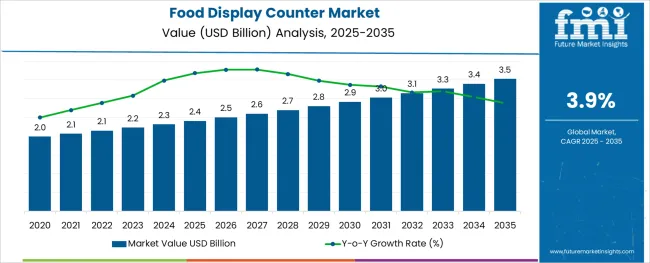
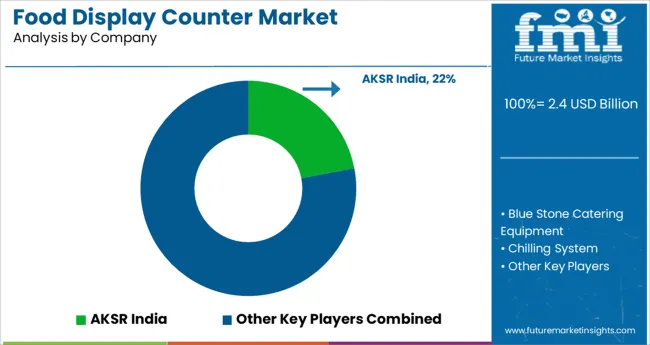
The Food Display Counter Market is estimated to be valued at USD 2.4 billion in 2025 and is projected to reach USD 3.5 billion by 2035, registering a compound annual growth rate (CAGR) of 3.9% over the forecast period.

The alginic acid market is undergoing consistent growth, propelled by rising demand from food processing, pharmaceutical formulations, and cosmetic applications. A growing focus on natural and sustainable ingredients in manufacturing processes has positioned alginic acid as a preferred biopolymer across industries.
The market is further supported by its diverse functional benefits, including water retention, gelling, and stabilizing properties, which make it indispensable in high-performance formulations. Increased regulatory acceptance of alginates as safe additives and the push towards cleaner labeling in food and personal care products have reinforced their adoption.
Ongoing innovation in extraction technologies and the utilization of algae as a renewable resource are paving the way for cost-effective production and expanded applications, ensuring sustained market expansion in the coming years.
The market is segmented by Shape, Shelf Type, Food Type, and Sales Channel and region. By Shape, the market is divided into Straight, Bended, Round, L Shaped, and Others. In terms of Shelf Type, the market is classified into Two and More than two. Based on Food Type, the market is segmented into Hot Food, Cool Food, and Dry Food (Snacks, candies, etc.). By Sales Channel, the market is divided into Offline and Online. Regionally, the market is classified into North America, Latin America, Western Europe, Eastern Europe, Balkan & Baltic Countries, Russia & Belarus, Central Asia, East Asia, South Asia & Pacific, and the Middle East & Africa.
When segmented by salts, sodium alginate is expected to command 27.5% of the market revenue in 2025, marking it as the leading subsegment in this category. This leadership has been driven by its superior solubility, ease of incorporation into formulations, and versatility in a wide range of applications.
Its ability to form stable gels and maintain viscosity under varying conditions has made it highly sought after in both food and pharmaceutical sectors. Manufacturers have prioritized sodium alginate due to its consistent performance, cost-effectiveness, and regulatory acceptance, which have collectively strengthened its position.
The segment’s prominence has also been enhanced by its adaptability to evolving consumer preferences for plant-derived and sustainable ingredients, reinforcing its market share.
Segmented by end user industry, the food industry is projected to hold 33.0% of the market revenue in 2025, positioning it as the most prominent sector. This dominance has been shaped by the industry’s increasing reliance on alginic acid and its derivatives to deliver desirable textures, stabilize emulsions, and improve shelf life of processed foods.
As consumer demand for clean label and natural additives has intensified, the food sector has responded by integrating alginates into bakery, dairy, and confectionery products. Enhanced production efficiency and compliance with food safety standards have further encouraged widespread use.
The segment’s leadership has also been supported by product differentiation strategies where alginates contribute to premium quality and innovation, securing their role in modern food formulations.
When analyzed by functionality, thickening agents are forecast to account for 29.0% of the market revenue in 2025, establishing themselves as the dominant functional category. This preeminence has been underpinned by the growing need for consistent texture and viscosity in a wide array of end products.
Alginic acid’s natural origin and high efficiency in creating uniform, stable thickness without altering taste or color have solidified its appeal. The demand for thickeners in both edible and topical applications has expanded, with manufacturers leveraging its rheological properties to meet performance and regulatory requirements.
The functionality’s leading share has also been reinforced by the ability to deliver cost savings through lower dosages and its compatibility with other ingredients, securing its position as an indispensable component in formulation strategies.
As reported by the food display counter market survey undertaken by FMI in the last few years, the overall market has experienced an impressive jump from its previous growth record of 3.1%.
Urban residents' rising disposable incomes and changing lifestyles have as a corollary boosted the popularity of shops with bakery glass counters.
While a key element propelling the sales of the food display counter market throughout the aforementioned projection period would be the rapidly rising middle-class income, the cultural shift among the present populace by the influence of electronic media is witnessed to be favoring the target market exceptionally.
The global food display counter market is projected to rise throughout the aforementioned forecast timeline due to a variety of other factors, including the quick expansion of supermarkets and street food businesses.
Countertop cake display fridge cases are also more space-efficient than conventional food display glass cases as it eliminates the requirement for a refrigerated storage device. Medium- and small-sized retailers' have also realized the need for chilled food and meat display counters as it normally promotes business expansion in such outlets, which have constrained financial stability and floor space
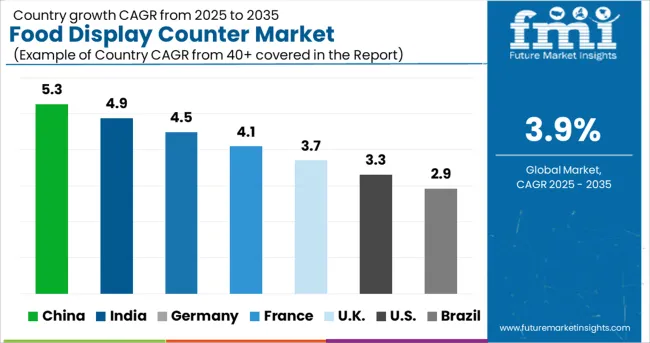
The countertop food display cabinets with bent shapes are the most popular segment in comparison to all other shapes available in the market today. This category is predicted to grow at an annual growth rate of 4.2% in the coming days. Contrarily, the round-shaped food display cabinet is also a popular choice among users for its fancy look and straight-shaped counters give the advantage of precise space and energy management.
Though conventionally food items that are served hot in temperate regions are the largest user segment for the food display counter market share, presently there has been a growing sales of the product for the cold food type as well. Moreover, the improving economic condition in tropical countries is also driving the food display counter market trends for the cold food segment at a CAGR of 3.7%.

In accordance with the previous food display counter market survey reports released by the FMI, the USA dominates the overall market by contributing more than 33% of the total revenue generated yearly. As per the records, this regional market is poised to progress at a rate of 4.4% for the next ten years and would reach a valuation of USD 3.5 Million by the end of the year 2035.
As a result of the dominance of North America and Europe in the processed food exhibition market along with technological advancements in the food business, the prominence of big food chains, and the region's fully established manufacturing capacity are regarded to be the major factors driving the USA food display counter market share.
European citizens are famous for their leisurely outings and craving for street and conventional foods resulting in vast local markets for snacks and beverages with branded and regional outlets all across the streets. Such a unique trend in almost all countries has consequently resulted in huge demand for regional food display counters in Europe aggregately. Moreover, the ever-increasing tourism volume in countries like France, Spain, Germany, and others is also anticipated to play a crucial role in the furtherance of the European, particularly German food display counter market.
Due to higher levels of expenditure by manufacturers and public organizations in the expansion of energy-efficient commercial equipment and rising utilization of the commercial food display cabinet for storage in the food and beverage industry, the United Kingdom is anticipated to have the highest growth rate of nearly 5.5% in the said market.
China is the dominating region in the export and sales of food display counters and it contributes to almost USD 290 Million in China’s economy each year. On the other hand, Japan is also strengthening its export volume, following the trade wars between China and other countries creating some new opportunities for its industries including the food display counter industry. Presently, the net worth of the Japanese food display counter market is estimated to be around USD 142 Million.
Rising demand for food display counters in neighboring countries like China and India is also anticipated to play a major role in the development of the market in this country. Because there is a growing market for food, snacks, and prepared food items. The Japan food display counter market is projected to garner some new opportunities and grow at a pace of 4.1% throughout the forecast years.
Traditionally the demand for food display counters in local markets of South Korea has remained limited in comparison to other developed economies of the world. The net worth of the total sales of such items was estimated to be around USD 63.6 Million in the present day and is predicted to reach a valuation of USD 81.1 Billion in the next ten years.
Although during the duration of the market prediction for food display cabinets, the global market is anticipated to expand at the rate of 3.9%, it would remain limited in the country of South Korea which would experience a growth rate of a mere 2.4% in this sector. The nation's food and retail industries have development potential because of the region's growing economies' stimulation of economic growth and the domestic population is shifting away from the traditional method of eating only homemade food and is expected to support the South Korean food display counter market.
The fluctuating and often unexpected quality of the food pushed on by continually changing and adverse weather conditions is a problem the fresh food industry is now grappling with. Temperature tracking and monitoring along the refrigerated food supply chain have become increasingly essential to maintaining strict food quality standards and fresh fruit and vegetables safety. The sweet shop counter aids in comparing the cold food supply systems' printed and dynamically anticipated shelf life dependent on temperature making it a highly contributing product for the food display counter market.
The global food and beverage business is anticipated to develop as a result of improved accessibility and adjustments in consumer purchasing habits. Additionally, the necessity for refrigeration systems has grown as a result of concerns about food safety and cleanliness. More convenient and appealing items are also made possible by the rising demand for cutting-edge technology like beautiful displays and 3D printing.
Transparent screen or door cooling casings, in accordance with the USA Department of Energy, can reduce the energy demand of the cooling system by 50% to 80%, and smart cooling reduces the quantity of cold air entering the shop, which results in considerable efficiency improvements.
A wonderful strategy to promote food goods and induce impulsive client purchases is to display cooked foods for the customer’s convenience. New food display counter market players that have entered the sector recently are adopting new strategies and business models such as custom-making the product with appropriate stickering and graphics as per the requirement of the customer. Any catering company that wishes to maintain its food enticing and fresh during the business cycle would benefit from adding food display cabinets as a fashionable accessory.

The leading food display counter manufacturers in the global market are highly investing in Research and Development to provide an effective product that is expected to boost the market's progress from 2025 to 2035. Additionally, compared to a typical countertop food display case, the initial expenditure needed to install smart food display counters is far lower providing a huge impetus to its growing popularity.
The global food display counter market is estimated to be valued at USD 2.4 billion in 2025.
It is projected to reach USD 3.5 billion by 2035.
The market is expected to grow at a 3.9% CAGR between 2025 and 2035.
The key product types are straight, bended, round, l shaped and others.
two segment is expected to dominate with a 58.0% industry share in 2025.


Our Research Products

The "Full Research Suite" delivers actionable market intel, deep dives on markets or technologies, so clients act faster, cut risk, and unlock growth.

The Leaderboard benchmarks and ranks top vendors, classifying them as Established Leaders, Leading Challengers, or Disruptors & Challengers.

Locates where complements amplify value and substitutes erode it, forecasting net impact by horizon

We deliver granular, decision-grade intel: market sizing, 5-year forecasts, pricing, adoption, usage, revenue, and operational KPIs—plus competitor tracking, regulation, and value chains—across 60 countries broadly.

Spot the shifts before they hit your P&L. We track inflection points, adoption curves, pricing moves, and ecosystem plays to show where demand is heading, why it is changing, and what to do next across high-growth markets and disruptive tech

Real-time reads of user behavior. We track shifting priorities, perceptions of today’s and next-gen services, and provider experience, then pace how fast tech moves from trial to adoption, blending buyer, consumer, and channel inputs with social signals (#WhySwitch, #UX).

Partner with our analyst team to build a custom report designed around your business priorities. From analysing market trends to assessing competitors or crafting bespoke datasets, we tailor insights to your needs.
Supplier Intelligence
Discovery & Profiling
Capacity & Footprint
Performance & Risk
Compliance & Governance
Commercial Readiness
Who Supplies Whom
Scorecards & Shortlists
Playbooks & Docs
Category Intelligence
Definition & Scope
Demand & Use Cases
Cost Drivers
Market Structure
Supply Chain Map
Trade & Policy
Operating Norms
Deliverables
Buyer Intelligence
Account Basics
Spend & Scope
Procurement Model
Vendor Requirements
Terms & Policies
Entry Strategy
Pain Points & Triggers
Outputs
Pricing Analysis
Benchmarks
Trends
Should-Cost
Indexation
Landed Cost
Commercial Terms
Deliverables
Brand Analysis
Positioning & Value Prop
Share & Presence
Customer Evidence
Go-to-Market
Digital & Reputation
Compliance & Trust
KPIs & Gaps
Outputs
Full Research Suite comprises of:
Market outlook & trends analysis
Interviews & case studies
Strategic recommendations
Vendor profiles & capabilities analysis
5-year forecasts
8 regions and 60+ country-level data splits
Market segment data splits
12 months of continuous data updates
DELIVERED AS:
PDF EXCEL ONLINE
Food & Beverage OEE Software Market Size and Share Forecast Outlook 2025 to 2035
Food Grade Crosslinked Polyvinylpolypyrrolidone (PVPP) Market Size and Share Forecast Outlook 2025 to 2035
Food Grade Cassia Gum Powder Market Size and Share Forecast Outlook 2025 to 2035
Food Grade Dry Film Lubricant Market Size and Share Forecast Outlook 2025 to 2035
Foodservice Equipment Market Analysis - Size, Share, and Forecast Outlook 2025 to 2035
Food Basket Market Forecast and Outlook 2025 to 2035
Food Grade Tremella Polysaccharide Market Size and Share Forecast Outlook 2025 to 2035
Food Sorting Machine Market Size and Share Forecast Outlook 2025 to 2035
Foodservice Paper Bag Market Size and Share Forecast Outlook 2025 to 2035
Food Stabilizers Market Size and Share Forecast Outlook 2025 to 2035
Food Packaging Film Market Size and Share Forecast Outlook 2025 to 2035
Food Certification Market Size and Share Forecast Outlook 2025 to 2035
Food Tray Market Size and Share Forecast Outlook 2025 to 2035
Food & Beverage Industrial Disinfection and Cleaning Market Size and Share Forecast Outlook 2025 to 2035
Food Technology Market Size and Share Forecast Outlook 2025 to 2035
Food Tourism Sector Market Size and Share Forecast Outlook 2025 to 2035
Food Processing Boiler Market Size and Share Forecast Outlook 2025 to 2035
Food Packaging Machines Market Size and Share Forecast Outlook 2025 to 2035
Food Minerals Market Size and Share Forecast Outlook 2025 to 2035
Food And Beverage Chemicals Market Size and Share Forecast Outlook 2025 to 2035

Thank you!
You will receive an email from our Business Development Manager. Please be sure to check your SPAM/JUNK folder too.
Chat With
MaRIA