Reports

- Global Locations -

Headquarters

Future Market Insights, Inc.

Christiana Corporate, 200
Continental Drive, Suite 401,
Newark, Delaware - 19713,
United States

T: +1-845-579-5705

Americas

Future Market Insights, Inc.

616 Corporate Way, Suite 2-9018,
Valley Cottage, NY 10989, United States

T: +1-347-918-3531

MEA

Future Market Insights

1602-6 Jumeirah Bay X2 Tower, Plot No: JLT-PH2-X2A,
Jumeirah Lakes Towers, Dubai,
United Arab Emirates

Europe

Future Market Insights

3rd Floor, 207 Regent Street,
W1B 3HH London
United Kingdom

T: + 44 (0) 20 8123 9659
D: +44 (0) 20 3287 4268

Asia Pacific

Future Market Insights

IndiaLand Global Tech Park, Unit UG-1, Behind Grand HighStreet, Phase 1, Hinjawadi, MH, Pune – 411057, India

Food and Beverage Protective Cultures Market Outlook (2022-2032)

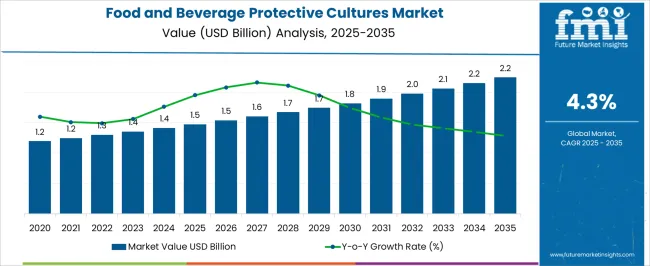
[299 Pages Report] The global food and beverage protective cultures market is expected to secure US$ 1,980.6 Million in 2032 while expanding at a CAGR of 4.3%. The market is likely to hold a value of US$ 1,300 Million in 2022. From 2016-2021, the market exhibited a growth rate of 4.3%.

The growing market for ready-to-eat foods is expected to continue its growth in developed countries in the near future. Increased diet programs in the market and increasing health awareness among consumers is expected to have an impact on the sales of packed meat alternatives.

Food waste is primarily caused by spoilage. With modern lifestyles becoming more hectic, convenient options need to be available that can be consumed without refrigeration. Innovations in the food and beverage industry are greatly impacted by the challenges presented by new consumer trends in the market.

Data Points Key Statistics
Expected Base Year Value (2022) US$ 1,300 Million
Projected Market Value (2032) US$ 1,980.6 Million
Estimated Growth Rate (2022-2032) 4.3% CAGR

In an increasingly competitive landscape, new developments are enabling businesses to broaden their product offerings and discover previously unexplored markets. In addition to improving food safety, further distribution of products can also open up more innovation opportunities. In contrast, consumers and food manufacturers are becoming concerned about food waste.

As dairy manufacturers strive to meet consumer demands for more natural and clean label products, protective cultures are essential to prevent spoilage throughout shelf life and extending shelf life.

Food and beverage companies are striving to make their products healthier and safer while extending their shelf life by substituting protective cultures for artificial preservatives. A bioscience company that develops natural food ingredients and solutions manufactures food and beverage protective cultures.

To better serve their clients in reaching health conscious consumers, global bioscience companies are increasingly developing protective cultures for food and beverages in the market. With the growth of the retail sector and the increase in foreign direct investment, various hypermarkets, department stores, and retail outlets have opened for these products in the market.

It is very important to prevent spoilage of food products sold in these stores because they may have been shipped from a long distance. Protective cultures markets are expected to benefit from this factor over the forecast period.

Don't pay for what you don't need

Customize your report by selecting specific countries or regions and save 30%!

What Are The Factors Contributing To The Growth Of The Global Food And Beverage Protective Cultures Market?

Consumers with a strong health-conscious attitude drive competition among major players in the global food and beverage industry. It is imperative for brands and manufacturers in the food and beverage industry to communicate the value of their products to their target audiences while maintaining the highest quality of shelf life.

In recent years, packaged food has come under the spotlight of attention due to changing lifestyles and peculiar eating habits. Market revenue for food and beverage protective cultures is expected to increase gradually in the future. Companies that manufacture protective cultures for food and beverages provide alternatives to artificial preservatives.

Food and beverage manufacturers commonly use artificial preservatives in the fabrication of food and beverages, especially fermented foods, in order to extend their shelf lives. As dairy and meat products are highly perishable, it is highly important to use protective cultures in these products to ensure that they do not rapidly deteriorate.

Food and beverage brands have become increasingly concerned with extending the shelf life of their products. Hence, protective cultures are increasingly being used to extend shelf life. When serving a large global market, shelf life is crucial when it comes to inventorying and supply chain management.

Retail shelves are filled with brands that have product portfolios that last a long time. Compared to artificial preservatives, protective cultures are more expensive. Even though protective cultures are relatively more expensive, food and beverage brands are increasingly adopting them since they allow them to target consumers who demand natural alternatives to processed foods.

In addition to communicating the benefits of natural ingredients over artificial preservatives, ingredient marketing is a growing trend among manufacturers and marketers. Recent advances have been made in the development of protective cultures that do not require fermentation to be added to food and beverages.

In response to consumer demands for organic foods and beverages, food and beverage manufacturers are highly investing in protective cultures for food and beverages. The global market for protective cultures faces limited or restricted scope for foods that are heat treated.

However, continuous product innovation and new product development processes are expected to broaden the scope of application for the food and beverages protective cultures market.

How Is The Global Market For Food And Beverage Protective Cultures Being Hampered?

Protective cultures will face major challenges as a result of stringent laws and regulations imposed by the government. A growing demand for vegan food products and concerns about health issues related to these preservatives are expected to further diminish this market's growth.

There will be further declines in the scope for growth for the protective cultures market owing to fluctuations in prices of raw materials and disruptions in the supply chain as a result of the pandemic. Research and development costs associated with protective cultures will also hinder the growth rate of the future market.
Nandini Roy Choudhury

Principal Consultant

Talk to Analyst

Find your sweet spots for generating winning opportunities in this market.

Region-Wise Analysis

Why North America is emerging as an Opportunistic Food and Beverage Protective Cultures Market?

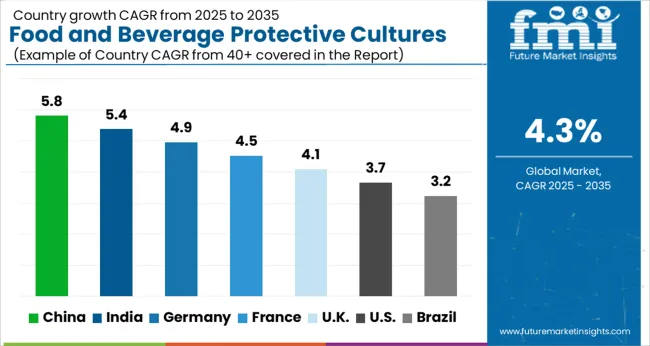
The North American market has emerged as a major powerhouse in the food and beverage sector in recent decades, and the market is predicted to continue to grow between 2022 and 2032 as a result of environmental factors. With a market share of 33% by the end of 2022, North America is predicted to account for a significant share of that growth.

Several retail chains and outlets in North America have contributed to an increase in demand for protective cultures in the food and beverage industry. The increasing consumption of dairy and meat products in these regions will also propel the growth of food and beverage protective cultures.

Consumption of beverages in these regions is expected to increase, creating a large total incremental opportunity between 2017 and 2032. The combined effects of all these factors are driving the market for protective cultures in the food and beverage sector.
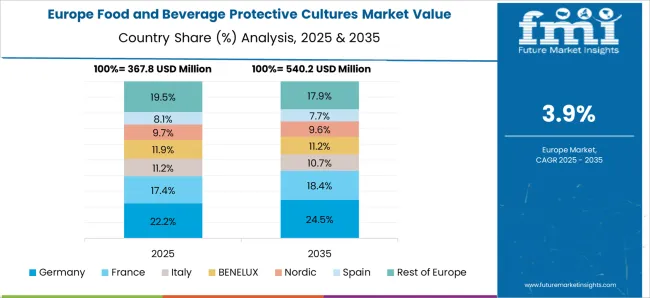
How do the Food and Beverage Protective Culture Sales in Europe Look?

According to Future Market Insights, Europe is accounted for the second largest share of the market with 28.5%. Dairy production in Europe accounts for one of the major factors that is contributing to the region's position as the dominant region on the market.

Increasing milk production and strong global demand have positively impacted the European dairy market. Protective cultures have experienced significant growth as a result of support from the European dairy market.

In addition to resurging adoption of various food safety trends, increasing innovation across the food and beverage sector has contributed to significantly growing business opportunities for protective cultures.

The majority of European consumers prefer dairy products that are natural, organic, and sustainable, containing minimal processing and a simple list of ingredients. A transparent product labeling system also facilitates the knowledge of ingredients used in dairy products among health-conscious consumers in the region. These factors have propelled the growth of protective cultures in the market.

Category Wise Insights

Why are Consumers Relying on Organic Food and Beverage Protective Cultures the Most?

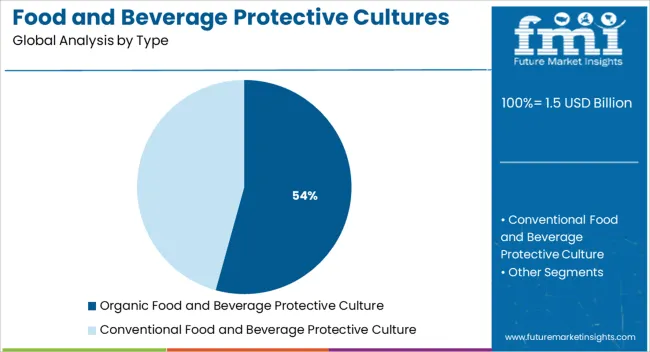
According to Future Market Insights, during the assessment period 2022-2032, protective cultures for organic foods and beverages will gain a maximum share of the global market. Considering the rapid development of clean label food products, the demand for vegan food and beverage products in the food and beverage industry is expected to have a positive impact on the global market.

Increasing allergies and serious health issues associated with chemical cultures used in labs have further increased the market demand for organic protective cultures. A recent trend in the dairy industry has been focusing more on 'clean label' foods because of the growing demand for natural dairy food products.

As a way to extend the shelf life of dairy products, dairy producers historically used artificial additives and preservatives. Millennials and families with children are concerned about the risks posed by artificial ingredients, which have led them to scrutinize the use of these ingredients. All these factors to propel the growth for organic cultures in the market.

How has Cheese Impacted the Market for Food and Beverage Protective Cultures?

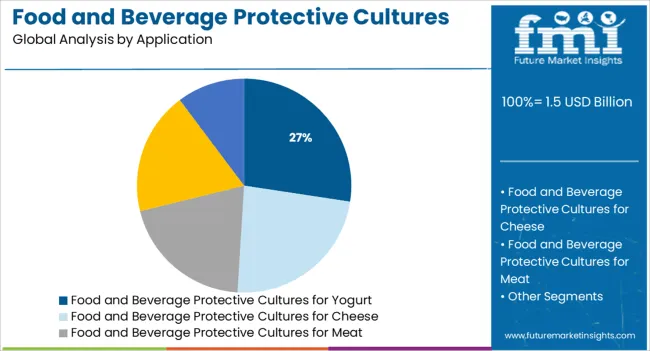
As cheese becomes a staple ingredient in various junk foods and beverages, it is expected to account for the largest share in the market in 2022. Food manufacturers are expected to invest significantly in cheese market as it is predicted to grow at a CAGR of 4% in the global market.

Shelf life remains a key consideration for consumers when making purchases of cheese in the market. Hence, manufacturers of cheese products are encouraged to consider the product's open shelf life in order to support a more sustainable supply chain in the future. With more on-the-go customers and ready-to-eat meals, the protective cultures in the food and beverage industry will be driven in the market.

With an improved shelf life, waste will be reduced, which contributes to a more sustainable world, and this allows producers to expand geographically and increase their revenues in the market. As a result, cheese protective cultures will continue to be in demand in the market.

Get the data you need at a Fraction of the cost

Personalize your report by choosing insights you need
and save 40%!

The Start-Up Ecosystem

How are Food and Beverage Industries Transforming Protective Culture Global Market Dynamics?

Numerous start-ups offering food and beverage protective cultures are making headlines due to the popularity of clean label packaging solutions in the market. The start-up companies also offer a range of products, services, and distribution that include food and beverage protective cultures.

Due to the increasing use of artificial alternatives to package numerous products, most protective cultures are deployed across the food and beverage industries.
  • PK Chem Industries Ltd., established in 2004 in Canada, is a leading supplier of chemicals to a wide range of industries, including food, cosmetics, pharmaceuticals, agriculture, and many others. In addition to the said offering, the company also offers variety of sweet flavours to cater customer neesd.
  • Meat Cracks Technologies GmbH., a developer, producer and seller of protective cultures, aromatic spices and functional additives in the food industry, is located in Germany, and was established in 2001. Apart from offering preservative supplies, it also focuses on development of customized products for fish and veggie, fruits and vegetables and dairy products.

Market Competition

A number of global and local competitors compete in the global food and beverage protective cultures market. Companies use a variety of marketing methods to market themselves, including mergers and acquisitions, expansions, collaborations, and partnerships.

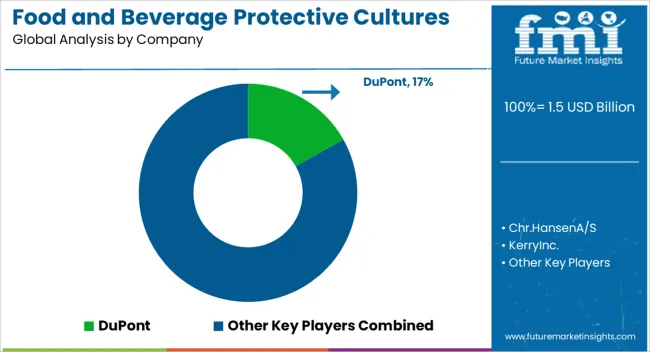
Some of the key participants present in the global food and beverage protective cultures market include Competition Deep Dive, Chr.Hansen A/S, Dupont, Sacco Srl, Prayon S.A., Kerry Inc., DSM N.V., Dalton Biotechnologie S.r.l., OCP Group, PK Chem Industries Ltd., BIOPROX INGREDIENTS, and Meat Cracks Technologie GmbH.

  • In October 2021, Döhler and Sacco System announced their alliance in the categories of plant-based dairy alternatives and food cultures. As part of the partnership, dairy-free yogurts will be formulated first, followed by drinks, cheeses, and spreads. Both companies are cooperating to map possible solutions and identify flavor combinations. Additionally, both companies will collaborate on novel taste and texture developments.
  • In March 2022, DSM extended its Delvo® Guard bio-protective cultures to combat food waste amongst yogurt manufacturers to extend shelf life naturally while preserving taste and texture. By utilizing the new cultures, dairy products can be improved in terms of quality and safety, since they contain naturally occurring dairy microflora. As well as improving creaminess and mouthfeel while extending shelf life, the new culture range gives dairy manufacturers better control over the processing of post-acidification, gas generation, and coloration of products.
  • In May 2022, Chr. Hansen A/S introduced new VEGA Boost Cultures, enabling dairy-free cream cheese to be developed. Chr. Hansen has developed a dairy-free fava bean cream cheese that offers sensational taste, good nutrition, sustainability, affordability, and can be allergen-free, using a range of cultures for plant-based dairy alternatives.

Report Scope

Report Attribute Details
Growth Rate CAGR of 4.3% from 2022-2032
Market Value in 2022 US$ 1,300 Million
Market Value in 2032 US$ 1,980.6 Million
Base Year for Estimation 2021
Historical Data 2016-2021
Forecast Period 2022-2032
Quantitative Units Revenue in US$ Million and CAGR from 2022-2032
Report Coverage Revenue Forecast, Company Ranking, Competitive Landscape, Growth Factors, Trends and Pricing Analysis
Segments Covered
  • Type
  • Application
  • Region
Regions Covered
  • North America
  • Latin America
  • Europe
  • Asia Pacific
  • Middle East and Africa
Key Countries Profiled
  • USA
  • Canada
  • Brazil
  • Mexico
  • Germany
  • UK
  • France
  • Spain
  • Italy
  • China
  • Japan
  • South Korea
  • Malaysia
  • Singapore
  • Australia
  • New Zealand
  • GCC
  • South Africa
  • Israel
Key Companies Profiled
  • Chr. Hansen A/S
  • DuPont
  • Sacco s.r.l
  • Prayon S.A
  • Kerry Inc.
  • DSM N.V
  • Dalton Biotechnologie S.r.l
  • OCP Group
  • BIOPROX INGREDIENTS
  • Meat Cracks Technologie GmbH
  • PK Chem Industries Ltd.
Report Customization & Pricing Available upon Request

Key Segments Profiled In The Food And Beverage Protective Cultures Survey

Food and Beverage Protective Cultures Market by Type:

  • Organic Food and Beverage Protective Culture
  • Conventional Food and Beverage Protective Culture

Food and Beverage Protective Cultures Market by Application:

  • Food and Beverage Protective Cultures for Yogurt
  • Food and Beverage Protective Cultures for Cheese
  • Food and Beverage Protective Cultures for Meat
  • Food and Beverage Protective Cultures for Seafood
  • Food and Beverage Protective Cultures for Other Applications

Food and Beverage Protective Cultures Market by Region:

  • North America Food and Beverage Protective Cultures Market
  • Latin America Food and Beverage Protective Cultures Market
  • Europe Food and Beverage Protective Cultures Market
  • Asia Pacific Food and Beverage Protective Cultures Market
  • Middle East and Africa Food and Beverage Protective Cultures Market

Frequently Asked Questions

What is the anticipated growth of the food and beverage protective cultures market until 2032?

FMI projects the global food and beverage protective cultures market to expand at a 4.3% value CAGR by 2032.

Which region is forecast to be the most lucrative for food and beverage protective cultures market growth?

North America is expected to be the most opportunistic flue gas desulfurization system market, accumulating 33% revenue in 2022

Which are some prominent flocculant and coagulant manufacturers?

Chr.Hansen A/S, Dupont, Sacco Srl, Prayon S.A., Kerry Inc., DSM N.V., Dalton Biotechnologie S.r.l., OCP Group, BIOPROX INGREDIENTS, Meat Cracks Technologie GmbH, and Others.

Table of Content

1. Executive Summary

    1.1. Global Market Outlook

    1.2. Demand-side Trends

    1.3. Supply-side Trends

    1.4. Technology Roadmap Analysis

    1.5. Analysis and Recommendations

2. Market Overview

    2.1. Market Coverage / Taxonomy

    2.2. Market Definition / Scope / Limitations

3. Market Background

    3.1. Market Dynamics

        3.1.1. Drivers

        3.1.2. Restraints

        3.1.3. Opportunity

        3.1.4. Trends

    3.2. Scenario Forecast

        3.2.1. Demand in Optimistic Scenario

        3.2.2. Demand in Likely Scenario

        3.2.3. Demand in Conservative Scenario

    3.3. Opportunity Map Analysis

    3.4. Product Life Cycle Analysis

    3.5. Supply Chain Analysis

        3.5.1. Supply Side Participants and their Roles

            3.5.1.1. Producers

            3.5.1.2. Mid-Level Participants (Traders/ Agents/ Brokers)

            3.5.1.3. Wholesalers and Distributors

        3.5.2. Value Added and Value Created at Node in the Supply Chain

        3.5.3. List of Raw Material Suppliers

        3.5.4. List of Existing and Potential Buyer’s

    3.6. Investment Feasibility Matrix

    3.7. Value Chain Analysis

        3.7.1. Profit Margin Analysis

        3.7.2. Wholesalers and Distributors

        3.7.3. Retailers

    3.8. PESTLE and Porter’s Analysis

    3.9. Regulatory Landscape

        3.9.1. By Key Regions

        3.9.2. By Key Countries

    3.10. Regional Parent Market Outlook

    3.11. Production and Consumption Statistics

    3.12. Import and Export Statistics

4. Global Food and Beverage Protective Cultures Market Analysis 2016-2021 and Forecast, 2022-2032

    4.1. Historical Market Size Value (US$ Mn) & Volume (Kg) Analysis, 2016-2021

    4.2. Current and Future Market Size Value (US$ Mn) & Volume (Kg) Projections, 2022-2032

        4.2.1. Y-o-Y Growth Trend Analysis

        4.2.2. Absolute $ Opportunity Analysis

5. Global Food and Beverage Protective Cultures Market Analysis 2016-2021 and Forecast 2022-2032, By Type

    5.1. Introduction / Key Findings

    5.2. Historical Market Size Value (US$ Mn) & Volume (Kg) Analysis By Type, 2016-2021

    5.3. Current and Future Market Size Value (US$ Mn) & Volume (Kg) Analysis and Forecast By Type, 2022-2032

        5.3.1. Organic Food and Beverage Protective Culture

        5.3.2. Conventional Food and Beverage Protective Culture

    5.4. Y-o-Y Growth Trend Analysis By Type, 2016-2021

    5.5. Absolute $ Opportunity Analysis By Type, 2022-2032

6. Global Food and Beverage Protective Cultures Market Analysis 2016-2021 and Forecast 2022-2032, By Application

    6.1. Introduction / Key Findings

    6.2. Historical Market Size Value (US$ Mn) & Volume (Kg) Analysis By Application, 2016-2021

    6.3. Current and Future Market Size Value (US$ Mn) & Volume (Kg) Analysis and Forecast By Application, 2022-2032

        6.3.1. Food and Beverage Protective Culture for Yogurt

        6.3.2. Food and Beverage Protective Culture for Cheese

        6.3.3. Food and Beverage Protective Culture for Meat

        6.3.4. Food and Beverage Protective Culture for Seafood

        6.3.5. Food and Beverage Protective Culture for Others

    6.4. Y-o-Y Growth Trend Analysis By Application, 2016-2021

    6.5. Absolute $ Opportunity Analysis By Application, 2022-2032

7. Global Food and Beverage Protective Cultures Market Analysis 2016-2021 and Forecast 2022-2032, By Region

    7.1. Introduction

    7.2. Historical Market Size Value (US$ Mn) & Volume (Kg) Analysis By Region, 2016-2021

    7.3. Current Market Size Value (US$ Mn) & Volume (Kg) Analysis and Forecast By Region, 2022-2032

        7.3.1. North America

        7.3.2. Latin America

        7.3.3. Europe

        7.3.4. Asia Pacific

        7.3.5. MEA

    7.4. Market Attractiveness Analysis By Region

8. North America Food and Beverage Protective Cultures Market Analysis 2016-2021 and Forecast 2022-2032, By Country

    8.1. Historical Market Size Value (US$ Mn) & Volume (Kg) Trend Analysis By Market Taxonomy, 2016-2021

    8.2. Market Size Value (US$ Mn) & Volume (Kg) Forecast By Market Taxonomy, 2022-2032

        8.2.1. By Country

            8.2.1.1. U.S.

            8.2.1.2. Canada

        8.2.2. By Type

        8.2.3. By Application

    8.3. Market Attractiveness Analysis

        8.3.1. By Country

        8.3.2. By Type

        8.3.3. By Application

    8.4. Key Takeaways

9. Latin America Food and Beverage Protective Cultures Market Analysis 2016-2021 and Forecast 2022-2032, By Country

    9.1. Historical Market Size Value (US$ Mn) & Volume (Kg) Trend Analysis By Market Taxonomy, 2016-2021

    9.2. Market Size Value (US$ Mn) & Volume (Kg) Forecast By Market Taxonomy, 2022-2032

        9.2.1. By Country

            9.2.1.1. Brazil

            9.2.1.2. Mexico

            9.2.1.3. Rest of Latin America

        9.2.2. By Type

        9.2.3. By Application

    9.3. Market Attractiveness Analysis

        9.3.1. By Country

        9.3.2. By Type

        9.3.3. By Application

    9.4. Key Takeaways

10. Europe Food and Beverage Protective Cultures Market Analysis 2016-2021 and Forecast 2022-2032, By Country

    10.1. Historical Market Size Value (US$ Mn) & Volume (Kg) Trend Analysis By Market Taxonomy, 2016-2021

    10.2. Market Size Value (US$ Mn) & Volume (Kg) Forecast By Market Taxonomy, 2022-2032

        10.2.1. By Country

            10.2.1.1. Germany

            10.2.1.2. U.K.

            10.2.1.3. France

            10.2.1.4. Spain

            10.2.1.5. Italy

            10.2.1.6. Rest of Europe

        10.2.2. By Type

        10.2.3. By Application

    10.3. Market Attractiveness Analysis

        10.3.1. By Country

        10.3.2. By Type

        10.3.3. By Application

    10.4. Key Takeaways

11. Asia Pacific Food and Beverage Protective Cultures Market Analysis 2016-2021 and Forecast 2022-2032, By Country

    11.1. Historical Market Size Value (US$ Mn) & Volume (Kg) Trend Analysis By Market Taxonomy, 2016-2021

    11.2. Market Size Value (US$ Mn) & Volume (Kg) Forecast By Market Taxonomy, 2022-2032

        11.2.1. By Country

            11.2.1.1. China

            11.2.1.2. Japan

            11.2.1.3. South Korea

            11.2.1.4. Malaysia

            11.2.1.5. Singapore

            11.2.1.6. Australia

            11.2.1.7. New Zealand

            11.2.1.8. Rest of APAC

        11.2.2. By Type

        11.2.3. By Application

    11.3. Market Attractiveness Analysis

        11.3.1. By Country

        11.3.2. By Type

        11.3.3. By Application

    11.4. Key Takeaways

12. MEA Food and Beverage Protective Cultures Market Analysis 2016-2021 and Forecast 2022-2032, By Country

    12.1. Historical Market Size Value (US$ Mn) & Volume (Kg) Trend Analysis By Market Taxonomy, 2016-2021

    12.2. Market Size Value (US$ Mn) & Volume (Kg) Forecast By Market Taxonomy, 2022-2032

        12.2.1. By Country

            12.2.1.1. GCC Countries

            12.2.1.2. South Africa

            12.2.1.3. Israel

            12.2.1.4. Rest of MEA

        12.2.2. By Type

        12.2.3. By Application

    12.3. Market Attractiveness Analysis

        12.3.1. By Country

        12.3.2. By Type

        12.3.3. By Application

    12.4. Key Takeaways

13. Key Countries Food and Beverage Protective Cultures Market Analysis

    13.1. U.S.

        13.1.1. Pricing Analysis

        13.1.2. Market Share Analysis, 2021

            13.1.2.1. By Type

            13.1.2.2. By Application

    13.2. Canada

        13.2.1. Pricing Analysis

        13.2.2. Market Share Analysis, 2021

            13.2.2.1. By Type

            13.2.2.2. By Application

    13.3. Brazil

        13.3.1. Pricing Analysis

        13.3.2. Market Share Analysis, 2021

            13.3.2.1. By Type

            13.3.2.2. By Application

    13.4. Mexico

        13.4.1. Pricing Analysis

        13.4.2. Market Share Analysis, 2021

            13.4.2.1. By Type

            13.4.2.2. By Application

    13.5. Germany

        13.5.1. Pricing Analysis

        13.5.2. Market Share Analysis, 2021

            13.5.2.1. By Type

            13.5.2.2. By Application

    13.6. U.K.

        13.6.1. Pricing Analysis

        13.6.2. Market Share Analysis, 2021

            13.6.2.1. By Type

            13.6.2.2. By Application

    13.7. France

        13.7.1. Pricing Analysis

        13.7.2. Market Share Analysis, 2021

            13.7.2.1. By Type

            13.7.2.2. By Application

    13.8. Spain

        13.8.1. Pricing Analysis

        13.8.2. Market Share Analysis, 2021

            13.8.2.1. By Type

            13.8.2.2. By Application

    13.9. Italy

        13.9.1. Pricing Analysis

        13.9.2. Market Share Analysis, 2021

            13.9.2.1. By Type

            13.9.2.2. By Application

    13.10. China

        13.10.1. Pricing Analysis

        13.10.2. Market Share Analysis, 2021

            13.10.2.1. By Type

            13.10.2.2. By Application

    13.11. Japan

        13.11.1. Pricing Analysis

        13.11.2. Market Share Analysis, 2021

            13.11.2.1. By Type

            13.11.2.2. By Application

    13.12. South Korea

        13.12.1. Pricing Analysis

        13.12.2. Market Share Analysis, 2021

            13.12.2.1. By Type

            13.12.2.2. By Application

    13.13. Malaysia

        13.13.1. Pricing Analysis

        13.13.2. Market Share Analysis, 2021

            13.13.2.1. By Type

            13.13.2.2. By Application

    13.14. Singapore

        13.14.1. Pricing Analysis

        13.14.2. Market Share Analysis, 2021

            13.14.2.1. By Type

            13.14.2.2. By Application

    13.15. Australia

        13.15.1. Pricing Analysis

        13.15.2. Market Share Analysis, 2021

            13.15.2.1. By Type

            13.15.2.2. By Application

    13.16. New Zealand

        13.16.1. Pricing Analysis

        13.16.2. Market Share Analysis, 2021

            13.16.2.1. By Type

            13.16.2.2. By Application

    13.17. GCC Countries

        13.17.1. Pricing Analysis

        13.17.2. Market Share Analysis, 2021

            13.17.2.1. By Type

            13.17.2.2. By Application

    13.18. South Africa

        13.18.1. Pricing Analysis

        13.18.2. Market Share Analysis, 2021

            13.18.2.1. By Type

            13.18.2.2. By Application

    13.19. Israel

        13.19.1. Pricing Analysis

        13.19.2. Market Share Analysis, 2021

            13.19.2.1. By Type

            13.19.2.2. By Application

14. Market Structure Analysis

    14.1. Competition Dashboard

    14.2. Competition Benchmarking

    14.3. Market Share Analysis of Top Players

        14.3.1. By Regional

        14.3.2. By Type

        14.3.3. By Application

15. Competition Analysis

    15.1. Competition Deep Dive

        15.1.1. Chr. Hansen A/S

            15.1.1.1. Overview

            15.1.1.2. Product Portfolio

            15.1.1.3. Profitability by Market Segments

            15.1.1.4. Sales Footprint

            15.1.1.5. Strategy Overview

                15.1.1.5.1. Marketing Strategy

                15.1.1.5.2. Product Strategy

                15.1.1.5.3. Channel Strategy

        15.1.2. DuPont

            15.1.2.1. Overview

            15.1.2.2. Product Portfolio

            15.1.2.3. Profitability by Market Segments

            15.1.2.4. Sales Footprint

            15.1.2.5. Strategy Overview

                15.1.2.5.1. Marketing Strategy

                15.1.2.5.2. Product Strategy

                15.1.2.5.3. Channel Strategy

        15.1.3. Sacco S.r.l

            15.1.3.1. Overview

            15.1.3.2. Product Portfolio

            15.1.3.3. Profitability by Market Segments

            15.1.3.4. Sales Footprint

            15.1.3.5. Strategy Overview

                15.1.3.5.1. Marketing Strategy

                15.1.3.5.2. Product Strategy

                15.1.3.5.3. Channel Strategy

        15.1.4. Prayon S.A.

            15.1.4.1. Overview

            15.1.4.2. Product Portfolio

            15.1.4.3. Profitability by Market Segments

            15.1.4.4. Sales Footprint

            15.1.4.5. Strategy Overview

                15.1.4.5.1. Marketing Strategy

                15.1.4.5.2. Product Strategy

                15.1.4.5.3. Channel Strategy

        15.1.5. Kerry Inc.

            15.1.5.1. Overview

            15.1.5.2. Product Portfolio

            15.1.5.3. Profitability by Market Segments

            15.1.5.4. Sales Footprint

            15.1.5.5. Strategy Overview

                15.1.5.5.1. Marketing Strategy

                15.1.5.5.2. Product Strategy

                15.1.5.5.3. Channel Strategy

        15.1.6. DSM N.V.

            15.1.6.1. Overview

            15.1.6.2. Product Portfolio

            15.1.6.3. Profitability by Market Segments

            15.1.6.4. Sales Footprint

            15.1.6.5. Strategy Overview

                15.1.6.5.1. Marketing Strategy

                15.1.6.5.2. Product Strategy

                15.1.6.5.3. Channel Strategy

        15.1.7. Dalton Biotecnologie S.r.l.

            15.1.7.1. Overview

            15.1.7.2. Product Portfolio

            15.1.7.3. Profitability by Market Segments

            15.1.7.4. Sales Footprint

            15.1.7.5. Strategy Overview

                15.1.7.5.1. Marketing Strategy

                15.1.7.5.2. Product Strategy

                15.1.7.5.3. Channel Strategy

        15.1.8. OCP Group

            15.1.8.1. Overview

            15.1.8.2. Product Portfolio

            15.1.8.3. Profitability by Market Segments

            15.1.8.4. Sales Footprint

            15.1.8.5. Strategy Overview

                15.1.8.5.1. Marketing Strategy

                15.1.8.5.2. Product Strategy

                15.1.8.5.3. Channel Strategy

        15.1.9. BIOPROX INGREDIENTS

            15.1.9.1. Overview

            15.1.9.2. Product Portfolio

            15.1.9.3. Profitability by Market Segments

            15.1.9.4. Sales Footprint

            15.1.9.5. Strategy Overview

                15.1.9.5.1. Marketing Strategy

                15.1.9.5.2. Product Strategy

                15.1.9.5.3. Channel Strategy

        15.1.10. Meat Cracks Technologie GmbH

            15.1.10.1. Overview

            15.1.10.2. Product Portfolio

            15.1.10.3. Profitability by Market Segments

            15.1.10.4. Sales Footprint

            15.1.10.5. Strategy Overview

                15.1.10.5.1. Marketing Strategy

                15.1.10.5.2. Product Strategy

                15.1.10.5.3. Channel Strategy

        15.1.11. PK Chem Industries Ltd

            15.1.11.1. Overview

            15.1.11.2. Product Portfolio

            15.1.11.3. Profitability by Market Segments

            15.1.11.4. Sales Footprint

            15.1.11.5. Strategy Overview

                15.1.11.5.1. Marketing Strategy

                15.1.11.5.2. Product Strategy

                15.1.11.5.3. Channel Strategy

List of Tables

Table 01: Global Food and Beverage Protective Cultures Market Value (US$ Mn) Forecast by Region, 2016-2032

Table 02: Global Food and Beverage Protective Cultures Market Volume (Kg) Forecast by Region, 2016-2032

Table 03: Global Food and Beverage Protective Cultures Market Value (US$ Mn) Forecast by Type, 2016-2032

Table 04: Global Food and Beverage Protective Cultures Market Volume (Kg) Forecast by Type, 2016-2032

Table 05: Global Food and Beverage Protective Cultures Market Value (US$ Mn) Forecast by Application, 2016-2032

Table 06: Global Food and Beverage Protective Cultures Market Volume (Kg) Forecast by Application, 2016-2032

Table 07: North America Food and Beverage Protective Cultures Market Value (US$ Mn) Forecast by Country, 2016-2032

Table 08: North America Food and Beverage Protective Cultures Market Volume (Kg) Forecast by Country, 2016-2032

Table 09: North America Food and Beverage Protective Cultures Market Value (US$ Mn) Forecast by Type, 2016-2032

Table 10: North America Food and Beverage Protective Cultures Market Volume (Kg) Forecast by Type, 2016-2032

Table 11: North America Food and Beverage Protective Cultures Market Value (US$ Mn) Forecast by Application, 2016-2032

Table 12: North America Food and Beverage Protective Cultures Market Volume (Kg) Forecast by Application, 2016-2032

Table 13: Latin America Food and Beverage Protective Cultures Market Value (US$ Mn) Forecast by Country, 2016-2032

Table 14: Latin America Food and Beverage Protective Cultures Market Volume (Kg) Forecast by Country, 2016-2032

Table 15: Latin America Food and Beverage Protective Cultures Market Value (US$ Mn) Forecast by Type, 2016-2032

Table 16: Latin America Food and Beverage Protective Cultures Market Volume (Kg) Forecast by Type, 2016-2032

Table 17: Latin America Food and Beverage Protective Cultures Market Value (US$ Mn) Forecast by Application, 2016-2032

Table 18: Latin America Food and Beverage Protective Cultures Market Volume (Kg) Forecast by Application, 2016-2032

Table 19: Europe Food and Beverage Protective Cultures Market Value (US$ Mn) Forecast by Country, 2016-2032

Table 20: Europe Food and Beverage Protective Cultures Market Volume (Kg) Forecast by Country, 2016-2032

Table 21: Europe Food and Beverage Protective Cultures Market Value (US$ Mn) Forecast by Type, 2016-2032

Table 22: Europe Food and Beverage Protective Cultures Market Volume (Kg) Forecast by Type, 2016-2032

Table 23: Europe Food and Beverage Protective Cultures Market Value (US$ Mn) Forecast by Application, 2016-2032

Table 24: Europe Food and Beverage Protective Cultures Market Volume (Kg) Forecast by Application, 2016-2032

Table 25: Asia Pacific Food and Beverage Protective Cultures Market Value (US$ Mn) Forecast by Country, 2016-2032

Table 26: Asia Pacific Food and Beverage Protective Cultures Market Volume (Kg) Forecast by Country, 2016-2032

Table 27: Asia Pacific Food and Beverage Protective Cultures Market Value (US$ Mn) Forecast by Type, 2016-2032

Table 28: Asia Pacific Food and Beverage Protective Cultures Market Volume (Kg) Forecast by Type, 2016-2032

Table 29: Asia Pacific Food and Beverage Protective Cultures Market Value (US$ Mn) Forecast by Application, 2016-2032

Table 30: Asia Pacific Food and Beverage Protective Cultures Market Volume (Kg) Forecast by Application, 2016-2032

Table 31: MEA Food and Beverage Protective Cultures Market Value (US$ Mn) Forecast by Country, 2016-2032

Table 32: MEA Food and Beverage Protective Cultures Market Volume (Kg) Forecast by Country, 2016-2032

Table 33: MEA Food and Beverage Protective Cultures Market Value (US$ Mn) Forecast by Type, 2016-2032

Table 34: MEA Food and Beverage Protective Cultures Market Volume (Kg) Forecast by Type, 2016-2032

Table 35: MEA Food and Beverage Protective Cultures Market Value (US$ Mn) Forecast by Application, 2016-2032

Table 36: MEA Food and Beverage Protective Cultures Market Volume (Kg) Forecast by Application, 2016-2032

List of Charts

Figure 01: Global Food and Beverage Protective Cultures Market Value (US$ Mn) by Type, 2022-2032

Figure 02: Global Food and Beverage Protective Cultures Market Value (US$ Mn) by Application, 2022-2032

Figure 03: Global Food and Beverage Protective Cultures Market Value (US$ Mn) by Region, 2022-2032

Figure 04: Global Food and Beverage Protective Cultures Market Value (US$ Mn) Analysis by Region, 2016-2032

Figure 05: Global Food and Beverage Protective Cultures Market Volume (Kg) Analysis by Region, 2016-2032

Figure 06: Global Food and Beverage Protective Cultures Market Value Share (%) and BPS Analysis by Region, 2022-2032

Figure 07: Global Food and Beverage Protective Cultures Market Y-o-Y Growth (%) Projections by Region, 2022-2032

Figure 08: Global Food and Beverage Protective Cultures Market Value (US$ Mn) Analysis by Type, 2016-2032

Figure 09: Global Food and Beverage Protective Cultures Market Volume (Kg) Analysis by Type, 2016-2032

Figure 10: Global Food and Beverage Protective Cultures Market Value Share (%) and BPS Analysis by Type, 2022-2032

Figure 11: Global Food and Beverage Protective Cultures Market Y-o-Y Growth (%) Projections by Type, 2022-2032

Figure 12: Global Food and Beverage Protective Cultures Market Value (US$ Mn) Analysis by Application, 2016-2032

Figure 13: Global Food and Beverage Protective Cultures Market Volume (Kg) Analysis by Application, 2016-2032

Figure 14: Global Food and Beverage Protective Cultures Market Value Share (%) and BPS Analysis by Application, 2022-2032

Figure 15: Global Food and Beverage Protective Cultures Market Y-o-Y Growth (%) Projections by Application, 2022-2032

Figure 16: Global Food and Beverage Protective Cultures Market Attractiveness by Type, 2022-2032

Figure 17: Global Food and Beverage Protective Cultures Market Attractiveness by Application, 2022-2032

Figure 18: Global Food and Beverage Protective Cultures Market Attractiveness by Region, 2022-2032

Figure 19: North America Food and Beverage Protective Cultures Market Value (US$ Mn) by Type, 2022-2032

Figure 20: North America Food and Beverage Protective Cultures Market Value (US$ Mn) by Application, 2022-2032

Figure 21: North America Food and Beverage Protective Cultures Market Value (US$ Mn) by Country, 2022-2032

Figure 22: North America Food and Beverage Protective Cultures Market Value (US$ Mn) Analysis by Country, 2016-2032

Figure 23: North America Food and Beverage Protective Cultures Market Volume (Kg) Analysis by Country, 2016-2032

Figure 24: North America Food and Beverage Protective Cultures Market Value Share (%) and BPS Analysis by Country, 2022-2032

Figure 25: North America Food and Beverage Protective Cultures Market Y-o-Y Growth (%) Projections by Country, 2022-2032

Figure 26: North America Food and Beverage Protective Cultures Market Value (US$ Mn) Analysis by Type, 2016-2032

Figure 27: North America Food and Beverage Protective Cultures Market Volume (Kg) Analysis by Type, 2016-2032

Figure 28: North America Food and Beverage Protective Cultures Market Value Share (%) and BPS Analysis by Type, 2022-2032

Figure 29: North America Food and Beverage Protective Cultures Market Y-o-Y Growth (%) Projections by Type, 2022-2032

Figure 30: North America Food and Beverage Protective Cultures Market Value (US$ Mn) Analysis by Application, 2016-2032

Figure 31: North America Food and Beverage Protective Cultures Market Volume (Kg) Analysis by Application, 2016-2032

Figure 32: North America Food and Beverage Protective Cultures Market Value Share (%) and BPS Analysis by Application, 2022-2032

Figure 33: North America Food and Beverage Protective Cultures Market Y-o-Y Growth (%) Projections by Application, 2022-2032

Figure 34: North America Food and Beverage Protective Cultures Market Attractiveness by Type, 2022-2032

Figure 35: North America Food and Beverage Protective Cultures Market Attractiveness by Application, 2022-2032

Figure 36: North America Food and Beverage Protective Cultures Market Attractiveness by Country, 2022-2032

Figure 37: Latin America Food and Beverage Protective Cultures Market Value (US$ Mn) by Type, 2022-2032

Figure 38: Latin America Food and Beverage Protective Cultures Market Value (US$ Mn) by Application, 2022-2032

Figure 39: Latin America Food and Beverage Protective Cultures Market Value (US$ Mn) by Country, 2022-2032

Figure 40: Latin America Food and Beverage Protective Cultures Market Value (US$ Mn) Analysis by Country, 2016-2032

Figure 41: Latin America Food and Beverage Protective Cultures Market Volume (Kg) Analysis by Country, 2016-2032

Figure 42: Latin America Food and Beverage Protective Cultures Market Value Share (%) and BPS Analysis by Country, 2022-2032

Figure 43: Latin America Food and Beverage Protective Cultures Market Y-o-Y Growth (%) Projections by Country, 2022-2032

Figure 44: Latin America Food and Beverage Protective Cultures Market Value (US$ Mn) Analysis by Type, 2016-2032

Figure 45: Latin America Food and Beverage Protective Cultures Market Volume (Kg) Analysis by Type, 2016-2032

Figure 46: Latin America Food and Beverage Protective Cultures Market Value Share (%) and BPS Analysis by Type, 2022-2032

Figure 47: Latin America Food and Beverage Protective Cultures Market Y-o-Y Growth (%) Projections by Type, 2022-2032

Figure 48: Latin America Food and Beverage Protective Cultures Market Value (US$ Mn) Analysis by Application, 2016-2032

Figure 49: Latin America Food and Beverage Protective Cultures Market Volume (Kg) Analysis by Application, 2016-2032

Figure 50: Latin America Food and Beverage Protective Cultures Market Value Share (%) and BPS Analysis by Application, 2022-2032

Figure 51: Latin America Food and Beverage Protective Cultures Market Y-o-Y Growth (%) Projections by Application, 2022-2032

Figure 52: Latin America Food and Beverage Protective Cultures Market Attractiveness by Type, 2022-2032

Figure 53: Latin America Food and Beverage Protective Cultures Market Attractiveness by Application, 2022-2032

Figure 54: Latin America Food and Beverage Protective Cultures Market Attractiveness by Country, 2022-2032

Figure 55: Europe Food and Beverage Protective Cultures Market Value (US$ Mn) by Type, 2022-2032

Figure 56: Europe Food and Beverage Protective Cultures Market Value (US$ Mn) by Application, 2022-2032

Figure 57: Europe Food and Beverage Protective Cultures Market Value (US$ Mn) by Country, 2022-2032

Figure 58: Europe Food and Beverage Protective Cultures Market Value (US$ Mn) Analysis by Country, 2016-2032

Figure 59: Europe Food and Beverage Protective Cultures Market Volume (Kg) Analysis by Country, 2016-2032

Figure 60: Europe Food and Beverage Protective Cultures Market Value Share (%) and BPS Analysis by Country, 2022-2032

Figure 61: Europe Food and Beverage Protective Cultures Market Y-o-Y Growth (%) Projections by Country, 2022-2032

Figure 62: Europe Food and Beverage Protective Cultures Market Value (US$ Mn) Analysis by Type, 2016-2032

Figure 63: Europe Food and Beverage Protective Cultures Market Volume (Kg) Analysis by Type, 2016-2032

Figure 64: Europe Food and Beverage Protective Cultures Market Value Share (%) and BPS Analysis by Type, 2022-2032

Figure 65: Europe Food and Beverage Protective Cultures Market Y-o-Y Growth (%) Projections by Type, 2022-2032

Figure 66: Europe Food and Beverage Protective Cultures Market Value (US$ Mn) Analysis by Application, 2016-2032

Figure 67: Europe Food and Beverage Protective Cultures Market Volume (Kg) Analysis by Application, 2016-2032

Figure 68: Europe Food and Beverage Protective Cultures Market Value Share (%) and BPS Analysis by Application, 2022-2032

Figure 69: Europe Food and Beverage Protective Cultures Market Y-o-Y Growth (%) Projections by Application, 2022-2032

Figure 70: Europe Food and Beverage Protective Cultures Market Attractiveness by Type, 2022-2032

Figure 71: Europe Food and Beverage Protective Cultures Market Attractiveness by Application, 2022-2032

Figure 72: Europe Food and Beverage Protective Cultures Market Attractiveness by Country, 2022-2032

Figure 73: Asia Pacific Food and Beverage Protective Cultures Market Value (US$ Mn) by Type, 2022-2032

Figure 74: Asia Pacific Food and Beverage Protective Cultures Market Value (US$ Mn) by Application, 2022-2032

Figure 75: Asia Pacific Food and Beverage Protective Cultures Market Value (US$ Mn) by Country, 2022-2032

Figure 76: Asia Pacific Food and Beverage Protective Cultures Market Value (US$ Mn) Analysis by Country, 2016-2032

Figure 77: Asia Pacific Food and Beverage Protective Cultures Market Volume (Kg) Analysis by Country, 2016-2032

Figure 78: Asia Pacific Food and Beverage Protective Cultures Market Value Share (%) and BPS Analysis by Country, 2022-2032

Figure 79: Asia Pacific Food and Beverage Protective Cultures Market Y-o-Y Growth (%) Projections by Country, 2022-2032

Figure 80: Asia Pacific Food and Beverage Protective Cultures Market Value (US$ Mn) Analysis by Type, 2016-2032

Figure 81: Asia Pacific Food and Beverage Protective Cultures Market Volume (Kg) Analysis by Type, 2016-2032

Figure 82: Asia Pacific Food and Beverage Protective Cultures Market Value Share (%) and BPS Analysis by Type, 2022-2032

Figure 83: Asia Pacific Food and Beverage Protective Cultures Market Y-o-Y Growth (%) Projections by Type, 2022-2032

Figure 84: Asia Pacific Food and Beverage Protective Cultures Market Value (US$ Mn) Analysis by Application, 2016-2032

Figure 85: Asia Pacific Food and Beverage Protective Cultures Market Volume (Kg) Analysis by Application, 2016-2032

Figure 86: Asia Pacific Food and Beverage Protective Cultures Market Value Share (%) and BPS Analysis by Application, 2022-2032

Figure 87: Asia Pacific Food and Beverage Protective Cultures Market Y-o-Y Growth (%) Projections by Application, 2022-2032

Figure 88: Asia Pacific Food and Beverage Protective Cultures Market Attractiveness by Type, 2022-2032

Figure 89: Asia Pacific Food and Beverage Protective Cultures Market Attractiveness by Application, 2022-2032

Figure 90: Asia Pacific Food and Beverage Protective Cultures Market Attractiveness by Country, 2022-2032

Figure 91: MEA Food and Beverage Protective Cultures Market Value (US$ Mn) by Type, 2022-2032

Figure 92: MEA Food and Beverage Protective Cultures Market Value (US$ Mn) by Application, 2022-2032

Figure 93: MEA Food and Beverage Protective Cultures Market Value (US$ Mn) by Country, 2022-2032

Figure 94: MEA Food and Beverage Protective Cultures Market Value (US$ Mn) Analysis by Country, 2016-2032

Figure 95: MEA Food and Beverage Protective Cultures Market Volume (Kg) Analysis by Country, 2016-2032

Figure 96: MEA Food and Beverage Protective Cultures Market Value Share (%) and BPS Analysis by Country, 2022-2032

Figure 97: MEA Food and Beverage Protective Cultures Market Y-o-Y Growth (%) Projections by Country, 2022-2032

Figure 98: MEA Food and Beverage Protective Cultures Market Value (US$ Mn) Analysis by Type, 2016-2032

Figure 99: MEA Food and Beverage Protective Cultures Market Volume (Kg) Analysis by Type, 2016-2032

Figure 100: MEA Food and Beverage Protective Cultures Market Value Share (%) and BPS Analysis by Type, 2022-2032

Figure 101: MEA Food and Beverage Protective Cultures Market Y-o-Y Growth (%) Projections by Type, 2022-2032

Figure 102: MEA Food and Beverage Protective Cultures Market Value (US$ Mn) Analysis by Application, 2016-2032

Figure 103: MEA Food and Beverage Protective Cultures Market Volume (Kg) Analysis by Application, 2016-2032

Figure 104: MEA Food and Beverage Protective Cultures Market Value Share (%) and BPS Analysis by Application, 2022-2032

Figure 105: MEA Food and Beverage Protective Cultures Market Y-o-Y Growth (%) Projections by Application, 2022-2032

Figure 106: MEA Food and Beverage Protective Cultures Market Attractiveness by Type, 2022-2032

Figure 107: MEA Food and Beverage Protective Cultures Market Attractiveness by Application, 2022-2032

Figure 108: MEA Food and Beverage Protective Cultures Market Attractiveness by Country, 2022-2032

Recommendations

Food and Beverage

Microbial Food Culture Market

Published : April 2024

Food and Beverage

Ripening Cultures Market

Published : May 2023

Food and Beverage

Specialty Cultures Market

Published : February 2023

Food and Beverage

Cultures Market

Published : June 2022

Explore Food and Beverage Insights

View Reports

Food and Beverage Protective Cultures Market