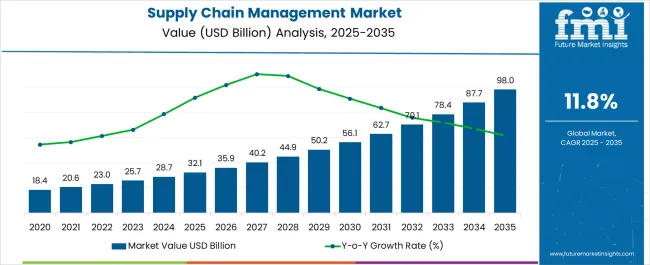
The Supply Chain Management Market is estimated to be valued at USD 32.1 billion in 2025 and is projected to reach USD 98.0 billion by 2035, registering a compound annual growth rate (CAGR) of 11.8% over the forecast period.
| Metric | Value |
|---|---|
| Supply Chain Management Market Estimated Value in (2025 E) | USD 32.1 billion |
| Supply Chain Management Market Forecast Value in (2035 F) | USD 98.0 billion |
| Forecast CAGR (2025 to 2035) | 11.8% |
The supply chain management market is experiencing substantial growth due to the increasing complexity of global trade, heightened demand for operational visibility, and the need for agility in managing disruptions. Organizations are prioritizing end to end transparency, predictive analytics, and real time collaboration tools to optimize efficiency and reduce costs.
Advances in artificial intelligence, machine learning, and blockchain are enhancing forecasting accuracy, inventory optimization, and shipment traceability. The shift toward digitized, resilient supply chains has been accelerated by recent global disruptions, compelling businesses to invest in technology driven solutions that enable faster decision making.
Additionally, regulatory compliance requirements and sustainability objectives are prompting integration of advanced SCM platforms across industries. The market outlook remains strong as enterprises continue to adopt scalable, data driven systems to improve competitiveness in a rapidly evolving business environment.
The market is segmented by Solution, Deployment, Enterprise Size, and Industry and region. By Solution, the market is divided into Integrated SCM Platform/Suite and Services. In terms of Deployment, the market is classified into Cloud-Based and On-Premises. Based on Enterprise Size, the market is segmented into Small and Medium Enterprises (SMEs) and Large Enterprises. By Industry, the market is divided into Retail & Consumer Goods, Manufacturing, Automotive, Healthcare & Pharma, Food & Beverages, Transportation & Logistics, and Others. Regionally, the market is classified into North America, Latin America, Western Europe, Eastern Europe, Balkan & Baltic Countries, Russia & Belarus, Central Asia, East Asia, South Asia & Pacific, and the Middle East & Africa.
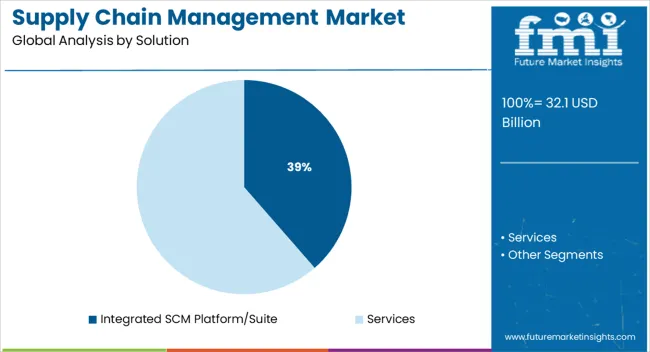
The integrated SCM platform or suite solution segment is projected to account for 38.60% of total revenue by 2025 within the solution category, making it the leading segment. Its dominance is driven by the ability to unify procurement, manufacturing, inventory, and logistics functions within a single framework, enabling seamless data flow and improved decision making.
Businesses are increasingly adopting integrated platforms to eliminate operational silos, enhance cross departmental collaboration, and support real time analytics. The scalability of such solutions and their compatibility with advanced technologies like IoT and predictive analytics have further strengthened adoption.
These capabilities have positioned integrated SCM suites as critical tools for enterprises aiming to streamline supply chain processes and boost efficiency.
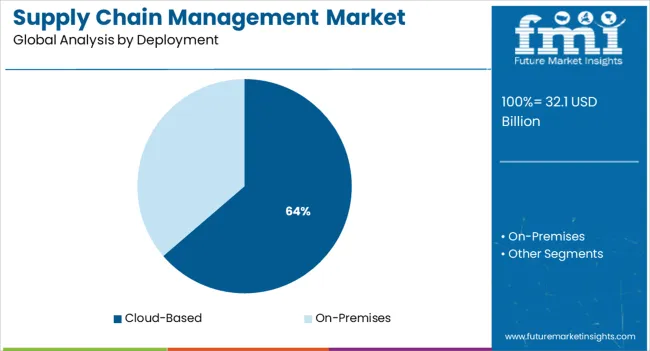
The cloud based deployment segment is expected to represent 63.70% of total market revenue by 2025, making it the dominant deployment model. Its growth is driven by the flexibility, scalability, and cost efficiency it offers compared to on premise systems.
Cloud platforms allow for rapid implementation, remote accessibility, and continuous updates without the need for extensive in house IT infrastructure. Enhanced data security measures and integration capabilities with existing enterprise systems have further bolstered trust and adoption.
The increasing trend toward remote work and distributed supply chain operations has accelerated the shift to cloud based solutions, solidifying their position as the preferred deployment method.
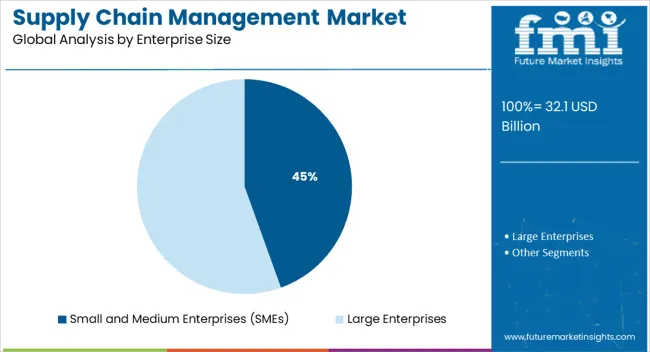
The small and medium enterprises segment is projected to hold 44.50% of total market revenue by 2025 under the enterprise size category, emerging as a key contributor to market growth. SMEs are increasingly investing in supply chain management solutions to improve competitiveness, reduce operational costs, and expand into global markets.
Cloud based and subscription pricing models have lowered the entry barriers for these businesses, enabling access to sophisticated tools previously affordable only to large enterprises. The agility of SMEs in adopting new technologies, combined with the pressing need to optimize resources and respond quickly to market changes, has driven strong adoption in this segment.
As SMEs continue to digitize operations, their demand for scalable and cost effective SCM solutions is expected to remain robust.
Increasing demand for supply chain management solutions from both large enterprises and small and medium enterprises (SMEs), and growing awareness about the benefits offered by SCM solutions, including supply chain optimization, forecasting accuracy, meaningful synthesis of business data, and wastage minimization are likely to fuel the demand for supply chain management solutions over the coming years.
The SCM sales are estimated to rise at 11.8% CAGR between 2025 and 2035 in comparison with the 8.9% CAGR registered from 2020 to 2025.
In the quest to remove supply channel costs, streamline channel communications, and link customers to the value-added resources found along the supply chain continuum, SCM has emerged as a tactical operations tool.
The supply chain management (SCM) market has undergone a sea change in the 21st century-by embedding product and process innovation in supply chain operations and consciously managing and shaping demand from customers. There is a lot of potential in benefitting from new-age supply chain management solutions as companies recover from the recent financial crisis and position supply chains as enablers of revenue and margin growth.
Moreover, procurement processes that support the design and management of a sustainable supply chain are becoming critical for providers of goods and services in nearly every part of the world. In the demand-driven supply chain, companies are looking toward more lean procurement processes.
The global supply chain management growth scenario is anticipated to witness an increase in revenue from ~USD 32.1 Billion in 2025 to ~USD 98 Billion by 2035.
| Historical CAGR (2020 to 2025) | 8.9% |
|---|---|
| Forecast CAGR (2025 to 2035) | 11.8% |
In the current scenario, the rise in demand for management solutions among enterprises and the adoption of SCM software in healthcare and pharmaceutical companies are expected to fuel market growth.
In addition to this, the surge in demand for transportation management systems (TMS) software and the integration of blockchain technology in SCM software is expected to drive the growth of the SCM market in the upcoming years. Advanced technologies such as the Internet of Things, Artificial Intelligence, robotics, and 5G, SCM solutions are designed to anticipate and meet future challenges.
Moreover, big data analytics in Logistics and Supply Chain Management (LSCM) has garnered increasing attention owing to its complexity and the prominent role of LSCM in enhancing overall business performance. The power of data is becoming evident to businesses of all shapes and sizes, from financial services to automobile manufacturing, healthcare, NGO, and more.
It is increasingly becoming essential to make the best use of Big Data analytics in a supply chain to generate more profound insights. The retail sector streams a massive amount of data across its supply chains, at diverse customer touchpoints in many omnichannel operations. This is, in turn, creating a huge demand for supply chain management software over the forecast period.
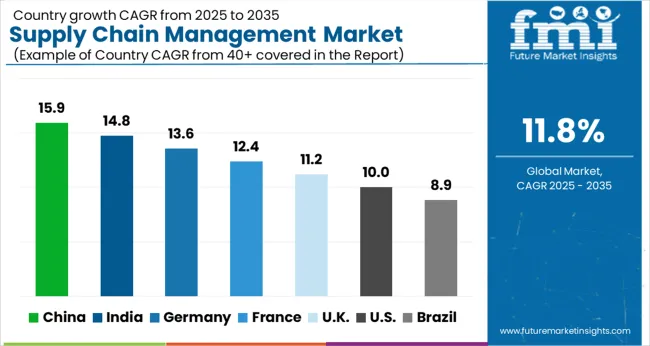
| Country | USA |
|---|---|
| CAGR (2025 to 2035) | 9.6% |
| Market Size (2035) | USD 16.6 Billion |
| Country | United Kingdom |
|---|---|
| CAGR (2025 to 2035) | 11.5% |
| Market Size (2035) | USD 3.5 Billion |
| Country | China |
|---|---|
| CAGR (2025 to 2035) | 11.8% |
| Market Size (2035) | USD 8 Billion |
| Country | Japan |
|---|---|
| CAGR (2025 to 2035) | 14.9% |
| Market Size (2035) | USD 98 Billion |
| Country | South Korea |
|---|---|
| CAGR (2025 to 2035) | 10.1% |
| Market Size (2035) | USD 2.2 Billion |
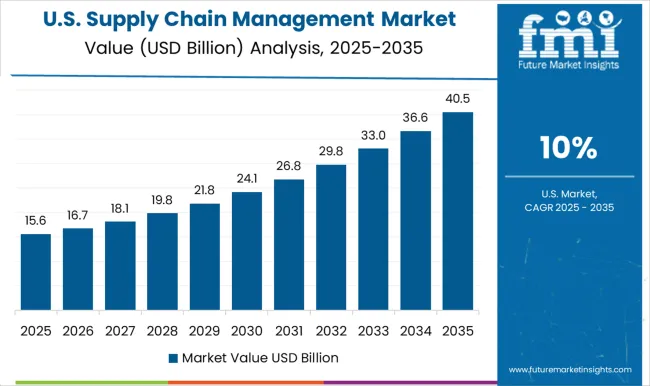
| Attributes | Details |
|---|---|
| Market Size (2035) | USD 16.6 Billion |
| Market Absolute Dollar Growth (USD Billion/Billion) | USD 10 Billion |
North America is predicted to remain one of the most attractive markets during the forecast period, according to Future Market Insights. According to the study, the USA is expected to account for more than 79% of the North American market share through 2035. By 2035 end, the supply chain management market is estimated to reach a market valuation of USD 16.6 Billion. The market is projected to grow at a CAGR of 9.6% in the forecast period.
This growth can be attributed to the rise in spending on logistics & transportation, which is boosting the automation of supply chain management in these industries. The transportation & logistics sector is huge as well as competitive in the USA and consists of distinct industries such as railroads, air services, and shipping.
Factors such as an increase in urbanization, rise in traffic congestion, and digital revolution in the transportation sector are raising the demand for transportation management systems. As a result, the supply chain management market is expanding in the USA
| Historical CAGR (2020 to 2025) | 7.1% |
|---|---|
| Forecast CAGR (2025 to 2035) | 9.6% |
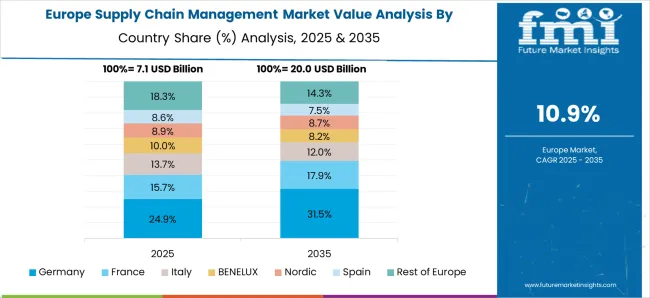
Demand for supply chain management platforms in Germany is expected to account for a revenue share of more than 22.2% by 2025 end. As Europe’s largest economy, Germany has a well-established industrial sector and is a dominant producer of chemicals, machinery, and automobiles.
The country also is recognized for its high-tech manufacturing potential and superior quality of products, due to considerable investments within educational, and research and development avenues.
Moreover, logistic distributors for Fast Moving Consumer Goods (FMCGs) are expanding their warehouse spaces to contain just-in-time deliveries. Investments in the technology industry are projected to have a substantial impact on logistics. Thus, several industrial developments and advancements in Germany are expected to favorably impact the country’s supply chain management market.
The demand in India is estimated to exhibit tremendous growth between 2025 and 2035. India’s supply chain and logistics sector are one of the largest globally. The sector has the potential to grow multifold. One of the biggest revelations of the pandemic for this sector is the urgent need to leverage disruptive technologies for greater resilience.
In 2025 and beyond, the supply chain management industry is expected to evolve in order to survive. New technology like cloud computing, Robotic Process Automation (RPA), and Artificial Intelligence (AI) is projected to replace the weaker link and transform the supply chain management market at large.
| Attributes | Details |
|---|---|
| Market Size (2035) | USD 98 Billion |
| Market Absolute Dollar Growth (USD Billion/Billion) | USD 5 Billion |
Demand for supply chain management solutions in Japan is estimated to account for a total sale of USD 98 Billion by the end of 2035. Japan is trying to improve its supply chain security while maintaining a positive economic engagement with China, as China is also a large market for Japanese firms.
Even before the coronavirus pandemic, Japanese companies had started shifting their production away from China due to the impacts of the USA-China trade war.
As a long-time world leader in manufacturing, the perspectives and actions of Japanese companies are heavily influenced by the need to source components and materials from lower-cost countries - long-time venues such as China, as well as emerging sources such as Brazil, Russia, and India.
| Historical CAGR (2020 to 2025) | 12.3% |
|---|---|
| Forecast CAGR (2025 to 2035) | 14.9% |
| Taxonomy | Solution |
|---|---|
| Top Segment | Software |
| Forecast CAGR | 12.8% |
| Taxonomy | Enterprise Size |
|---|---|
| Top Segment | Large Enterprises |
| Forecast CAGR | 11.6% |
Based on software, the integrated supply chain management platform/suite is expected to contribute nearly 54.1% of the overall share in 2024. A business facilitates relationships with all of its suppliers and manages all distribution and logistics activities through a centralized system rather than having multiple systems within the organization.
Concentrated professional expertise and cost efficiency are core benefits of the integrated supply chain process. This centralized approach leads to more streamlined and efficient activities, as well as the implementation of best industry practices in supply chain functions. Development of supplier relationships, acquisition of goods, storage, logistics, and transportation are among the primary activities managed in an integrated supply chain.
The cloud-based deployment segment is projected to register a high demand at a CAGR of more than 14.2% over the coming years. Cloud computing is quickly growing to support collaborative transportation management solutions and other aspects of transportation management, such as sourcing of network capacity, robust visibility and event management, and ancillary functions, including freight pay and audit.
Applying cloud-based business analytics and manufacturing intelligence allows manufacturing cycle times to improve, hence boosting supply chain management.
The large enterprise segment accounted for more than 59.7% of the overall market share in 2025 and is expected to continue its dominance during the forecast period. The growing demand for robust monitoring solutions and automation capabilities for resource allocation and strategic decision-making are key factors contributing to the segment’s growth.
Furthermore, a significant rise in the need for software in large businesses to assist in the collection of key business data such as inventory levels, projected sales numbers, supplier information, and others from diverse sources drives the growth of the market.
| Historical CAGR (2020 to 2025) | 8.4% |
|---|---|
| Forecast CAGR (2025 to 2035) | 11.6% |
The retail & consumer goods segment is expected to contribute towards more than 26.1% of sales in 2025 and is expected to maintain its dominance in the forthcoming years. This can be attributed to the surge in the complexity of retail supply chain networks over a period of time due to the presence of a large number of suppliers & logistics providers, channels, products, and value-added offerings.
The retail industry is being challenged with a sluggish economy, declining in-store sales, margins, and rising labor costs. Hence, most of the key players are adopting cloud-based supply chain management software to transform their supply chains with unprecedented visibility and insights from data.
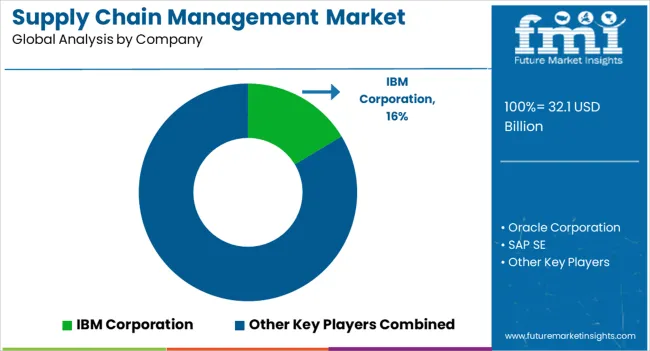
The supply chain management market (SCM) is highly concentrated and controlled by dominant players, like
These businesses are leveraging strategic collaborative initiatives to strengthen their market shares and enhance their profitability. However, with product innovations and technological advancements, midsize to smaller firms are growing their market presence by securing new contracts and tapping new markets.
| Attribute | Details |
|---|---|
| Forecast Period | 2025 to 2035 |
| Historical Data Available for | 2020 to 2025 |
| Market Analysis | USD Billion for Value |
| Key Regions Covered | North America; Latin America; Europe; East Asia; South Asia & Pacific; and the Middle East & Africa |
| Key Countries Covered | USA, Canada, Germany, United Kingdom, France, Italy, Spain, Russia, China, Japan, South Korea, India, ASEAN, Australia & New Zealand, GCC Countries, Turkey, and South Africa |
| Key Segments Covered | The solution, Deployment, Enterprise Size, Industry, and Region |
| Key Companies Profiled | IBM Corporation; Oracle Corporation; SAP SE; Manhattan Associates; Descartes Systems Group Inc.; Kinaxis; E2open, LLC; Basware Corporation; WiseTech Global; Infor; Blue Yonder Group, Inc. (JDA Software); Epicor Software Corporation; Logility, Inc.; Jaggaer; Ivalua Inc. |
| Report Coverage | Market Forecast, Company Share Analysis, Competition Intelligence, Drivers, Restraints, Opportunities and Threats Analysis, Market Dynamics and Challenges, and Strategic Growth Initiatives |
| Customization & Pricing | Available upon Request |
The global supply chain management market is estimated to be valued at USD 32.1 billion in 2025.
The market size for the supply chain management market is projected to reach USD 98.0 billion by 2035.
The supply chain management market is expected to grow at a 11.8% CAGR between 2025 and 2035.
The key product types in supply chain management market are integrated scm platform/suite, _supply chain planning, _warehouse management software, _transportation management software, _sourcing & procurement, _order management, _others standalone solutions, services, _outsource supply chain management services, _integration & implementation services, _support & maintenance services and _consulting services.
In terms of deployment, cloud-based segment to command 63.7% share in the supply chain management market in 2025.


Our Research Products

The "Full Research Suite" delivers actionable market intel, deep dives on markets or technologies, so clients act faster, cut risk, and unlock growth.

The Leaderboard benchmarks and ranks top vendors, classifying them as Established Leaders, Leading Challengers, or Disruptors & Challengers.

Locates where complements amplify value and substitutes erode it, forecasting net impact by horizon

We deliver granular, decision-grade intel: market sizing, 5-year forecasts, pricing, adoption, usage, revenue, and operational KPIs—plus competitor tracking, regulation, and value chains—across 60 countries broadly.

Spot the shifts before they hit your P&L. We track inflection points, adoption curves, pricing moves, and ecosystem plays to show where demand is heading, why it is changing, and what to do next across high-growth markets and disruptive tech

Real-time reads of user behavior. We track shifting priorities, perceptions of today’s and next-gen services, and provider experience, then pace how fast tech moves from trial to adoption, blending buyer, consumer, and channel inputs with social signals (#WhySwitch, #UX).

Partner with our analyst team to build a custom report designed around your business priorities. From analysing market trends to assessing competitors or crafting bespoke datasets, we tailor insights to your needs.
Supplier Intelligence
Discovery & Profiling
Capacity & Footprint
Performance & Risk
Compliance & Governance
Commercial Readiness
Who Supplies Whom
Scorecards & Shortlists
Playbooks & Docs
Category Intelligence
Definition & Scope
Demand & Use Cases
Cost Drivers
Market Structure
Supply Chain Map
Trade & Policy
Operating Norms
Deliverables
Buyer Intelligence
Account Basics
Spend & Scope
Procurement Model
Vendor Requirements
Terms & Policies
Entry Strategy
Pain Points & Triggers
Outputs
Pricing Analysis
Benchmarks
Trends
Should-Cost
Indexation
Landed Cost
Commercial Terms
Deliverables
Brand Analysis
Positioning & Value Prop
Share & Presence
Customer Evidence
Go-to-Market
Digital & Reputation
Compliance & Trust
KPIs & Gaps
Outputs
Full Research Suite comprises of:
Market outlook & trends analysis
Interviews & case studies
Strategic recommendations
Vendor profiles & capabilities analysis
5-year forecasts
8 regions and 60+ country-level data splits
Market segment data splits
12 months of continuous data updates
DELIVERED AS:
PDF EXCEL ONLINE
Supply Chain Management BPO Market Analysis 2025 to 2035 by Outsourcing Model, Application, Service Type, Enterprise Size & Region
Commodity Supply Chain Management Solution Market Size and Share Forecast Outlook 2025 to 2035
SBOM Management and Software Supply Chain Compliance Market Analysis - Size, Share, and Forecast Outlook 2025 to 2035
Supply Chain Analytics Market Size and Share Forecast Outlook 2025 to 2035
Supply Chain Visibility Software Market Size and Share Forecast Outlook 2025 to 2035
Power Supply Equipment for Data Center Market Size and Share Forecast Outlook 2025 to 2035
Power Supply Isolation Equipment Market Size and Share Forecast Outlook 2025 to 2035
Office Supply Market Forecast and Outlook 2025 to 2035
IoT in Supply Chain Market Insights – Trends, Growth & Forecast 2023-2033
Shipping Supply Market Size and Share Forecast Outlook 2025 to 2035
DC Power Supply Module Market – Powering IoT & Electronics
Packaging Supply Market Size and Share Forecast Outlook 2025 to 2035
Cognitive Supply Chain Market Forecast Outlook 2025 to 2035
Backside Power Supply Network (BSPDN) Technology Market Size and Share Forecast Outlook 2025 to 2035
Aviation Power Supply Market Size and Share Forecast Outlook 2025 to 2035
Industrial Power Supply Market Size and Share Forecast Outlook 2025 to 2035
Ammonium Sulphate Supply Market-Trends & Forecast 2025 to 2035
High Current Power Supply for Electrophoresis Market Size and Share Forecast Outlook 2025 to 2035
Shore to Ship Power Supply Market Size and Share Forecast Outlook 2025 to 2035
Switching Mode Power Supply Market - Growth & Forecast 2025 to 2035

Thank you!
You will receive an email from our Business Development Manager. Please be sure to check your SPAM/JUNK folder too.
Chat With
MaRIA