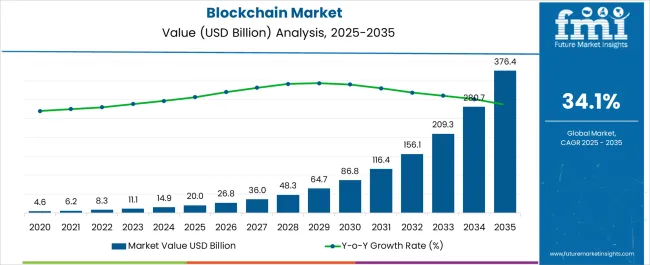
The Blockchain Market is estimated to be valued at USD 20.0 billion in 2025 and is projected to reach USD 376.4 billion by 2035, registering a compound annual growth rate (CAGR) of 34.1% over the forecast period.

| Metric | Value |
|---|---|
| Blockchain Market Estimated Value in (2025 E) | USD 20.0 billion |
| Blockchain Market Forecast Value in (2035 F) | USD 376.4 billion |
| Forecast CAGR (2025 to 2035) | 34.1% |
The blockchain market is experiencing accelerated growth, driven by enterprise adoption, infrastructure modernization, and regulatory advances supporting digital ledger technologies. The demand for tamper-proof, decentralized systems is strengthening across financial services, supply chains, healthcare, and public governance.
Organizations are leveraging blockchain for transparency, automation, and secure peer-to-peer transactions, aided by tokenization and smart contracts. Strategic investments by cloud hyperscalers, fintechs, and telecom providers have further expanded access to scalable blockchain platforms.
Increasing interest in cross-border settlements, identity management, and decentralized finance (DeFi) is propelling the market into a critical phase of institutional and public sector deployment. Regulatory frameworks focused on digital assets and data sovereignty are laying the groundwork for long-term infrastructure buildout and interoperability, fostering broader use across private and public sectors.
The market is segmented by Component, Provider, and Organizational Size and region. By Component, the market is divided into Platform and Service. In terms of Provider, the market is classified into Infrastructure, Application, and Middleware. Based on Organizational Size, the market is segmented into Large Enterprise and Small & Medium Sized Enterprise. Regionally, the market is classified into North America, Latin America, Western Europe, Eastern Europe, Balkan & Baltic Countries, Russia & Belarus, Central Asia, East Asia, South Asia & Pacific, and the Middle East & Africa.

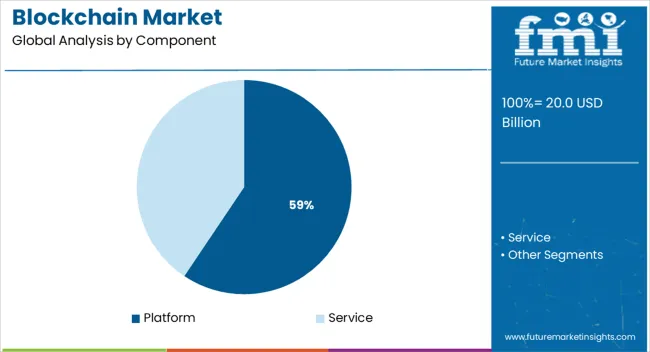
The platform segment is expected to account for 59.4% of the total market revenue in 2025, establishing itself as the leading component. This dominance is being driven by demand for core blockchain infrastructure that enables application development, transaction processing, and ledger creation.
Enterprise-grade platforms offering modular, scalable, and permissioned environments are being widely adopted across industries for use cases ranging from digital asset tracking to data verification. The ability to integrate smart contract capabilities and APIs has accelerated the deployment of blockchain-as-a-service models.
Additionally, rising interoperability requirements and the emergence of layer-2 enhancements are solidifying platform investments as foundational to long-term blockchain strategy.

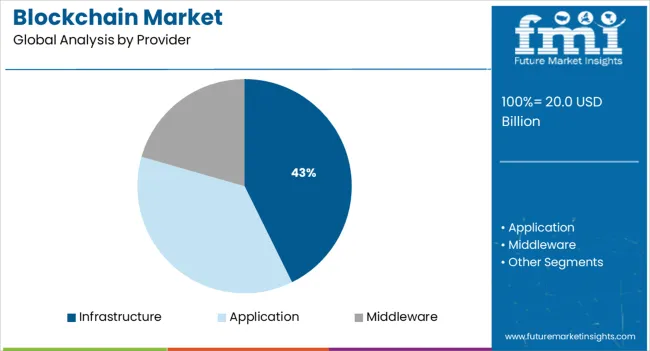
Infrastructure providers are projected to command 42.7% of the blockchain provider market share in 2025, making this the dominant segment. Their leadership is being shaped by their role in delivering the underlying networks, storage, and compute capabilities essential for blockchain operations.
Demand for decentralized cloud services, node hosting, and cryptographic security solutions has expanded their relevance. Enterprises are prioritizing vendors with infrastructure that supports consensus mechanisms, latency optimization, and regulatory compliance.
The rise of hybrid blockchain networks and public-private infrastructure collaboration is further elevating the position of infrastructure-centric providers in driving enterprise and governmental blockchain use cases.

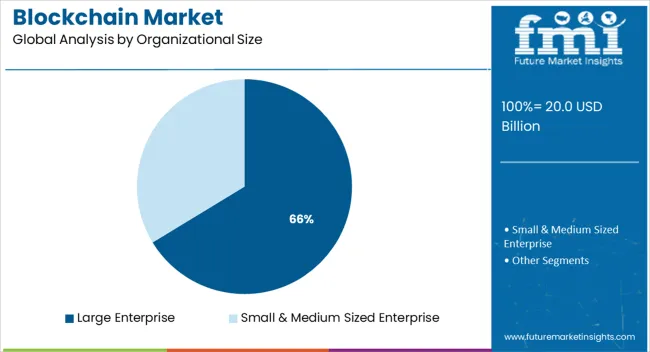
Large enterprises are expected to hold 66.3% of the total blockchain market revenue by 2025, reflecting their leadership in adoption and implementation. This lead is being driven by robust digital transformation strategies, access to capital, and increasing need for transparent and secure systems across operations.
Blockchain adoption among large organizations is being supported by internal innovation labs, cross-border data exchange, and the need for real-time auditability in areas like trade finance, asset tracking, and supply chain provenance. Enterprise blockchain pilots are evolving into production-grade networks, with large firms acting as ecosystem anchors for consortium-based models.
The ability to absorb compliance costs and invest in blockchain integration with ERP, CRM, and cloud-native systems has further established large enterprises as the principal drivers of market maturity.
The Asia Pacific is anticipated to yield immense growth opportunities, backed by favorable regulatory policies by several countries like China, Japan & India. By 2035-end, an annual growth rate of 32% has been projected for the region.
Within the Asia Pacific, China is likely to emerge as the strongest country owing to its robust financial infrastructure and the arrival of new entrants in the market. These aspects are likely to augment the acceptance rate of blockchain and help improve the challenges like online fraud, transactional security, etc.
Likewise, India is expected to experience stellar growth, attributed to the rising adoption of online payments and increasing awareness about its benefits, such as high transparency and increased efficiency, offered by this technology to multiple industries. Consequently, Blockchain manufacturers are seizing this opportunity to expand their clientele base in the regional market.
In terms of company size, the large enterprise segment is projected to grasp the highest growth over the forecast period. The segment accounted for nearly 55% share in 2025 and is estimated to maintain its governance in the coming years.
Large enterprises operating in segments, such as insurance, financial services, healthcare, and supply chain, are gradually making efforts to digitalize their offerings, which is generating the demand for blockchain technology among them.
Large enterprises, such as BBVA, Intesa Sanpaolo, Barclays, and HSBC, are adopting blockchain technology to streamline their KYC and fund processes. They have access to passable capital and different assets to implement novel technologies presented in the market.
A blockchain is a digital ledger of transactions that is replicated and distributed across the complete network of computer systems on the blockchain. With the increasing penetration of smartphones in countries like China, India, etc., there has been an amplified acceptance of digital transactions and digital identity detection. Key players Like IBM and Amazon Web Services are investing in the development of a more secure system for implementing their services
Startup culture and an increase in blockchain venture capital along with government initiatives all are contributing to the growth of the blockchain market.
Increased venture capital funding and investment in blockchain technology, widespread implementation of blockchain solutions in banking and cybersecurity, widespread adoption of blockchain solutions for payment, smart contracts, and digital identities, and rising government initiatives are all contributing to the high growth rate of the blockchain market.
Following the launch of Bitcoin, blockchain technology blossomed, and it is currently being used to execute transactions by a range of financial institutions.
In the last two-three years, blockchain technology solutions have exploded in popularity for a variety of commercial applications, including payments, exchanges, smart contracts, documentation, and digital identification.
Many startups have entered the market and begun developing blockchain-based solutions, which results in the adoption of blockchain technology.
The enthusiasm and capital investments of venture capitalists were at an all-time high, resulting in the development of specialized blockchain ventures capital firms such as Boost VC and Node Capital.
Regulatory uncertainty is still a problem in the blockchain market. At the moment, one of the most significant impediments to blockchain adoption in most verticals is the lack of rules and the resulting ambiguity. Initial coin offerings have been forbidden by some governments (ICOs).
Regulatory acceptance is one of the most difficult components of modernizing transaction systems.
With the rapid advancement of technology, regulatory agencies must evaluate what gaps exist in current regulations and how they affect total technological applications. Financial institutions from all across the world are collaborating to develop blockchain technology standards.
Blockchain technology offers enormous potential in a variety of fields, including banking, cybersecurity, and the Internet of Things. In numerous application areas, such as smart city projects, smart transportation, smart grids, vehicular networking, autonomous vehicles, and smart homes, IoT devices are widely used.
Several pioneers are constructing a decentralized network of IoT devices utilizing blockchain solutions, removing the need for a central site to oversee device connectivity.
Blockchain technology has the potential to disrupt and revolutionize transactions but to reap the benefits, businesses must overcome key security, privacy, and control challenges.
Hackers can profit from a bigger attack surface to obtain access to crucial and sensitive information since blockchain transactions are recorded in a distributed public ledger.
If a blockchain solution is used to hold sensitive contract or payment data, copying the file could provide hackers more access. In both a hub-and-spoke and a distributed database, if a key is compromised, it can be used to access the database.
The blockchain market can be segmented into components, providers, type, organizational sizes, application areas, and regions. On the basis of components, the platform segment holds the largest market share with an expected CAGR of 33.4%.
On the basis of type, the Private segment is anticipated to have significant growth in the forecast period, with an expected CAGR of 30.4%.
| Regions | CAGR (2025 to 2035) |
|---|---|
| USA | 33.9% |
| United Kingdom | 33% |
| China | 33.4% |
| Japan | 32.9% |
| South Korea | 32.2% |
With a projected CAGR of 33.9%, the North American regional market topped the global market in 2035, accounting for USD 55 Billion in revenue. The regional market is growing due to the increased usage of blockchain technology by businesses in the region.
Payment and wallet solutions, smart contracts, and digital identity detection solutions are being implemented in industries like government, retail, and BFSI, necessitating the use of blockchain technologies. Furthermore, one of the primary factors boosting regional market growth is the increased use of cryptocurrency among consumers in North America.
Research shows how the competitors are taking advantage of the opportunities present in the blockchain market. Some of the recent developments in the blockchain market are:
The global blockchain market is estimated to be valued at USD 20.0 billion in 2025.
The market size for the blockchain market is projected to reach USD 376.4 billion by 2035.
The blockchain market is expected to grow at a 34.1% CAGR between 2025 and 2035.
The key product types in blockchain market are platform and service.
In terms of provider, infrastructure segment to command 42.7% share in the blockchain market in 2025.


Our Research Products

The "Full Research Suite" delivers actionable market intel, deep dives on markets or technologies, so clients act faster, cut risk, and unlock growth.

The Leaderboard benchmarks and ranks top vendors, classifying them as Established Leaders, Leading Challengers, or Disruptors & Challengers.

Locates where complements amplify value and substitutes erode it, forecasting net impact by horizon

We deliver granular, decision-grade intel: market sizing, 5-year forecasts, pricing, adoption, usage, revenue, and operational KPIs—plus competitor tracking, regulation, and value chains—across 60 countries broadly.

Spot the shifts before they hit your P&L. We track inflection points, adoption curves, pricing moves, and ecosystem plays to show where demand is heading, why it is changing, and what to do next across high-growth markets and disruptive tech

Real-time reads of user behavior. We track shifting priorities, perceptions of today’s and next-gen services, and provider experience, then pace how fast tech moves from trial to adoption, blending buyer, consumer, and channel inputs with social signals (#WhySwitch, #UX).

Partner with our analyst team to build a custom report designed around your business priorities. From analysing market trends to assessing competitors or crafting bespoke datasets, we tailor insights to your needs.
Supplier Intelligence
Discovery & Profiling
Capacity & Footprint
Performance & Risk
Compliance & Governance
Commercial Readiness
Who Supplies Whom
Scorecards & Shortlists
Playbooks & Docs
Category Intelligence
Definition & Scope
Demand & Use Cases
Cost Drivers
Market Structure
Supply Chain Map
Trade & Policy
Operating Norms
Deliverables
Buyer Intelligence
Account Basics
Spend & Scope
Procurement Model
Vendor Requirements
Terms & Policies
Entry Strategy
Pain Points & Triggers
Outputs
Pricing Analysis
Benchmarks
Trends
Should-Cost
Indexation
Landed Cost
Commercial Terms
Deliverables
Brand Analysis
Positioning & Value Prop
Share & Presence
Customer Evidence
Go-to-Market
Digital & Reputation
Compliance & Trust
KPIs & Gaps
Outputs
Full Research Suite comprises of:
Market outlook & trends analysis
Interviews & case studies
Strategic recommendations
Vendor profiles & capabilities analysis
5-year forecasts
8 regions and 60+ country-level data splits
Market segment data splits
12 months of continuous data updates
DELIVERED AS:
PDF EXCEL ONLINE
Blockchain Interoperability Market Size and Share Forecast Outlook 2025 to 2035
Blockchain Food Traceability Market Size and Share Forecast Outlook 2025 to 2035
Blockchain AI Market Size and Share Forecast Outlook 2025 to 2035
Blockchain Messaging Apps Market Size and Share Forecast Outlook 2025 to 2035
Blockchain in Logistics Market Size and Share Forecast Outlook 2025 to 2035
Blockchain in Energy Market Size and Share Forecast Outlook 2025 to 2035
Blockchain Identity Management Market Size and Share Forecast Outlook 2025 to 2035
Blockchain in Agriculture and Food Supply Chain Market Size and Share Forecast Outlook 2025 to 2035
Blockchain Technology Market Analysis & Forecast 2025 to 2035, By Solution, Use Case, Enterprise Size, Industry, and Region
Blockchain in Banking Market
Blockchain in Agriculture Market Analysis – Size, Share & Forecast 2024-2034
Managed Blockchain Services Market Size and Share Forecast Outlook 2025 to 2035
Web 3.0 Blockchain Market Report – Growth, Demand & Forecast 2024-2034
Automotive Blockchain Market Size and Share Forecast Outlook 2025 to 2035

Thank you!
You will receive an email from our Business Development Manager. Please be sure to check your SPAM/JUNK folder too.
Chat With
MaRIA