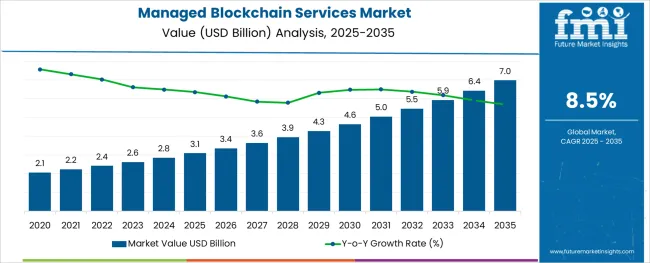
The Managed Blockchain Services Market is estimated to be valued at USD 3.1 billion in 2025 and is projected to reach USD 7.0 billion by 2035, registering a compound annual growth rate (CAGR) of 8.5% over the forecast period.

The alginic acid market is undergoing consistent growth, propelled by rising demand from food processing, pharmaceutical formulations, and cosmetic applications. A growing focus on natural and sustainable ingredients in manufacturing processes has positioned alginic acid as a preferred biopolymer across industries.
The market is further supported by its diverse functional benefits, including water retention, gelling, and stabilizing properties, which make it indispensable in high-performance formulations. Increased regulatory acceptance of alginates as safe additives and the push towards cleaner labeling in food and personal care products have reinforced their adoption.
Ongoing innovation in extraction technologies and the utilization of algae as a renewable resource are paving the way for cost-effective production and expanded applications, ensuring sustained market expansion in the coming years.
The market is segmented by Services, Enterprise, and Industry and region. By Services, the market is divided into Tools and Services. In terms of Enterprise, the market is classified into Small Offices (1-9 Employees), Small Enterprises (10-99 Employees), Medium-sized Enterprises (100-499 Employees), Large Enterprises (500-999 Employees), and Very Large Enterprises (1000+ Employees). Based on Industry, the market is segmented into Services, Distribution Services, Public Sector, Finance, Manufacturing and Resources, and Infrastructure. Regionally, the market is classified into North America, Latin America, Western Europe, Eastern Europe, Balkan & Baltic Countries, Russia & Belarus, Central Asia, East Asia, South Asia & Pacific, and the Middle East & Africa.
The market is segmented by Services, Enterprise, and Industry and region. By Services, the market is divided into Tools and Services. In terms of Enterprise, the market is classified into Small Offices (1-9 Employees), Small Enterprises (10-99 Employees), Medium-sized Enterprises (100-499 Employees), Large Enterprises (500-999 Employees), and Very Large Enterprises (1000+ Employees). Based on Industry, the market is segmented into Services, Distribution Services, Public Sector, Finance, Manufacturing and Resources, and Infrastructure. Regionally, the market is classified into North America, Latin America, Western Europe, Eastern Europe, Balkan & Baltic Countries, Russia & Belarus, Central Asia, East Asia, South Asia & Pacific, and the Middle East & Africa.
When segmented by salts, sodium alginate is expected to command 27.5% of the market revenue in 2025, marking it as the leading subsegment in this category. This leadership has been driven by its superior solubility, ease of incorporation into formulations, and versatility in a wide range of applications.
Its ability to form stable gels and maintain viscosity under varying conditions has made it highly sought after in both food and pharmaceutical sectors. Manufacturers have prioritized sodium alginate due to its consistent performance, cost-effectiveness, and regulatory acceptance, which have collectively strengthened its position.
The segment’s prominence has also been enhanced by its adaptability to evolving consumer preferences for plant-derived and sustainable ingredients, reinforcing its market share.
Segmented by end user industry, the food industry is projected to hold 33.0% of the market revenue in 2025, positioning it as the most prominent sector. This dominance has been shaped by the industry’s increasing reliance on alginic acid and its derivatives to deliver desirable textures, stabilize emulsions, and improve shelf life of processed foods.
As consumer demand for clean label and natural additives has intensified, the food sector has responded by integrating alginates into bakery, dairy, and confectionery products. Enhanced production efficiency and compliance with food safety standards have further encouraged widespread use.
The segment’s leadership has also been supported by product differentiation strategies where alginates contribute to premium quality and innovation, securing their role in modern food formulations.
The globally managed blockchain services market was thriving at a CAGR of 10.0% between 2020 and 2024. The comparatively lower CAGR was attributed to the first phase of its adsorption. Also, the pandemic and system failure did put a hold on the research and development of blockchain technology.
Though, now the market is expected to thrive at a CAGR of 11.8% between 2025 and 2035. This rapid acceleration is due to the rising application of managed blockchain services in sectors such as banking, finance, manufacturing, and R&D. Therefore, the recently developed companies of different scales are fueling the demand for managed blockchain services.
Drivers:
The fourth industrial revolution makes the managed blockchain important for small and mid-sized businesses as they require accelerated growth along with enhanced security integrated. Future Market Insights explains the growth drivers for managed blockchain services market:
The managed blockchain ensures enclosed and encrypted data transfer. The sensitive and crucial data gets saved through unauthorized activities. Blockchain technology anonymizes personal data and uses permission to prevent access. Information is stored across a network of computers rather than a single server, making it difficult for hackers to view the data.
The higher transparency provided by blockchain technology makes transactions and other financial activities clearer and free from any corruption activity. All transactions are immutably recorded and are time- and date-stamped. This enables members to view the entire history of a transaction and virtually eliminates any opportunity for fraud.
Blockchain technology tracks and traces transactions and other transfers. It makes it possible to share data about the provenance directly with customers. Furthermore, it put environmental or human rights in perspective. This helps businesses in keeping a track of their data transfers.
Blockchain technology helps streamline procedures and time-bound operations with automated tools and services. The managed blockchain services can easily fasten the operational speed while enhancing the nodal capability. Network monitoring makes it a safer and faster platform. The automatic settlements and transaction cuts all the hassle and fuels its adoption.
Restraint:
The major restraints for the market are limited awareness and the high cost associated with its implementation which has led to the limited sales of managed blockchain services.
The services category is divided into two segments, namely. tools, and services where the services segment holds an approximate share of 64.5% in the global market. While the tools segment grows at a higher CAGR of 16.3% during the forecast period. The growth of managed blockchain services is attributed to the easy implementation and affordable cost associated with the service segment.
Very large enterprises with more than thousands of employees top the managed blockchain services market with an approximate market hold of 26.0% while it thrives on a CAGR of 8.9% during the forecast period. The factor contributing to its higher demand is the safety and security of increased transactions. Higher processing is another factor that impacts the increased adoption of managed blockchain services in these enterprises. Though the small office segment is rising faster with a CAGR of 22.7% during the forecast period and holds a market share of 13.0%.
While the major share is held by the finance sector with a market share of 26.3% and a CAGR of 14.1%, the fastest growing end-user segment is the public sector which thrives at a CAGR of 17.7% during the forecast period. Its growth is attributed to the increasing automation in the public sector along with the rising databases that demand a blockchain solution.

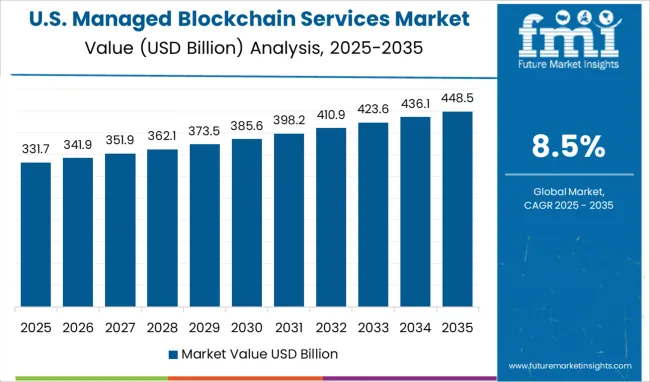
The rising innovation and the presence of big companies have made the USA the biggest market for managed blockchain services market.

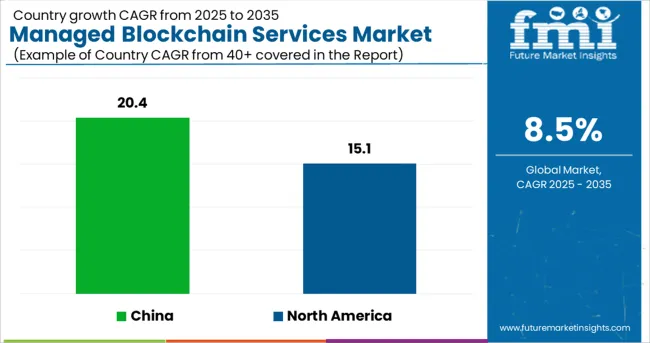
North America holds a market share of approximately 32.9% while it flourishes on a CAGR of 15.1%. The USA is the hub of technology and the home for major companies that have made it the testing ground of different technologies. While cryptocurrencies become trendy here in the USA, blockchain technology was developed here itself. The recent application of it being used in banking & finance services is fuelling the demand for managed blockchain services. Giants such as Amazon are using managed blockchain services to enhance the user experience and ease transactional procedures.
Higher research and development programs along with increased public sector acceptance flourish the managed blockchain services market in the United Kingdom.
The United Kingdom adopts managed blockchain services as security threats increase day by day. Europe holds a market share of 20.7% while it thrives on a CAGR of 16.4% during the forecast period. The public sector entities along with the higher government authorities have started adopting the technology to keep the transaction enclosed and safe. Technological research and higher spending on them have pushed ahead the number of blockchain vendors.
Advanced technology and industrial experimentation lead the sales of blockchain technology in China.
Chinese technological experiments have flourished their blockchain story and have helped major companies in converting their ledger into a digitally automated platform for higher speed and transparency. East Asia is holding a share of 18.6% while it thrives at a CAGR of 20.4% during the forecast period. The building infrastructure and automation have also fueled the demand for managed blockchain services in the region.
South Asia & Pacific is the fastest-growing region in the market is flourished through the industrial implementation and integration of other components of Industries 4.0.
Japan and South Korea have been at the pinnacle of technological transformation for years. This gave the region a plus point to adopt every new technology. The rising small and large-scale businesses have led to a higher demand for AI and machine learning technology along with the managed blockchain service that further caters to these businesses in fastening their operational time and ensuring security. South Asia and the Pacific thrive at a robust CAGR of 22.5% during the forecast period.
The managed blockchain market is new and is an addition to the existing blockchain market. Therefore, the brands are the major companies that provide customized blockchain solutions to the end users. The competition is high as each brand has its own USP. The major companies in the market are SAP SE, IBM Corporation, Microsoft Corporation, VMware, etc.
Recent Market Developments
| Attribute | Details |
|---|---|
| Forecast Period | 2025 to 2035 |
| Historical Data Available for | 2020 to 2024 |
| Market Analysis | million for Value and Units for Volume |
| Key Regions Covered | North America; Latin America; Europe; Asia Pacific; Oceania; and Middle East and Africa(MEA) |
| Key Countries Covered | USA, Canada, Mexico, Germany, United Kingdom, France, Italy, Spain, China, Japan, India, South Korea, Australia, Brazil, Argentina, South Africa, and United Arab Emirates(UAE) |
| Key Segments Covered | Enterprise Type, Service Type, Industry Type, and Region |
| Key Companies Profiled | IBM Corporation; Microsoft Corporation; Alibaba Group; Oracle Corporation; SAP SE; Baidu, Inc.; Accenture Plc; NTT Data Corporation; Infosys Limited; Stratis Group Ltd.; VMware, Inc.; Huawei Service (Hong Kong) Co., Limited |
| Report Coverage | Market Forecast, Company Share Analysis, Competition Intelligence, Drivers, Restraints, Opportunities and Threats Analysis, Market Dynamics and Challenges, and Strategic Growth Initiatives |
| Customization & Pricing | Available upon Request |
The global managed blockchain services market is estimated to be valued at USD 3.1 billion in 2025.
It is projected to reach USD 7.0 billion by 2035.
The market is expected to grow at a 8.5% CAGR between 2025 and 2035.
The key product types are tools and services.
small offices (1-9 employees) segment is expected to dominate with a 21.4% industry share in 2025.


Full Research Suite comprises of:
Market outlook & trends analysis
Interviews & case studies
Strategic recommendations
Vendor profiles & capabilities analysis
5-year forecasts
8 regions and 60+ country-level data splits
Market segment data splits
12 months of continuous data updates
DELIVERED AS:
PDF EXCEL ONLINE
Managed File Transfer (MFT) Market Size and Share Forecast Outlook 2025 to 2035
Managed Travel Distribution Market Size and Share Forecast Outlook 2025 to 2035
Managed DDoS Protection Market Report - Growth & Forecast 2025 to 2035
Managed Detection and Response Market
Managed Services Market Analysis - Size, Share, and Forecast Outlook 2025 to 2035
Managed Print Services Market by Type by Industry & Region Forecast till 2035
Managed SD-WAN Services Market Size and Share Forecast Outlook 2025 to 2035
Managed Network Services Market Size and Share Forecast Outlook 2025 to 2035
Managed Mobility Services Market Size and Share Forecast Outlook 2025 to 2035
Managed Database Services Market Report - Growth & Forecast 2025 to 2035
Managed Workplace Services Market Analysis – Growth & Forecast through 2035
Managed Infrastructure Services Market Analysis by Solution, Application, and Region Through 2035
USA Managed Workplace Services Market Insights – Trends, Demand & Growth 2025-2035
Cloud Managed Services Market
Japan Managed Workplace Services Market Growth – Trends, Demand & Innovations 2025-2035
Telecom Managed Service Market Trends - Growth & Forecast 2025 to 2035
Germany Managed Workplace Services Market Analysis – Demand, Growth & Forecast 2025-2035
UK Countries Managed Workplace Services Market Report – Demand, Trends & Industry Forecast 2025-2035
GCC Countries Managed Workplace Services Market Report – Growth, Demand & Forecast 2025-2035
Blockchain Interoperability Market Size and Share Forecast Outlook 2025 to 2035

Thank you!
You will receive an email from our Business Development Manager. Please be sure to check your SPAM/JUNK folder too.
Chat With
MaRIA