Managed Services Market Size and Share Forecast Outlook 2025 to 2035

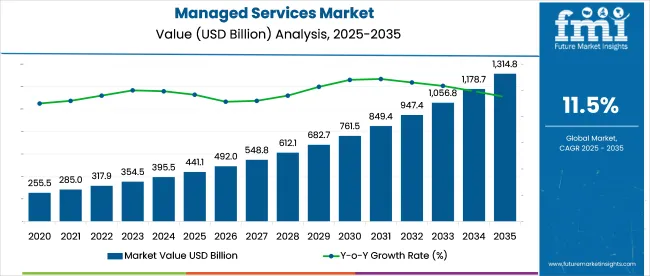
The managed services market is estimated at USD 441.1 billion in 2025. Demand is projected to reach USD 1,314.9 billion by 2035, growing at a CAGR of 11.5%. This growth is being fueled by rising demand for scalable IT infrastructure, cost-effective outsourcing models, and proactive threat mitigation.
Quick Stat of Managed Services Market

  • Market Size 2025: USD 441.1 billion
  • Projected Size 2035: USD 1,314.9 billion
  • CAGR (2025 to 2035): 11.5%
  • Top Solution (2025): Managed Security - 24.5% share
  • Top End-Use Sector (2025): IT & Telecom - 26.9% share
  • Top Country CAGR: India - 9.6% (2025 to 2035)
  • Leading Player: IBM Corporation holding 8% share

Managed Services Market

Organizations across sectors are transitioning from traditional IT models to fully or partially outsourced services to optimize resources and ensure continuous system performance. Managed services providers (MSPs) are increasingly relied upon for everything from infrastructure management and network monitoring to cloud operations and data security. Companies like IBM, Accenture, and DXC Technology are expanding their global delivery capabilities with automation-first and AI-integrated offerings.

As of 2025, the managed services market accounts for approximately 25-30% of the overall IT services market, reflecting its role in ongoing infrastructure and application management. Within the cloud computing market, managed services contribute around 15-20%, driven by the need for support across multi-cloud and hybrid environments. In the broader outsourcing services market, the segment holds a 20-25% share, indicating a move from transactional outsourcing to long-term service partnerships.

For enterprise IT infrastructure, managed services represent 10-15%, particularly in network, storage, and data center operations. In cybersecurity services, managed offerings make up 30-35%, as organizations increasingly rely on external providers for threat detection, monitoring, and compliance. These shares demonstrate managed services’ integration across major IT domains.

In February 2025, IBM finalized its USD 6.4 billion acquisition of HashiCorp, completing integration of HashiCorp’s Terraform and Vault tools into IBM’s hybrid cloud platform. Rob Thomas, IBM’s SVP & chief commercial officer, commented: “With this acquisition, IBM is committed to continuing to invest in and grow the HashiCorp capabilities.” These moves underscore IBM’s strategy to build out managed and automated infrastructure services amidst growing enterprise demand.

Analyzing Managed Services Market by Top Investment Segments

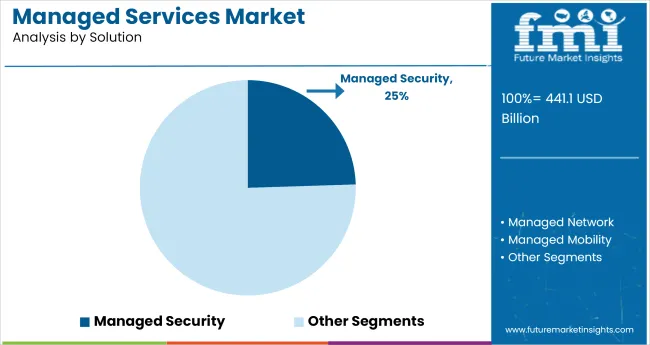
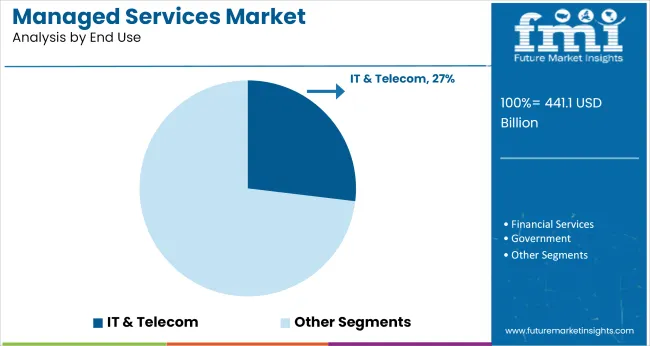
Managed services adoption remains strong across IT-heavy industries. In 2025, managed security services lead with 24.5% share by solution, reflecting increasing cybersecurity incidents. IT and telecom hold the top position among end-use sectors with 26.9%, driven by high infrastructure dependency.
Managed Security Services Lead by 24.5% Market Share in 2025

Managed Services Market Analysis By Solution

Managed security commands 24.5% of the total market, driven by the rise in ransomware, zero-day attacks, and endpoint vulnerabilities. Enterprises allocate 15-18% of their IT budgets to managed security outsourcing. Vendors like IBM, AT&T Cybersecurity, and Palo Alto Networks offer threat intelligence, SIEM integration, and managed detection & response (MDR) through 24/7 SOCs. Regulatory compliance frameworks such as ISO/IEC 27001 and NIST 800-53 make continuous monitoring essential.
  • Over 80% of large enterprises outsource at least one security function
  • Demand for MDR services grew by 21% YoY in 2024
  • Organizations using managed SOCs detect threats 35% faster on average

IT & Telecom Drive Demand with 26.9% Market Share

Managed Services Market Analysis By End Use

The IT and telecom sector accounts for 26.9% of total end-use demand, reflecting heavy reliance on uptime, network redundancy, and data center performance. Providers such as NTT Ltd., Cognizant, and HCLTech offer managed infrastructure, network, and BSS platforms to telcos and IT firms across hybrid environments. These enterprises face high volume SLAs, necessitating proactive monitoring and zero-downtime architecture.
  • Nearly 60% of telcos outsource part of their OSS/BSS stack
  • Managed network services account for 40% of IT & telecom contracts
  • Remote infrastructure management helps reduce internal IT costs by up to 28%

Large Enterprises Maintain Dominance in Service Adoption

Managed Services Market Analysis By Enterprise Size

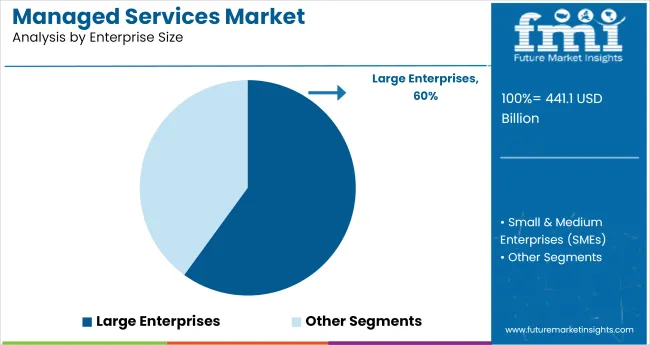
Large enterprises remain the dominant customer segment, accounting for over 60% of total managed services usage. These organizations operate across multi-region environments and rely on third-party providers to support cloud migration, disaster recovery, and service continuity. They typically have over 1,000 endpoints under management and integrate MSPs for cost control and specialist expertise. Companies like Capgemini, TCS, and DXC Technology service complex hybrid environments involving on-premises and hosted assets.
  • Over 75% of Fortune 500 companies engage MSPs for at least two core IT functions.
  • SLA compliance rates exceed 98% across Tier-1 MSP contracts
  • Outsourcing reduces in-house maintenance costs by 20-30% in large-scale environments

Hosted Deployment Outpaces On-Premises Across Enterprises

Managed Services Market Analysis By Deployment

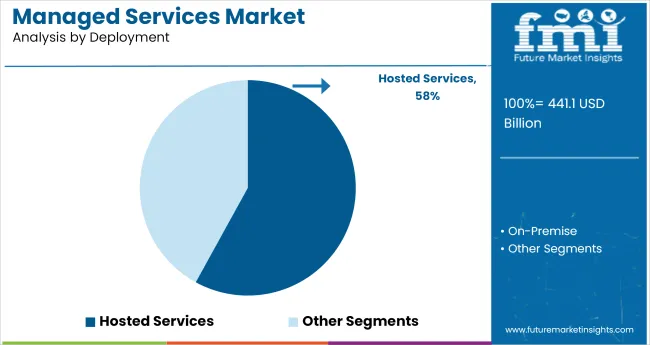
Hosted services are gaining traction across SMEs and large enterprises due to faster deployment, lower CAPEX, and built-in scalability. Hosted solutions now comprise 58% of total managed services contracts. Key adoption areas include email security, backup-as-a-service, and network monitoring. Vendors provide integrated dashboards and SLA-based escalation models through the cloud.
  • Hosted models shorten deployment timelines by 35-40% compared to on-premises
  • Enterprises report 25-30% lower TCO over five years for cloud-hosted services
  • Hosted managed backup is now the second-fastest growing sub-segment by deployment

BPO Accounts for Largest Share of Managed Information Services

Managed Services Market Analysis By Managed Information Service

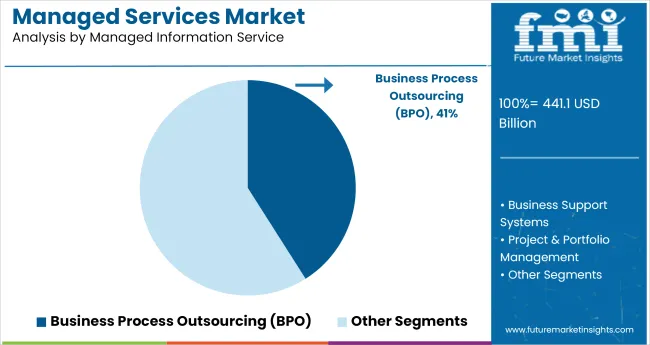
Business Process Outsourcing (BPO) remains the top contributor, accounting for over 41% of the managed information services segment. Enterprises are outsourcing functions like customer service, finance, and HR to reduce fixed overheads and improve scalability. Vendors such as Genpact, TCS, and Infosys BPM handle over 300 million global customer interactions annually, offering multilingual, omnichannel capabilities. Automation has reduced average processing time by 22-27% in F&A BPO services. Industry-specific BPO-especially in healthcare and BFSI-drives deal size and duration.

  • Approximately 65% of Tier-1 enterprises rely on BPO for at least one back-office function
  • Automated workflows lower service delivery cost by 18-24%
  • Average contract length for strategic BPO exceeds 3.8 years

Top Managed Services Market Dynamics

The managed services market is gaining momentum as businesses seek agile infrastructure and cost-efficient IT solutions. Growth is being driven by rising cyber threats, demand for 24/7 IT support, and the need for scalable service models.

Shift to Outcome-Based Contracts Alters Engagement Models

Mid-size enterprises and large corporations are adjusting procurement toward service-level agreements linked to uptime, response times, and cost-per-ticket metrics. MSPs are phasing out fixed-capacity retainers in favor of hybrid models combining remote infrastructure management with consumption-based billing. In North America, 41% of managed service deals signed in H1 2025 incorporated variable billing elements tied to cloud resource usage.

Across Europe, MSPs supporting industrial clients have integrated predictive maintenance and edge analytics into standard packages, shortening incident resolution windows by 19% on average. Asian providers are adopting modular contracts where clients selectively activate components like endpoint protection, database patching, or API monitoring, allowing finer cost control and service flexibility.

Cloud-Native Integration Redefines Service Delivery Scope

Managed service portfolios now extend beyond infrastructure to encompass workload optimization across multi-cloud environments. By Q2 2025, over 54% of contracts involving AWS, Azure, or GCP support included active cost governance tools, workload migration schedules, and container orchestration.

Clients are favoring providers with proprietary automation IP, reducing manual ticket volume by 27% year-over-year across Tier 2 markets. In financial services and retail, MSPs are embedding CI/CD pipeline management, enabling concurrent DevOps alignment and compliance reporting. Support teams are increasingly co-located with client developer squads, maintaining continuous visibility into code-level performance and rollback dependencies.

Margin Compression Linked to Talent Shortages and Contract Churn

Labor supply constraints, especially for certified cloud engineers and security analysts, are driving up baseline delivery costs. Average fully loaded compensation for AWS-certified architects rose 11% YoY in Southeast Asia by June 2025. Simultaneously, pricing pressure from client re-bidding cycles has compressed gross margins by 250-380 basis points across mid-tier MSPs. Vendors facing margin erosion have begun automating service desk tiers and decommissioning low-margin L1 support.

Some firms have exited legacy infrastructure support entirely, redirecting teams to manage Kubernetes clusters and zero-trust frameworks. While high-value contracts tied to regulated sectors offer pricing stability, low-differentiation support services continue to experience rate erosion and elevated churn risk.
Top Countries Building and Scaling Managed Services Infrastructure

Country Wise Analysis Of Managed Services Market

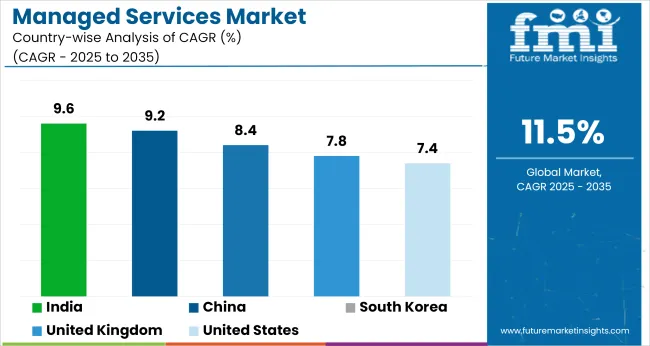
Countries CAGR (2025 to 2035)
India 9.6%
China 9.2%
South Korea 8.4%
United Kingdom 7.8%
United States 7.4%

Global demand for managed services is projected to increase at an 11.5% CAGR from 2025 to 2035. Among the five profiled countries, India and China, both BRICS members, post the highest national growth at 9.6% and 9.2%, respectively-trailing the global average by -17% and to 20%. South Korea records 8.4% (-27%), while OECD economies such as the United Kingdom (7.8%) and United States (7.4%) show gaps of -32% and -36%, respectively.

The divergence stems from a combination of digital transformation intensity, availability of skilled outsourcing talent, and IT infrastructure maturity. BRICS economies benefit from scalable service ecosystems and increase domestic enterprise IT spend, while OECD markets are limited by cost structures and legacy system inertia. The widening performance gap suggests an evolving shift in managed services leadership toward emerging markets with flexible capacity and rapid cloud adoption models.

Technological Diversification in the United States Managed Services Sector

The managed services industry in the United States is experiencing steady advancement, with growth anticipated at an annualized pace of 7.4% from 2025 to 2035. This trajectory reflects a deeper enterprise shift toward integrated IT ecosystems blending AI, zero-trust architecture, and container-based orchestration. Innovation in service delivery, particularly around DevSecOps, software-defined networking, and infrastructure observability, is redefining contract terms and lifecycle value.

  • Containerized workloads saw a 22% YoY increase, driven by hybrid cloud dependency in Fortune 1000 firms
  • Telecom operators shifted 38% of network operations to MSPs, optimizing 5G rollouts and latency control
  • Healthcare MSP penetration grew by 23%, underpinned by demand for HIPAA-compliant IT frameworks

Risk-Driven Digital Operations Accelerate Managed Services in the United Kingdom

Over the forecast period, the United Kingdom is projected to maintain a compound annual growth rate of 7.8%, driven by regulatory stringency and increased scrutiny around data governance. With cybersecurity obligations under GDPR and FCA guidelines intensifying, managed detection and response (MDR) tools and endpoint resilience systems are being widely outsourced. Local providers are capitalizing on demand for infrastructure built on sovereign principles-localized data centers, zero egress fees, and audit-friendly architectures.

  • Cyber audit-as-a-service agreements rose 26% YoY, led by the finance and legal sectors
  • Identity and access management services grew by 29%, influenced by secure remote work mandates
  • Adoption of hybrid sovereign clouds increased by 19%, aligning with public sector procurement preferences

State-Led Cloud Migration Energizes China’s Managed Services Industry

China is positioned for rapid managed services adoption, registering an expected CAGR of 9.2% through 2035. This robust expansion is linked to national digital policy frameworks that encourage enterprises and SMEs to shift core IT functions to government-compliant platforms. Domestic vendors dominate the space, offering AI-integrated platforms and localized SLAs tailored to regional compliance thresholds. Demand is particularly pronounced in industrial hubs where automation, latency-reduction, and city-level digital governance are prioritized.

  • Government-affiliated enterprises-initiated 40+ large-scale MSP migrations in 2024, mainly in industrial zones
  • AI-integrated cloud backups saw 29% YoY growth, aiding operational resilience mandates in logistics
  • Regional MSP ecosystems expanded by 35%, supporting data localization and uptime guarantees in Tier-I cities

Platform-Led Managed IT Expansion in India

The managed services industry in India is forecasted to expand at a robust 9.6% CAGR over the next decade, reflecting increasing demand from SMEs, startups, and public cloud integrators. The shift is marked by a move away from traditional IT outsourcing toward full-stack platform services ranging from AI-assisted dashboards to infrastructure-as-code deployments. Digital India’s initiatives and favorable data policies continue to stimulate demand across Tier-II and Tier-III urban centers.

  • Over 1,200 MSP engagements were initiated by mid-size businesses in 2024, especially in fintech and edtech
  • Demand for multi-tenant dashboards surged by 36%, supporting real-time monitoring needs for D2C brands
  • Tier-II city consumption of managed cybersecurity tools climbed by 42%, led by retail and civic tech applications

Infrastructure Automation Steers South Korea’s Managed Services Market

South Korea is anticipated to record a yearly average growth rate of 8.4% between 2025 and 2035, with market demand driven by convergence of edge computing, AI orchestration, and public-private infrastructure upgrades. Large enterprises and municipal bodies are embracing AIOps, centralized control layers, and predictive analytics to ensure business continuity. Sectoral uptake remains particularly strong across healthcare, logistics, and smart manufacturing segments.
  • Smart logistics contracts saw a 30% YoY increase, fueled by real-time orchestration and self-healing systems
  • Municipal data centers outsourced 24% of services, focused on uptime and central control room functionality
  • AI-based infrastructure analytics rose by 28%, optimizing energy use and failure response in critical systems

Leading Managed Services Providers

Managed Services Market Analysis By Company

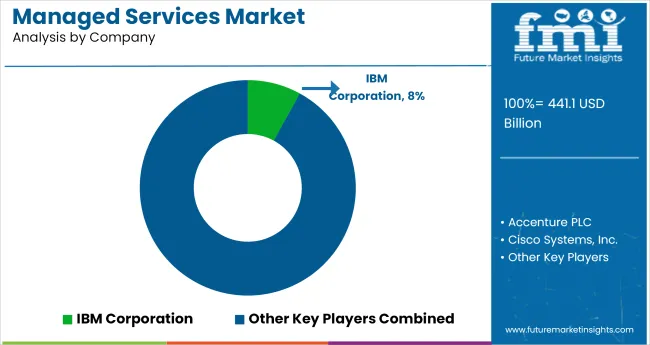
Leading Players - IBM Corporation holding 8% share

The managed services market is structured around complex integration needs and long-duration contracts, with firms like IBM Corporation, Accenture PLC, and Cisco Systems, Inc. maintaining strong client retention through global service delivery and portfolio depth. Accenture expands its capabilities through targeted acquisitions, while IBM aligns manage offerings with enterprise cloud migration. Cisco focuses on network performance and endpoint control to strengthen client lock-in. HPE and DXC Technology build recurring engagement by embedding services into operational workflows, limiting vendor replacement.

New entrants face structural barriers such as high infrastructure requirements, extended client onboarding cycles, and regulatory compliance constraints. Large vendors benefit from multi-year contracts, proprietary platforms, and operational scale. Emerging participants like Alcatel-Lucent Enterprise, Avaya Inc., and BMC Software pursue narrow service models tailored to regional or sector-specific gaps, often relying on internal development or strategic collaborations. Scaling remains difficult without established delivery ecosystems or embedded client relationships.

Recent Industry News

  • In April 2025, IBM acquired Hakkoda Inc., a datascience and AI services firm, to enhance its managed services and AI-driven IT operations capabilities. The deal strengthens IBM’s commitment to end-to-end enterprise service delivery.
  • In February 2025, IBM finalized its USD 6.4 billion acquisition of HashiCorp, completing integration of HashiCorp’s Terraform and Vault tools into IBM’s hybrid cloud platform.

Leading Players

  • IBM Corporation
  • Accenture PLC
  • Cisco Systems, Inc.
  • DXC Technology Company
  • Hewlett Packard Enterprise (HPE)
  • Alcatel-Lucent Enterprise
  • Avaya Inc.
  • AT&T Inc.
  • Ericsson
  • Fujitsu Limited
  • Lenovo Group Limited
  • CA Technologies
  • BMC Software, Inc.

Report Scope

Report Attributes Details
Current Total Market Size (2025) USD 441.1 billion
Projected Market Size (2035) USD 1,314.9 billion
CAGR (2025 to 2035) 11.5%
Base Year for Estimation 2024
Historical Period 2020 to 2024
Projections Period 2025 to 2035
Quantitative Units USD billion for value
Segments Analyzed - By Solution Managed Data Center, Managed Network, Managed Mobility, Managed Infrastructure, Managed Backup and Recovery, Managed Communication, Managed Information, Managed Security
Segments Analyzed - By Enterprise Size Small & Medium Enterprises (SMEs), Large Enterprises
Segments Analyzed - By End-Use Financial Services, Government, Healthcare, IT & Telecom, Manufacturing, Media & Entertainment, Retail, Others
Segments Analyzed - By Managed Information Service Business Process Outsourcing (BPO), Business Support Systems, Project & Portfolio Management, Others
Segments Analyzed - By Deployment On-premises, Hosted
Regions Covered North America, Latin America, Europe, Asia-Pacific, Middle East & Africa
Countries Covered United States, Canada, Mexico, Brazil, Argentina, Germany, France, United Kingdom, Italy, Spain, Netherlands, China, India, Japan, South Korea, Australia, New Zealand, GCC Countries, South Africa
Key Players Accenture PLC, Alcatel-Lucent Enterprise, AT&T Inc., Avaya Inc., Ericsson, Fujitsu Limited, Hewlett Packard Enterprise Development LP, International Business Machines Corporation, Lenovo Group Limited, BMC Software, Inc., CA Technologies, Cisco Systems, Inc., DXC Technology Company
Additional Attributes Dollar sales by solution type, enterprise size, and end-use, growing demand for IT infrastructure outsourcing, shift toward cloud-based deployment, increasing need for managed security services, trends in automation and digital transformation driving managed services adoption, regional differences in managed services uptake.

Managed Services Market Analyzed by Key Investment Segments

By Solution:

The industry is segmented by solution into managed data center, managed network, managed mobility, managed infrastructure, managed backup and recovery, managed communication, managed information, and managed security.

By Enterprise Size:

Based on enterprise size, the market is classified into small & medium enterprises (SMEs) and large enterprises.

By End Use:

By end use, the managed services market is categorized into financial services, government, healthcare, IT & telecom, manufacturing, media & entertainment, retail, and others.

By Managed Information Service:

This segment includes business process outsourcing (BPO), business support systems, project & portfolio management, and others.

By Deployment:

Deployment models include on-premises and hosted services.

By Region:

Geographic segmentation includes North America, Latin America, Europe, Asia-Pacific, and the Middle East & Africa.

Table of Content

  1. Executive Summary
    • Global Market Outlook
    • Demand-side Trends
    • Supply-side Trends
    • Technology Roadmap Analysis
    • Analysis and Recommendations
  2. Market Overview
    • Market Coverage / Taxonomy
    • Market Definition / Scope / Limitations
  3. Market Background
    • Market Dynamics
      • Drivers
      • Restraints
      • Opportunity
      • Trends
    • Scenario Forecast
      • Demand in Optimistic Scenario
      • Demand in Likely Scenario
      • Demand in Conservative Scenario
    • Opportunity Map Analysis
    • Product Life Cycle Analysis
    • Supply Chain Analysis
      • Supply Side Participants and their Roles
        • Producers
        • Mid-Level Participants (Traders/ Agents/ Brokers)
        • Wholesalers and Distributors
      • Value Added and Value Created at Node in the Supply Chain
      • List of Raw Material Suppliers
      • List of Existing and Potential Buyer’s
    • Investment Feasibility Matrix
    • Value Chain Analysis
      • Profit Margin Analysis
      • Wholesalers and Distributors
      • Retailers
    • PESTLE and Porter’s Analysis
    • Regulatory Landscape
      • By Key Regions
      • By Key Countries
    • Regional Parent Market Outlook
    • Production and Consumption Statistics
    • Import and Export Statistics
  4. Global Market Analysis 2020 to 2024 and Forecast, 2025 to 2035
    • Historical Market Size Value (USD Billion) & Volume Analysis, 2020 to 2024
    • Current and Future Market Size Value (USD Billion) & Volume Projections, 2025 to 2035
      • Y-o-Y Growth Trend Analysis
      • Absolute $ Opportunity Analysis
  5. Global Market Pricing Analysis 2020 to 2024 and Forecast 2025 to 2035
  6. Global Market Analysis 2020 to 2024 and Forecast 2025 to 2035, By Solution
    • Introduction / Key Findings
    • Historical Market Size Value (USD Billion) & Volume Analysis By Solution, 2020 to 2024
    • Current and Future Market Size Value (USD Billion) & Volume Analysis and Forecast By Solution, 2025 to 2035
      • Managed Data Center
      • Managed Network
      • Managed Mobility
      • Managed Infrastructure
      • Managed Backup and Recovery
      • Managed Communication
      • Managed Information
      • Managed Security
    • Y-o-Y Growth Trend Analysis By Solution, 2020 to 2024
    • Absolute $ Opportunity Analysis By Solution, 2025 to 2035
  7. Global Market Analysis 2020 to 2024 and Forecast 2025 to 2035, By Enterprise Size
    • Introduction / Key Findings
    • Historical Market Size Value (USD Billion) & Volume Analysis By Enterprise Size, 2020 to 2024
    • Current and Future Market Size Value (USD Billion) & Volume Analysis and Forecast By Enterprise Size, 2025 to 2035
      • Small & Medium Enterprises (SMEs)
      • Large Enterprises
    • Y-o-Y Growth Trend Analysis By Enterprise Size, 2020 to 2024
    • Absolute $ Opportunity Analysis By Enterprise Size, 2025 to 2035
  8. Global Market Analysis 2020 to 2024 and Forecast 2025 to 2035, By End Use
    • Introduction / Key Findings
    • Historical Market Size Value (USD Billion) & Volume Analysis By End Use, 2020 to 2024
    • Current and Future Market Size Value (USD Billion) & Volume Analysis and Forecast By End Use, 2025 to 2035
      • Financial Services
      • Government
      • Healthcare
      • IT & Telecom
      • Manufacturing
      • Media & Entertainment
      • Retail
      • Others
    • Y-o-Y Growth Trend Analysis By End Use, 2020 to 2024
    • Absolute $ Opportunity Analysis By End Use, 2025 to 2035
  9. Global Market Analysis 2020 to 2024 and Forecast 2025 to 2035, By Managed Information Service
    • Introduction / Key Findings
    • Historical Market Size Value (USD Billion) & Volume Analysis By Managed Information Service, 2020 to 2024
    • Current and Future Market Size Value (USD Billion) & Volume Analysis and Forecast By Managed Information Service, 2025 to 2035
      • Business Process Outsourcing (BPO)
      • Business Support Systems
      • Project & Portfolio Management
      • Others
    • Y-o-Y Growth Trend Analysis By Managed Information Service, 2020 to 2024
    • Absolute $ Opportunity Analysis By Managed Information Service, 2025 to 2035
  10. Global Market Analysis 2020 to 2024 and Forecast 2025 to 2035, By Deployment
    • Introduction / Key Findings
    • Historical Market Size Value (USD Billion) & Volume Analysis By Deployment, 2020 to 2024
    • Current and Future Market Size Value (USD Billion) & Volume Analysis and Forecast By Deployment, 2025 to 2035
      • On-Premise
      • Hosted Services
    • Y-o-Y Growth Trend Analysis By Deployment, 2020 to 2024
    • Absolute $ Opportunity Analysis By Deployment, 2025 to 2035
  11. Global Market Analysis 2020 to 2024 and Forecast 2025 to 2035, By Region
    • Introduction
    • Historical Market Size Value (USD Billion) & Volume Analysis By Region, 2020 to 2024
    • Current Market Size Value (USD Billion) & Volume Analysis and Forecast By Region, 2025 to 2035
      • North America
      • Latin America
      • Western Europe
      • Eastern Europe
      • East Asia
      • South Asia & Pacific
      • Middle East and Africa
    • Market Attractiveness Analysis By Region
  12. North America Market Analysis 2020 to 2024 and Forecast 2025 to 2035, By Country
    • Historical Market Size Value (USD Billion) & Volume Trend Analysis By Market Taxonomy, 2020 to 2024
    • Market Size Value (USD Billion) & Volume Forecast By Market Taxonomy, 2025 to 2035
      • By Country
        • USA
        • Canada
        • Mexico
      • By Solution
      • By Enterprise Size
      • By End Use
      • By Managed Information Service
      • By Deployment
    • Market Attractiveness Analysis
      • By Country
      • By Solution
      • By Enterprise Size
      • By End Use
      • By Managed Information Service
      • By Deployment
    • Key Takeaways
  13. Latin America Market Analysis 2020 to 2024 and Forecast 2025 to 2035, By Country
    • Historical Market Size Value (USD Billion) & Volume Trend Analysis By Market Taxonomy, 2020 to 2024
    • Market Size Value (USD Billion) & Volume Forecast By Market Taxonomy, 2025 to 2035
      • By Country
        • Brazil
        • Argentina
        • Rest of LATAM
      • By Solution
      • By Enterprise Size
      • By End Use
      • By Managed Information Service
      • By Deployment
    • Market Attractiveness Analysis
      • By Country
      • By Solution
      • By Enterprise Size
      • By End Use
      • By Managed Information Service
      • By Deployment
    • Key Takeaways
  14. Western Europe Market Analysis 2020 to 2024 and Forecast 2025 to 2035, By Country
    • Historical Market Size Value (USD Billion) & Volume Trend Analysis By Market Taxonomy, 2020 to 2024
    • Market Size Value (USD Billion) & Volume Forecast By Market Taxonomy, 2025 to 2035
      • By Country
        • Germany
        • Italy
        • France
        • UK
        • Spain
        • BENELUX
        • Nordic
        • Rest of W.Europe
      • By Solution
      • By Enterprise Size
      • By End Use
      • By Managed Information Service
      • By Deployment
    • Market Attractiveness Analysis
      • By Country
      • By Solution
      • By Enterprise Size
      • By End Use
      • By Managed Information Service
      • By Deployment
    • Key Takeaways
  15. Eastern Europe Market Analysis 2020 to 2024 and Forecast 2025 to 2035, By Country
    • Historical Market Size Value (USD Billion) & Volume Trend Analysis By Market Taxonomy, 2020 to 2024
    • Market Size Value (USD Billion) & Volume Forecast By Market Taxonomy, 2025 to 2035
      • By Country
        • Russia
        • Hungary
        • Poland
        • Balkan & Baltics
        • Rest of E. Europe
      • By Solution
      • By Enterprise Size
      • By End Use
      • By Managed Information Service
      • By Deployment
    • Market Attractiveness Analysis
      • By Country
      • By Solution
      • By Enterprise Size
      • By End Use
      • By Managed Information Service
      • By Deployment
    • Key Takeaways
  16. East Asia Market Analysis 2020 to 2024 and Forecast 2025 to 2035, By Country
    • Historical Market Size Value (USD Billion) & Volume Trend Analysis By Market Taxonomy, 2020 to 2024
    • Market Size Value (USD Billion) & Volume Forecast By Market Taxonomy, 2025 to 2035
      • By Country
        • China
        • Japan
        • South Korea
      • By Solution
      • By Enterprise Size
      • By End Use
      • By Managed Information Service
      • By Deployment
    • Market Attractiveness Analysis
      • By Country
      • By Solution
      • By Enterprise Size
      • By End Use
      • By Managed Information Service
      • By Deployment
    • Key Takeaways
  17. South Asia & Pacific Market Analysis 2020 to 2024 and Forecast 2025 to 2035, By Country
    • Historical Market Size Value (USD Billion) & Volume Trend Analysis By Market Taxonomy, 2020 to 2024
    • Market Size Value (USD Billion) & Volume Forecast By Market Taxonomy, 2025 to 2035
      • By Country
        • India
        • Australia & New Zealand
        • ASEAN
        • Rest of SAP
      • By Solution
      • By Enterprise Size
      • By End Use
      • By Managed Information Service
      • By Deployment
    • Market Attractiveness Analysis
      • By Country
      • By Solution
      • By Enterprise Size
      • By End Use
      • By Managed Information Service
      • By Deployment
    • Key Takeaways
  18. Middle East and Africa Market Analysis 2020 to 2024 and Forecast 2025 to 2035, By Country
    • Historical Market Size Value (USD Billion) & Volume Trend Analysis By Market Taxonomy, 2020 to 2024
    • Market Size Value (USD Billion) & Volume Forecast By Market Taxonomy, 2025 to 2035
      • By Country
        • GCC Countries
        • Northern Africa
        • South Africa
        • Turkiye
        • Rest of MEA
      • By Solution
      • By Enterprise Size
      • By End Use
      • By Managed Information Service
      • By Deployment
    • Market Attractiveness Analysis
      • By Country
      • By Solution
      • By Enterprise Size
      • By End Use
      • By Managed Information Service
      • By Deployment
    • Key Takeaways
  19. Key Countries Market Analysis
    • USA
      • Pricing Analysis
      • Market Share Analysis, 2024
        • By Solution
        • By Enterprise Size
        • By End Use
        • By Managed Information Service
        • By Deployment
    • Canada
      • Pricing Analysis
      • Market Share Analysis, 2024
        • By Solution
        • By Enterprise Size
        • By End Use
        • By Managed Information Service
        • By Deployment
    • Brazil
      • Pricing Analysis
      • Market Share Analysis, 2024
        • By Solution
        • By Enterprise Size
        • By End Use
        • By Managed Information Service
        • By Deployment
    • Mexico
      • Pricing Analysis
      • Market Share Analysis, 2024
        • By Solution
        • By Enterprise Size
        • By End Use
        • By Managed Information Service
        • By Deployment
    • Argentina
      • Pricing Analysis
      • Market Share Analysis, 2024
        • By Solution
        • By Enterprise Size
        • By End Use
        • By Managed Information Service
        • By Deployment
  20. Market Structure Analysis
    • Competition Dashboard
    • Competition Benchmarking
    • Market Share Analysis of Top Players
      • By Regional
      • By Solution
      • By Enterprise Size
      • By End Use
      • By Managed Information Service
      • By Deployment
  21. Competition Analysis
    • Competition Deep Dive
      • IBM Corporation
        • Overview
        • Product Portfolio
        • Profitability by Market Segments (Product/Age /Sales Channel/Region)
        • Sales Footprint
        • Strategy Overview
          • Marketing Strategy
          • Product Strategy
          • Channel Strategy
      • Accenture PLC
        • Overview
        • Product Portfolio
        • Profitability by Market Segments (Product/Age /Sales Channel/Region)
        • Sales Footprint
        • Strategy Overview
          • Marketing Strategy
          • Product Strategy
          • Channel Strategy
      • Cisco Systems, Inc.
        • Overview
        • Product Portfolio
        • Profitability by Market Segments (Product/Age /Sales Channel/Region)
        • Sales Footprint
        • Strategy Overview
          • Marketing Strategy
          • Product Strategy
          • Channel Strategy
      • DXC Technology Company
        • Overview
        • Product Portfolio
        • Profitability by Market Segments (Product/Age /Sales Channel/Region)
        • Sales Footprint
        • Strategy Overview
          • Marketing Strategy
          • Product Strategy
          • Channel Strategy
      • Hewlett Packard Enterprise (HPE)
        • Overview
        • Product Portfolio
        • Profitability by Market Segments (Product/Age /Sales Channel/Region)
        • Sales Footprint
        • Strategy Overview
          • Marketing Strategy
          • Product Strategy
          • Channel Strategy
      • Alcatel-Lucent Enterprise
        • Overview
        • Product Portfolio
        • Profitability by Market Segments (Product/Age /Sales Channel/Region)
        • Sales Footprint
        • Strategy Overview
          • Marketing Strategy
          • Product Strategy
          • Channel Strategy
      • Avaya Inc.
        • Overview
        • Product Portfolio
        • Profitability by Market Segments (Product/Age /Sales Channel/Region)
        • Sales Footprint
        • Strategy Overview
          • Marketing Strategy
          • Product Strategy
          • Channel Strategy
      • AT&T Inc.
        • Overview
        • Product Portfolio
        • Profitability by Market Segments (Product/Age /Sales Channel/Region)
        • Sales Footprint
        • Strategy Overview
          • Marketing Strategy
          • Product Strategy
          • Channel Strategy
      • Ericsson
        • Overview
        • Product Portfolio
        • Profitability by Market Segments (Product/Age /Sales Channel/Region)
        • Sales Footprint
        • Strategy Overview
          • Marketing Strategy
          • Product Strategy
          • Channel Strategy
      • Fujitsu Limited
        • Overview
        • Product Portfolio
        • Profitability by Market Segments (Product/Age /Sales Channel/Region)
        • Sales Footprint
        • Strategy Overview
          • Marketing Strategy
          • Product Strategy
          • Channel Strategy
      • Lenovo Group Limited
        • Overview
        • Product Portfolio
        • Profitability by Market Segments (Product/Age /Sales Channel/Region)
        • Sales Footprint
        • Strategy Overview
          • Marketing Strategy
          • Product Strategy
          • Channel Strategy
      • CA Technologies
        • Overview
        • Product Portfolio
        • Profitability by Market Segments (Product/Age /Sales Channel/Region)
        • Sales Footprint
        • Strategy Overview
          • Marketing Strategy
          • Product Strategy
          • Channel Strategy
      • BMC Software, Inc.
        • Overview
        • Product Portfolio
        • Profitability by Market Segments (Product/Age /Sales Channel/Region)
        • Sales Footprint
        • Strategy Overview
          • Marketing Strategy
          • Product Strategy
          • Channel Strategy
  22. Assumptions & Acronyms Used
  23. Research Methodology

List of Tables

  • Table 1: Global Market Value (USD Billion) Forecast by Region, 2020 to 2035
  • Table 2: Global Market Volume Forecast by Region, 2020 to 2035
  • Table 3: Global Market Value (USD Billion) Forecast by Solution, 2020 to 2035
  • Table 4: Global Market Volume Forecast by Solution, 2020 to 2035
  • Table 5: Global Market Value (USD Billion) Forecast by Enterprise Size, 2020 to 2035
  • Table 6: Global Market Volume Forecast by Enterprise Size, 2020 to 2035
  • Table 7: Global Market Value (USD Billion) Forecast by End Use, 2020 to 2035
  • Table 8: Global Market Volume Forecast by End Use, 2020 to 2035
  • Table 9: Global Market Value (USD Billion) Forecast by Managed Information Service, 2020 to 2035
  • Table 10: Global Market Volume Forecast by Managed Information Service, 2020 to 2035
  • Table 11: Global Market Value (USD Billion) Forecast by Deployment, 2020 to 2035
  • Table 12: Global Market Volume Forecast by Deployment, 2020 to 2035
  • Table 13: North America Market Value (USD Billion) Forecast by Country, 2020 to 2035
  • Table 14: North America Market Volume Forecast by Country, 2020 to 2035
  • Table 15: North America Market Value (USD Billion) Forecast by Solution, 2020 to 2035
  • Table 16: North America Market Volume Forecast by Solution, 2020 to 2035
  • Table 17: North America Market Value (USD Billion) Forecast by Enterprise Size, 2020 to 2035
  • Table 18: North America Market Volume Forecast by Enterprise Size, 2020 to 2035
  • Table 19: North America Market Value (USD Billion) Forecast by End Use, 2020 to 2035
  • Table 20: North America Market Volume Forecast by End Use, 2020 to 2035
  • Table 21: North America Market Value (USD Billion) Forecast by Managed Information Service, 2020 to 2035
  • Table 22: North America Market Volume Forecast by Managed Information Service, 2020 to 2035
  • Table 23: North America Market Value (USD Billion) Forecast by Deployment, 2020 to 2035
  • Table 24: North America Market Volume Forecast by Deployment, 2020 to 2035
  • Table 25: Latin America Market Value (USD Billion) Forecast by Country, 2020 to 2035
  • Table 26: Latin America Market Volume Forecast by Country, 2020 to 2035
  • Table 27: Latin America Market Value (USD Billion) Forecast by Solution, 2020 to 2035
  • Table 28: Latin America Market Volume Forecast by Solution, 2020 to 2035
  • Table 29: Latin America Market Value (USD Billion) Forecast by Enterprise Size, 2020 to 2035
  • Table 30: Latin America Market Volume Forecast by Enterprise Size, 2020 to 2035
  • Table 31: Latin America Market Value (USD Billion) Forecast by End Use, 2020 to 2035
  • Table 32: Latin America Market Volume Forecast by End Use, 2020 to 2035
  • Table 33: Latin America Market Value (USD Billion) Forecast by Managed Information Service, 2020 to 2035
  • Table 34: Latin America Market Volume Forecast by Managed Information Service, 2020 to 2035
  • Table 35: Latin America Market Value (USD Billion) Forecast by Deployment, 2020 to 2035
  • Table 36: Latin America Market Volume Forecast by Deployment, 2020 to 2035
  • Table 37: Western Europe Market Value (USD Billion) Forecast by Country, 2020 to 2035
  • Table 38: Western Europe Market Volume Forecast by Country, 2020 to 2035
  • Table 39: Western Europe Market Value (USD Billion) Forecast by Solution, 2020 to 2035
  • Table 40: Western Europe Market Volume Forecast by Solution, 2020 to 2035
  • Table 41: Western Europe Market Value (USD Billion) Forecast by Enterprise Size, 2020 to 2035
  • Table 42: Western Europe Market Volume Forecast by Enterprise Size, 2020 to 2035
  • Table 43: Western Europe Market Value (USD Billion) Forecast by End Use, 2020 to 2035
  • Table 44: Western Europe Market Volume Forecast by End Use, 2020 to 2035
  • Table 45: Western Europe Market Value (USD Billion) Forecast by Managed Information Service, 2020 to 2035
  • Table 46: Western Europe Market Volume Forecast by Managed Information Service, 2020 to 2035
  • Table 47: Western Europe Market Value (USD Billion) Forecast by Deployment, 2020 to 2035
  • Table 48: Western Europe Market Volume Forecast by Deployment, 2020 to 2035
  • Table 49: Eastern Europe Market Value (USD Billion) Forecast by Country, 2020 to 2035
  • Table 50: Eastern Europe Market Volume Forecast by Country, 2020 to 2035
  • Table 51: Eastern Europe Market Value (USD Billion) Forecast by Solution, 2020 to 2035
  • Table 52: Eastern Europe Market Volume Forecast by Solution, 2020 to 2035
  • Table 53: Eastern Europe Market Value (USD Billion) Forecast by Enterprise Size, 2020 to 2035
  • Table 54: Eastern Europe Market Volume Forecast by Enterprise Size, 2020 to 2035
  • Table 55: Eastern Europe Market Value (USD Billion) Forecast by End Use, 2020 to 2035
  • Table 56: Eastern Europe Market Volume Forecast by End Use, 2020 to 2035
  • Table 57: Eastern Europe Market Value (USD Billion) Forecast by Managed Information Service, 2020 to 2035
  • Table 58: Eastern Europe Market Volume Forecast by Managed Information Service, 2020 to 2035
  • Table 59: Eastern Europe Market Value (USD Billion) Forecast by Deployment, 2020 to 2035
  • Table 60: Eastern Europe Market Volume Forecast by Deployment, 2020 to 2035
  • Table 61: East Asia Market Value (USD Billion) Forecast by Country, 2020 to 2035
  • Table 62: East Asia Market Volume Forecast by Country, 2020 to 2035
  • Table 63: East Asia Market Value (USD Billion) Forecast by Solution, 2020 to 2035
  • Table 64: East Asia Market Volume Forecast by Solution, 2020 to 2035
  • Table 65: East Asia Market Value (USD Billion) Forecast by Enterprise Size, 2020 to 2035
  • Table 66: East Asia Market Volume Forecast by Enterprise Size, 2020 to 2035
  • Table 67: East Asia Market Value (USD Billion) Forecast by End Use, 2020 to 2035
  • Table 68: East Asia Market Volume Forecast by End Use, 2020 to 2035
  • Table 69: East Asia Market Value (USD Billion) Forecast by Managed Information Service, 2020 to 2035
  • Table 70: East Asia Market Volume Forecast by Managed Information Service, 2020 to 2035
  • Table 71: East Asia Market Value (USD Billion) Forecast by Deployment, 2020 to 2035
  • Table 72: East Asia Market Volume Forecast by Deployment, 2020 to 2035
  • Table 73: South Asia & Pacific Market Value (USD Billion) Forecast by Country, 2020 to 2035
  • Table 74: South Asia & Pacific Market Volume Forecast by Country, 2020 to 2035
  • Table 75: South Asia & Pacific Market Value (USD Billion) Forecast by Solution, 2020 to 2035
  • Table 76: South Asia & Pacific Market Volume Forecast by Solution, 2020 to 2035
  • Table 77: South Asia & Pacific Market Value (USD Billion) Forecast by Enterprise Size, 2020 to 2035
  • Table 78: South Asia & Pacific Market Volume Forecast by Enterprise Size, 2020 to 2035
  • Table 79: South Asia & Pacific Market Value (USD Billion) Forecast by End Use, 2020 to 2035
  • Table 80: South Asia & Pacific Market Volume Forecast by End Use, 2020 to 2035
  • Table 81: South Asia & Pacific Market Value (USD Billion) Forecast by Managed Information Service, 2020 to 2035
  • Table 82: South Asia & Pacific Market Volume Forecast by Managed Information Service, 2020 to 2035
  • Table 83: South Asia & Pacific Market Value (USD Billion) Forecast by Deployment, 2020 to 2035
  • Table 84: South Asia & Pacific Market Volume Forecast by Deployment, 2020 to 2035
  • Table 85: Middle East and Africa Market Value (USD Billion) Forecast by Country, 2020 to 2035
  • Table 86: Middle East and Africa Market Volume Forecast by Country, 2020 to 2035
  • Table 87: Middle East and Africa Market Value (USD Billion) Forecast by Solution, 2020 to 2035
  • Table 88: Middle East and Africa Market Volume Forecast by Solution, 2020 to 2035
  • Table 89: Middle East and Africa Market Value (USD Billion) Forecast by Enterprise Size, 2020 to 2035
  • Table 90: Middle East and Africa Market Volume Forecast by Enterprise Size, 2020 to 2035
  • Table 91: Middle East and Africa Market Value (USD Billion) Forecast by End Use, 2020 to 2035
  • Table 92: Middle East and Africa Market Volume Forecast by End Use, 2020 to 2035
  • Table 93: Middle East and Africa Market Value (USD Billion) Forecast by Managed Information Service, 2020 to 2035
  • Table 94: Middle East and Africa Market Volume Forecast by Managed Information Service, 2020 to 2035
  • Table 95: Middle East and Africa Market Value (USD Billion) Forecast by Deployment, 2020 to 2035
  • Table 96: Middle East and Africa Market Volume Forecast by Deployment, 2020 to 2035

List of Figures

  • Figure 1: Global Market Volume Forecast 2020 to 2035
  • Figure 2: Global Market Pricing Analysis
  • Figure 3: Global Market Value (USD Billion) Forecast 2020 to 2035
  • Figure 4: Global Market Value Share and BPS Analysis by Solution, 2025 and 2035
  • Figure 5: Global Market Y-o-Y Growth Comparison by Solution, 2025 to 2035
  • Figure 6: Global Market Attractiveness Analysis by Solution
  • Figure 7: Global Market Value Share and BPS Analysis by Enterprise Size, 2025 and 2035
  • Figure 8: Global Market Y-o-Y Growth Comparison by Enterprise Size, 2025 to 2035
  • Figure 9: Global Market Attractiveness Analysis by Enterprise Size
  • Figure 10: Global Market Value Share and BPS Analysis by End Use, 2025 and 2035
  • Figure 11: Global Market Y-o-Y Growth Comparison by End Use, 2025 to 2035
  • Figure 12: Global Market Attractiveness Analysis by End Use
  • Figure 13: Global Market Value Share and BPS Analysis by Managed Information Service, 2025 and 2035
  • Figure 14: Global Market Y-o-Y Growth Comparison by Managed Information Service, 2025 to 2035
  • Figure 15: Global Market Attractiveness Analysis by Managed Information Service
  • Figure 16: Global Market Value Share and BPS Analysis by Deployment, 2025 and 2035
  • Figure 17: Global Market Y-o-Y Growth Comparison by Deployment, 2025 to 2035
  • Figure 18: Global Market Attractiveness Analysis by Deployment
  • Figure 19: Global Market Value (USD Billion) Share and BPS Analysis by Region, 2025 and 2035
  • Figure 20: Global Market Y-o-Y Growth Comparison by Region, 2025 to 2035
  • Figure 21: Global Market Attractiveness Analysis by Region
  • Figure 22: North America Market Incremental $ Opportunity, 2025 to 2035
  • Figure 23: Latin America Market Incremental $ Opportunity, 2025 to 2035
  • Figure 24: Western Europe Market Incremental $ Opportunity, 2025 to 2035
  • Figure 25: Eastern Europe Market Incremental $ Opportunity, 2025 to 2035
  • Figure 26: East Asia Market Incremental $ Opportunity, 2025 to 2035
  • Figure 27: South Asia & Pacific Market Incremental $ Opportunity, 2025 to 2035
  • Figure 28: Middle East and Africa Market Incremental $ Opportunity, 2025 to 2035
  • Figure 29: North America Market Value Share and BPS Analysis by Country, 2025 and 2035
  • Figure 30: North America Market Value Share and BPS Analysis by Solution, 2025 and 2035
  • Figure 31: North America Market Y-o-Y Growth Comparison by Solution, 2025 to 2035
  • Figure 32: North America Market Attractiveness Analysis by Solution
  • Figure 33: North America Market Value Share and BPS Analysis by Enterprise Size, 2025 and 2035
  • Figure 34: North America Market Y-o-Y Growth Comparison by Enterprise Size, 2025 to 2035
  • Figure 35: North America Market Attractiveness Analysis by Enterprise Size
  • Figure 36: North America Market Value Share and BPS Analysis by End Use, 2025 and 2035
  • Figure 37: North America Market Y-o-Y Growth Comparison by End Use, 2025 to 2035
  • Figure 38: North America Market Attractiveness Analysis by End Use
  • Figure 39: North America Market Value Share and BPS Analysis by Managed Information Service, 2025 and 2035
  • Figure 40: North America Market Y-o-Y Growth Comparison by Managed Information Service, 2025 to 2035
  • Figure 41: North America Market Attractiveness Analysis by Managed Information Service
  • Figure 42: North America Market Value Share and BPS Analysis by Deployment, 2025 and 2035
  • Figure 43: North America Market Y-o-Y Growth Comparison by Deployment, 2025 to 2035
  • Figure 44: North America Market Attractiveness Analysis by Deployment
  • Figure 45: Latin America Market Value Share and BPS Analysis by Country, 2025 and 2035
  • Figure 46: Latin America Market Value Share and BPS Analysis by Solution, 2025 and 2035
  • Figure 47: Latin America Market Y-o-Y Growth Comparison by Solution, 2025 to 2035
  • Figure 48: Latin America Market Attractiveness Analysis by Solution
  • Figure 49: Latin America Market Value Share and BPS Analysis by Enterprise Size, 2025 and 2035
  • Figure 50: Latin America Market Y-o-Y Growth Comparison by Enterprise Size, 2025 to 2035
  • Figure 51: Latin America Market Attractiveness Analysis by Enterprise Size
  • Figure 52: Latin America Market Value Share and BPS Analysis by End Use, 2025 and 2035
  • Figure 53: Latin America Market Y-o-Y Growth Comparison by End Use, 2025 to 2035
  • Figure 54: Latin America Market Attractiveness Analysis by End Use
  • Figure 55: Latin America Market Value Share and BPS Analysis by Managed Information Service, 2025 and 2035
  • Figure 56: Latin America Market Y-o-Y Growth Comparison by Managed Information Service, 2025 to 2035
  • Figure 57: Latin America Market Attractiveness Analysis by Managed Information Service
  • Figure 58: Latin America Market Value Share and BPS Analysis by Deployment, 2025 and 2035
  • Figure 59: Latin America Market Y-o-Y Growth Comparison by Deployment, 2025 to 2035
  • Figure 60: Latin America Market Attractiveness Analysis by Deployment
  • Figure 61: Western Europe Market Value Share and BPS Analysis by Country, 2025 and 2035
  • Figure 62: Western Europe Market Value Share and BPS Analysis by Solution, 2025 and 2035
  • Figure 63: Western Europe Market Y-o-Y Growth Comparison by Solution, 2025 to 2035
  • Figure 64: Western Europe Market Attractiveness Analysis by Solution
  • Figure 65: Western Europe Market Value Share and BPS Analysis by Enterprise Size, 2025 and 2035
  • Figure 66: Western Europe Market Y-o-Y Growth Comparison by Enterprise Size, 2025 to 2035
  • Figure 67: Western Europe Market Attractiveness Analysis by Enterprise Size
  • Figure 68: Western Europe Market Value Share and BPS Analysis by End Use, 2025 and 2035
  • Figure 69: Western Europe Market Y-o-Y Growth Comparison by End Use, 2025 to 2035
  • Figure 70: Western Europe Market Attractiveness Analysis by End Use
  • Figure 71: Western Europe Market Value Share and BPS Analysis by Managed Information Service, 2025 and 2035
  • Figure 72: Western Europe Market Y-o-Y Growth Comparison by Managed Information Service, 2025 to 2035
  • Figure 73: Western Europe Market Attractiveness Analysis by Managed Information Service
  • Figure 74: Western Europe Market Value Share and BPS Analysis by Deployment, 2025 and 2035
  • Figure 75: Western Europe Market Y-o-Y Growth Comparison by Deployment, 2025 to 2035
  • Figure 76: Western Europe Market Attractiveness Analysis by Deployment
  • Figure 77: Eastern Europe Market Value Share and BPS Analysis by Country, 2025 and 2035
  • Figure 78: Eastern Europe Market Value Share and BPS Analysis by Solution, 2025 and 2035
  • Figure 79: Eastern Europe Market Y-o-Y Growth Comparison by Solution, 2025 to 2035
  • Figure 80: Eastern Europe Market Attractiveness Analysis by Solution
  • Figure 81: Eastern Europe Market Value Share and BPS Analysis by Enterprise Size, 2025 and 2035
  • Figure 82: Eastern Europe Market Y-o-Y Growth Comparison by Enterprise Size, 2025 to 2035
  • Figure 83: Eastern Europe Market Attractiveness Analysis by Enterprise Size
  • Figure 84: Eastern Europe Market Value Share and BPS Analysis by End Use, 2025 and 2035
  • Figure 85: Eastern Europe Market Y-o-Y Growth Comparison by End Use, 2025 to 2035
  • Figure 86: Eastern Europe Market Attractiveness Analysis by End Use
  • Figure 87: Eastern Europe Market Value Share and BPS Analysis by Managed Information Service, 2025 and 2035
  • Figure 88: Eastern Europe Market Y-o-Y Growth Comparison by Managed Information Service, 2025 to 2035
  • Figure 89: Eastern Europe Market Attractiveness Analysis by Managed Information Service
  • Figure 90: Eastern Europe Market Value Share and BPS Analysis by Deployment, 2025 and 2035
  • Figure 91: Eastern Europe Market Y-o-Y Growth Comparison by Deployment, 2025 to 2035
  • Figure 92: Eastern Europe Market Attractiveness Analysis by Deployment
  • Figure 93: East Asia Market Value Share and BPS Analysis by Country, 2025 and 2035
  • Figure 94: East Asia Market Value Share and BPS Analysis by Solution, 2025 and 2035
  • Figure 95: East Asia Market Y-o-Y Growth Comparison by Solution, 2025 to 2035
  • Figure 96: East Asia Market Attractiveness Analysis by Solution
  • Figure 97: East Asia Market Value Share and BPS Analysis by Enterprise Size, 2025 and 2035
  • Figure 98: East Asia Market Y-o-Y Growth Comparison by Enterprise Size, 2025 to 2035
  • Figure 99: East Asia Market Attractiveness Analysis by Enterprise Size
  • Figure 100: East Asia Market Value Share and BPS Analysis by End Use, 2025 and 2035
  • Figure 101: East Asia Market Y-o-Y Growth Comparison by End Use, 2025 to 2035
  • Figure 102: East Asia Market Attractiveness Analysis by End Use
  • Figure 103: East Asia Market Value Share and BPS Analysis by Managed Information Service, 2025 and 2035
  • Figure 104: East Asia Market Y-o-Y Growth Comparison by Managed Information Service, 2025 to 2035
  • Figure 105: East Asia Market Attractiveness Analysis by Managed Information Service
  • Figure 106: East Asia Market Value Share and BPS Analysis by Deployment, 2025 and 2035
  • Figure 107: East Asia Market Y-o-Y Growth Comparison by Deployment, 2025 to 2035
  • Figure 108: East Asia Market Attractiveness Analysis by Deployment
  • Figure 109: South Asia & Pacific Market Value Share and BPS Analysis by Country, 2025 and 2035
  • Figure 110: South Asia & Pacific Market Value Share and BPS Analysis by Solution, 2025 and 2035
  • Figure 111: South Asia & Pacific Market Y-o-Y Growth Comparison by Solution, 2025 to 2035
  • Figure 112: South Asia & Pacific Market Attractiveness Analysis by Solution
  • Figure 113: South Asia & Pacific Market Value Share and BPS Analysis by Enterprise Size, 2025 and 2035
  • Figure 114: South Asia & Pacific Market Y-o-Y Growth Comparison by Enterprise Size, 2025 to 2035
  • Figure 115: South Asia & Pacific Market Attractiveness Analysis by Enterprise Size
  • Figure 116: South Asia & Pacific Market Value Share and BPS Analysis by End Use, 2025 and 2035
  • Figure 117: South Asia & Pacific Market Y-o-Y Growth Comparison by End Use, 2025 to 2035
  • Figure 118: South Asia & Pacific Market Attractiveness Analysis by End Use
  • Figure 119: South Asia & Pacific Market Value Share and BPS Analysis by Managed Information Service, 2025 and 2035
  • Figure 120: South Asia & Pacific Market Y-o-Y Growth Comparison by Managed Information Service, 2025 to 2035
  • Figure 121: South Asia & Pacific Market Attractiveness Analysis by Managed Information Service
  • Figure 122: South Asia & Pacific Market Value Share and BPS Analysis by Deployment, 2025 and 2035
  • Figure 123: South Asia & Pacific Market Y-o-Y Growth Comparison by Deployment, 2025 to 2035
  • Figure 124: South Asia & Pacific Market Attractiveness Analysis by Deployment
  • Figure 125: Middle East and Africa Market Value Share and BPS Analysis by Country, 2025 and 2035
  • Figure 126: Middle East and Africa Market Value Share and BPS Analysis by Solution, 2025 and 2035
  • Figure 127: Middle East and Africa Market Y-o-Y Growth Comparison by Solution, 2025 to 2035
  • Figure 128: Middle East and Africa Market Attractiveness Analysis by Solution
  • Figure 129: Middle East and Africa Market Value Share and BPS Analysis by Enterprise Size, 2025 and 2035
  • Figure 130: Middle East and Africa Market Y-o-Y Growth Comparison by Enterprise Size, 2025 to 2035
  • Figure 131: Middle East and Africa Market Attractiveness Analysis by Enterprise Size
  • Figure 132: Middle East and Africa Market Value Share and BPS Analysis by End Use, 2025 and 2035
  • Figure 133: Middle East and Africa Market Y-o-Y Growth Comparison by End Use, 2025 to 2035
  • Figure 134: Middle East and Africa Market Attractiveness Analysis by End Use
  • Figure 135: Middle East and Africa Market Value Share and BPS Analysis by Managed Information Service, 2025 and 2035
  • Figure 136: Middle East and Africa Market Y-o-Y Growth Comparison by Managed Information Service, 2025 to 2035
  • Figure 137: Middle East and Africa Market Attractiveness Analysis by Managed Information Service
  • Figure 138: Middle East and Africa Market Value Share and BPS Analysis by Deployment, 2025 and 2035
  • Figure 139: Middle East and Africa Market Y-o-Y Growth Comparison by Deployment, 2025 to 2035
  • Figure 140: Middle East and Africa Market Attractiveness Analysis by Deployment
  • Figure 141: Global Market - Tier Structure Analysis
  • Figure 142: Global Market - Company Share Analysis

Frequently Asked Questions

What is the market size of the global managed services market in 2025?

The global managed services industry is estimated at USD 441.1 billion in 2025.

How fast is the managed services market expected to grow by 2035?

The market is projected to reach USD 1,314.9 billion by 2035, growing at a CAGR of 11.5%.

Which solution type is leading in 2025?

Managed security leads the market in 2025 with a 24.5% share.

Which end-use industry holds the largest share?

The IT & telecom segment dominates with a 26.9% market share in 2025.

Who is the top player in the managed services market?

Top player is IBM Corporation holding 8% Industry share.

Explore Similar Insights

Future Market Insights

Managed Services Market