Reports

- Global Locations -

Headquarters

Future Market Insights, Inc.

Christiana Corporate, 200
Continental Drive, Suite 401,
Newark, Delaware - 19713,
United States

T: +1-845-579-5705

Americas

Future Market Insights, Inc.

616 Corporate Way, Suite 2-9018,
Valley Cottage, NY 10989, United States

T: +1-347-918-3531

MEA

Future Market Insights

1602-6 Jumeirah Bay X2 Tower, Plot No: JLT-PH2-X2A,
Jumeirah Lakes Towers, Dubai,
United Arab Emirates

Europe

Future Market Insights

3rd Floor, 207 Regent Street,
W1B 3HH London
United Kingdom

T: + 44 (0) 20 8123 9659
D: +44 (0) 20 3287 4268

Asia Pacific

Future Market Insights

IndiaLand Global Tech Park, Unit UG-1, Behind Grand HighStreet, Phase 1, Hinjawadi, MH, Pune – 411057, India

M2M Services Market Outlook (2022 to 2032)

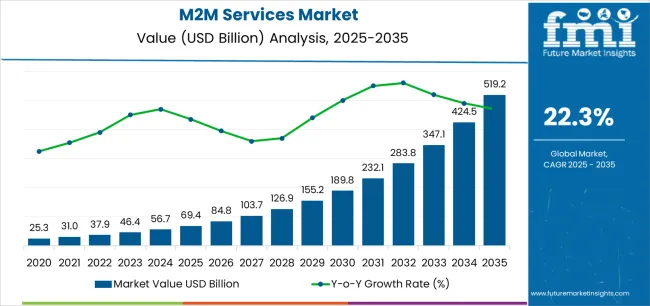
[299 Pages Report] The global M2M services market size was valued at US$ 31.2 Billion in 2021 and is projected to grow at a compound annual growth rate of 25.2% reaching US$ 376.3 Billion by 2032 from US$ 39.7 Billion in 2022.

A growing interest in creating smart infrastructures in different verticals to stimulate market growth for M2M services in the future.

Attributes Details
M2M Services Market CAGR (2022 to 2032) 25.2%
M2M Services Market Size (2022) US$ 39.7 Billion
M2M Services Market Size (2032) US$ 376.3 Billion

The M2M technology is used to monitor the vital statistics of patients, dispense medicines when needed, or track healthcare assets in real time. Remote monitoring is often accomplished through machine-to-machine communication. Combining the Internet of Things, AI, and ML in order to build a better mobile payment experience, which will further enable new opportunities for the consumption of products and services. Low power consumption would enable this system to support M2M applications, hence improving its performance and reliability.

Businesses across the globe focused on developing sustainable business models to withstand COVID-19. With the pandemic coming to an end, vendors continue operating and adapting their business models to deal with the aftermath. Businesses, economies, and consumers are seeing great benefits from M2M and the IoT, identified by governments and industries as a technology that is growing in popularity worldwide.

Don't pay for what you don't need

Customize your report by selecting specific countries or regions and save 30%!

Growing IoT penetration in Industrialization is driving M2M Services Growth?

Growth in smartphone sales, tablets, and the use of sensors and their application, in addition to the ongoing increase in cellular and wireless connectivity for the home along with growing automation and the adoption of M2M services in automobiles, have all contributed to exponential growth in these categories.

In addition to offering benefits like full control of device connectivity along with self-scheduling and self-management of device, subscription, and billing options, managed M2M services are also increasingly being accepted by organizations all over the country because of their benefits.

The consolidation of services with fewer M2M providers is another benefit users are anticipating with great interest. In addition to providing connectivity to their devices, users like their service providers to offer them more than just connectivity; they also demand secure networks, device administration, industry-standard billing platforms, cross-network aggregate, and significant industry expertise. Recent years have seen a rising interest in the Industrial Internet of Things. Manufacturing companies and businesses are utilizing Industry 4.0 to automate processes, monitor machinery, and perform proactive maintenance on machinery to ensure the proper function of their machines. Global cellular M2M solutions market growth prospects are predicted to be strong in the next few years.

M2M Services Market

A wide range of attacks will also be experienced by end users due to the advent of new devices and M2M communication systems. With the rise in complicated applications being deployed by customers, connectivity services are becoming more in demand. As a result, there is a need for services that offer high levels of security, reliability, scalability, and coverage.

What are the Key Challenges faced by the M2M Services Market?

The high installation and maintenance costs of this technology, however, are some of the challenges facing the market, resulting in its slow growth. A rise in data and network load, together with privacy concerns, are limiting the market growth.

Global cellular network connectivity and robust applications of cellular M2M are the main things driving the market. As a result, increasing internet traffic, increased security challenges and concerns about data privacy are slowing down the market's growth. A growing demand for standardization of M2M services along with policy-related issues is posing a challenge to the industry.

A great deal may be at stake in terms of the future growth of these services depending on the presence of hybrid networks on the market. In addition, the expansion of data breaches in the market is a direct result of the integration of security and networking in connected vehicles. A lack of knowledge within the organization is a challenge that further complicates the issue of handling these services in different verticals.

Sudip Saha
Sudip Saha

Principal Consultant

Talk to Analyst

Find your sweet spots for generating winning opportunities in this market.

Comparative View of M2M Services Market

M2M Services Market:

Attributes M2M Services Market
CAGR (2022 to 2032) 25.2%
Market Value (2025) US$ 83.1 Billion
Growth Factor With the growth of IoT and M2M services, there is a growing demand for innovative M2M platforms to make it possible to enable new M2M services.
Opportunity Increasing technology adoption in a wide range of industries is additionally expected to promote the growth of the machine-to-machine services market.
Key Trends As the M2M market grows, strategic alliances and the increased use of analytics will be the next trends in this market.

Large Enterprise M2M Services Market:

Attributes Large Enterprise M2M Services Market
CAGR (2022 to 2032) 24.7%
Market Value (2025) US$ 59.2 Billion
Growth Factor Demand for large data storage spaces and IoT devices is growing in the market for large enterprises.
Opportunity The development of telecommunications and network expansions in urban areas to further boost these markets.
Key Trends Enterprises can use the M2M services for various applications like asset tracking and management, predictive maintenance, transportation management, telemedicine, logistics, industrial automation, wireless meters, and others in future markets.

Connectivity and Data Storage Services Market:

Attributes Connectivity and Data Storage Services Market
CAGR (2022 to 2032) 25.5%
Market Value (2025) US$ 64.7 Billion
Growth Factor IoT devices are growing in number, and the proliferation of smartphones is feeding the growth in the market.
Opportunity The widespread penetration of the Internet across a variety of countries and the appropriate regulatory environment are key factors that will help the connectivity and data services market grow in the coming years.
Key Trends The proliferation of embedded telematics solutions and the consolidation of platforms are key trends in the industry.

Growing demand for improved data standardization should continue to drive the M2M services market. The rise of start-ups and the increasingly favorable funding opportunities have created a favorable environment for these services to grow in the market. The implementation of electronic product codes paired with RFID technology and the use of global coding systems in order to further boost the market for M2M services.

M2M asset devices require reliable communication channels, a presence for episodic information exchange, and limited power, and computing capabilities. Several solutions for wireless sensor networks have been developed, with some focusing on particular domains and applications. It is common for these solutions to have vendor-specific solutions for computing platforms, radio technologies, communications, and services.

Demand for low-powered wireless sensor communication such as Bluetooth 4.0, and Bluetooth Smart, applicable to a wide range of industries. However, there will still be a need for generic interfaces that are based on standard communication protocol standards and would work with embedded M2M assets and mobile gateways that are limited in capability.

Fiber optic cables are being expanded and Internet connections are being improved. The development of M2M services has enabled telecom service providers to provide integrated solutions to industrial consumers. As part of their advantages, M2M services are offered at significantly lower costs, which is strengthening their uptake across a broad spectrum of industry verticals.

How are Large Enterprises fostering growth in the market for M2M services?

Based on organization size, the market is segmented into large enterprises and SMEs in the global M2M services market. It is estimated that the M2M services are experiencing the strongest growth among large enterprises in the market. The market for large enterprises is expected to reach a CAGR of 24.7% during the forecast period.

M2M services have seen a rise in their popularity among the large enterprises in the market due to the growing demand for automation and high data storage spaces. Expansion of businesses and expansions in a variety of developing regions will help to further boost the market for large enterprises in the global M2M market. A growing presence of major market players in developing regions is further expected to stimulate the growth of M2M services in large enterprises. An increase in demand for automation in the automotive industry, and a large number of customers looking to connect their devices to their vehicles, will further propel the market for M2M services in the market.

M2M service providers help large enterprises optimize their network infrastructures, deploy new applications, and troubleshoot any issues with IoT devices, as well as detect and mitigate security attacks. As a result, they always look for solutions in the industry that can assist them in increasing their operational efficiency.

Get the data you need at a Fraction of the cost

Personalize your report by choosing insights you need
and save 40%!

How Connectivity and Data Storage Services are accelerating the Growth of the M2M Services Market?

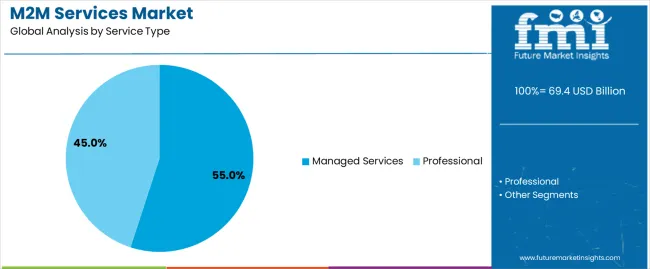
Based on service type the market is segmented into managed services, professional services, and connectivity and data storage services. It is forecast that the market for connectivity and data storage services will grow by a CAGR of 25.5% during the forecast period.

The wireless connectivity technology will further increase the market for M2M services in the marketplace. The proliferation of 5G networks and smart devices in the global market is expected to boost the market for M2M services over the next few years. The M2M connections market is expected to grow at the highest rate for wireless technology between 2022 and 2032.

Customers are deploying more complicated applications, which is increasing the demand for connectivity services. To ensure network coverage in remote areas, services must make sure the networks are secure, reliable, and scalable. Due to this, providing global coverage for roaming services and SIM cards has become a crucial component of IoT solutions.

Wi-Fi, Bluetooth, and ZigBee are becoming popular technologies for short-range wireless connectivity in multiple applications such as in-car entertainment, medical devices, smart home technology, and consumer electronics, driving the growth of the wireless technology market. Furthermore, the widespread prevalence of mobile services globally and the increasing adoption of LTE systems are further propelling the growth of M2M communication through wireless connectivity.

M2M Services Regional Outlook

How do the Various Regions Influence the Growth of the M2M Services Market?

Telecommunication sectors are expected to stimulate the market in Asia Pacific Region

The Asia Pacific region is set to grow at the fastest rate during the forecast period. The rapid proliferation of network connectivity and wireless communication devices, coupled with the adoption of new technologies, drive growth in Asia during the forecast period. M2M connections market growth in APAC is attributed to several factors, including increased Internet penetration in commercial and residential spaces, large consumer base, rising incomes, and technological advancement to all further boost market for M2M services in the market.

The development of government-funded programs, such as smart cities, smart meters, and policies, will facilitate a wide-scale deployment of M2M services in the market. Based on market research, M2M services are experiencing CAGRs of 28.5% and 26.8% in India and China, respectively. The development of smart cities across the globe and the adoption of digital services across a variety of industries have led to the adoption of global M2M Services.

The market value of M2M Services in Japan reached US$ 25.7 Billion during the forecast period. It is expected that the market will grow at a CAGR of 26.7% during the forecast period. As disposable income rises, businesses expand locally, and healthcare and telecommunication facilities improve, the global M2M Services market will become more competitive. High implementation costs and concerns about privacy may further impede the market's growth in this region.

What are the Growth Prospects of the M2M Services Market in the USA and UK?

US M2M Services are expected to account for a CAGR of 24.7% in 2032, driven largely by growth in the most COVID-affected countries globally. USA companies have shown a great deal of interest in implementing the latest technology, such as mobile and cloud technologies within M2M cellular solutions, in order to streamline business processes and maximize the utilization of resources.

There is a great deal of innovation in the deployment of cellular M2M mobile applications in the region, which secure digital document transfers among geographically dispersed employees or locations and facilitate collaboration. Additionally, the USA is home to a large number of technological innovators which is why there is a high demand for M2M services in the market.

According to the predictions made by the analyst, the M2M Services market in the UK will grow at a compound annual growth rate of 25.6% from 2022 to 2032. Big data and artificial intelligence are expected to play a major role in the growth of the M2M market over the next few years. Increasing demand for communications in automotive and connectivity in cellular networks is expected to boost this service in the market. The increase in transportation and logistics services in this region will lead to significant growth in the M2M services market in the global market. All these factors contribute to the growth of M2M services in these regions.

What is the Level of Competition for M2M Services in the Market?

Through strategic partnerships, manufacturers can increase production and meet consumer demand, increasing both their revenues and market share. The introduction of new products and technologies will allow end-users to reap the benefits of new technologies. Increasing the company's production capacity is one of the potential benefits of a strategic partnership.

Recent Developments in the M2M Services Market

  • In May 2021, an innovative provider of fleet management solutions, M2M in Motion, has been acquired by AAMP Global, a worldwide leader in engineering and manufacturing large and small commercial and passenger vehicles. It was their goal to create a fleet management system that would support many different types and sizes of fleets. Having joined the AAMP team allows them to accelerate the growth and development roadmap plans at a faster pace than has ever been possible before.
  • ENGIE M2M was acquired by the Business connectivity company Citymesh in June 2021 to expand its IoT services offering. Sigfox's global network is ideal for IoT projects requiring ultra-low bandwidth and long battery life. As a result of the acquisition, Citymesh, with headquarters in Belgium, will be able to support national and international customers. A large part of ENGIE's M2M development team will transfer together with the team to Citymesh. No financial details are being revealed by the company regarding the acquisition.
  • In January 2022, The Kore Developer Portal has been selected as the winning M2M Innovative Solution of 2022 by KORE, an IoT pioneer and worldwide provider of connectivity-as-a-service (CaaS). It has been selected as one of the winners of the 6th annual IoT Breakthrough Awards, a prestigious program conducted by IoT Breakthrough, a leading market intelligence organization dedicated to identifying the top companies, technologies, and products in the global Internet-of-Things (IoT) market. Data about subscriptions, usage, etc. is returned by KORE API endpoints using industry standards and principles.
  • A wireless sensor and beacon tracking platform for healthcare, transportation, and smart buildings were launched by Deal in February 2022. Among the nation's leading manufacturers of Bluetooth industrial sensors are ELA Innovation, a company of Sierra Wireless, and M2M Connectivity, an Australian IoT firm. As a distributor for ELA Innovation technologies in Australia and New Zealand, M2M Connectivity will be utilizing its extensive experience in the industries of healthcare, transportation, logistics, industry 4.0, and construction. The goals of this presentation will be to demonstrate the use of Bluetooth, Wirepas, and QUUPPA tags for locating, identifying, and measuring assets, individuals, and their environment. Through this partnership with ELA Innovation, the company is expanding its network and adding value to its suite of products as well as aligning its mission to make wireless work in every environment.
  • In March 2022, Cisco announced that the 6th Annual IoT Breakthrough Awards program recognized it as the winner of three awards, including the Top Company, Technology, and Product. The Cisco Catalyst IR1800 Rugged Series Routers were named the M2M Product of the Year, as well as the M2M Network Equipment Company of the Year. Organizations increasingly face complex problems and fragmented environments. To simplify new technologies, such as 5G and Wi-Fi 6, and to relatively uncomplicate edge computing, organizations need simple and holistic solutions.

By Key Players

  • AT&T
  • Germalto NV
  • PTC
  • Oracle
  • Ericsson AB
  • VERIZON COMMUNICATIONS INC
  • Deutsche Telekom AG
  • Vodafone + Telefonica
  • Aeris

Key Segments Covered in the M2M Services Industry Report

By Organization Size:

  • Large Enterprises
  • SMEs

By Service Type:

  • Managed
  • Professional
  • Connectivity and Data Storage

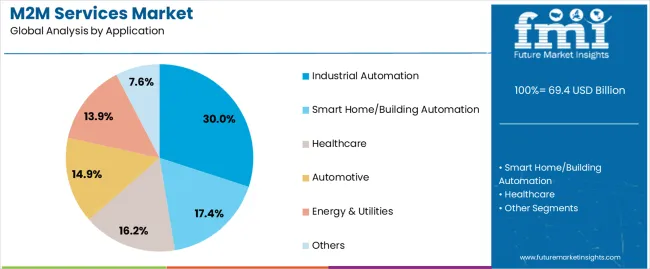
By Application:

  • Retail
  • Manufacturing
  • Healthcare
  • Automotive
  • Consumer Electronics
  • Energy and Mining
  • Transportation and Logistics
  • Oil and Gas
  • Others (Education, Hospitality)

By Region:

  • North America
  • Europe
  • Asia Pacific
  • Middle East and Africa
  • Latin America

Frequently Asked Questions

What is the Growth Status for the M2M Services Market?

Demand for m2m services is likely to grow at a CAGR of 25.2% through 2032.

What are the Lucrative Opportunities of the M2M Services Market?

Manufacturers are utilizing Industry 4.0 to automate processes, monitor machinery, and perform proactive maintenance on machinery.

What is the Adoption Potential of M2M Services?

Adoption of M2M services is likely to reach a revenue of US$ 39.7 Bn in 2022.

Who are the Key Players in the M2M Services Market?

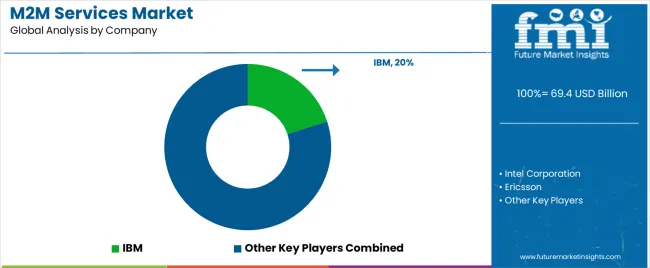
AT&T, Germalto NV, PTC, Oracle, Ericsson AB, VERIZON COMMUNICATIONS INC., Deutsche Telekom AG, Vodafone + Telefonica, Aeris, etc.

Table of Content

1. Executive Summary | M2M Services Market

    1.1. Global Market Outlook

    1.2. Summary of Statistics

    1.3. Key Market Characteristics & Attributes

    1.4. FMI Analysis and Recommendations

2. Market Overview

    2.1. Market Coverage / Taxonomy

    2.2. Market Definition / Scope / Limitations

3. Market Risks and Trends Assessment 

    3.1. Risk Assessment

        3.1.1. COVID-19 Crisis and Impact on Demand

        3.1.2. COVID-19 Impact Benchmark with Previous Crisis

        3.1.3. Impact on Market Value (US$ Million)

        3.1.4. Assessment by Key Countries

        3.1.5. Assessment by Key Market Segments

        3.1.6. Action Points and Recommendation for Suppliers

    3.2. Key Trends Impacting the Market

    3.3. Formulation and Product Development Trends

4. Market Background and Foundation Data Points 

    4.1. Global Protective Coatings Market (US$ Million)

    4.2. Market Opportunity Assessment (US$ Million)

        4.2.1. Total Available Market

        4.2.2. Serviceable Addressable Market

        4.2.3. Serviceable Obtainable Market

    4.3. Market Scenario Forecast

        4.3.1. Demand in Optimistic Scenario

        4.3.2. Demand in Likely Scenario

        4.3.3. Demand in Conservative Scenario

    4.4. Investment Feasibility Analysis

        4.4.1. Investment in Established Markets

            4.4.1.1. In Short Term

            4.4.1.2. In Long Term

        4.4.2. Investment in Emerging Markets

            4.4.2.1. In Short Term

            4.4.2.2. In Long Term

    4.5. Forecast Factors - Relevance & Impact

        4.5.1. Top Companies Historical Growth

        4.5.2. Global Protective Coatings Market Growth

        4.5.3. Adoption Rate, by Country

        4.5.4. Growth in Expenditure on Corrosion Protection Products

        4.5.5. Global GDP Growth Analysis

        4.5.6. Global Urbanization Growth

    4.6. Market Dynamics

        4.6.1. Market Driving Factors and Impact Assessment

        4.6.2. Prominent Market Challenges and Impact Assessment

        4.6.3. Market Opportunities

        4.6.4. Prominent Trends in the Global Market & Their Impact Assessment

    4.7. Value Chain Analysis

        4.7.1. List of Key Manufacturers

        4.7.2. List of Channel Partners

        4.7.3. Operating Margins

        4.7.4. Notes on Value Added at Each Node in the Value Chain

5. Key Success Factors 

    5.1. Manufacturers’ Focus on Low Penetration High Growth Markets

    5.2. Banking on with Segments High Incremental Opportunity

    5.3. Peer Benchmarking

6. Global Market Demand Analysis 2015 to 2022 and Forecast, 2022 to 2032

    6.1. Historical Market Analysis, 2015 to 2022

    6.2. Current and Future Market Projections, 2022 to 2032

    6.3. Y-o-Y Growth Trend Analysis

7. Global Market Value Analysis 2015 to 2022 and Forecast, 2022 to 2032

    7.1. Historical Market Value (US$ Million) Analysis, 2015 to 2022

    7.2. Current and Future Market Value (US$ Million) Projections, 2022 to 2032

        7.2.1. Y-o-Y Growth Trend Analysis

        7.2.2. Absolute $ Opportunity Analysis

8. Global Market Analysis 2015 to 2022 and Forecast 2022 to 2032, By Organization Size

    8.1. Introduction / Key Findings

    8.2. Historical Market Size (US$ Million) Analysis By Organization Size, 2015 to 2022

    8.3. Current and Future Market Size (US$ Million) Analysis and Forecast By Organization Size, 2022 to 2032

        8.3.1. Large Enterprises

        8.3.2. SMEs

    8.4. Market Attractiveness Analysis By Organization Size

9. Global Market Analysis 2015 to 2022 and Forecast 2022 to 2032, By Service Type

    9.1. Introduction / Key Findings

    9.2. Historical Market Size (US$ Million) Analysis By Service Type, 2015 to 2022

    9.3. Current and Future Market Size (US$ Million) Analysis and Forecast By Service Type, 2022 to 2032

        9.3.1. Managed Services

        9.3.2. Professional Services

        9.3.3. Connectivity and Data Storage Services

    9.4. Market Attractiveness Analysis By Service Type

10. Global Market Analysis 2015 to 2022 and Forecast 2022 to 2032, By Industry Vertical

    10.1. Introduction / Key Findings

    10.2. Historical Market Size (US$ Million) Analysis By Industry Vertical, 2015 to 2022

    10.3. Current and Future Market Size (US$ Million) Analysis and Forecast By Industry Vertical, 2022 to 2032

        10.3.1. Retail

        10.3.2. Manufacturing

        10.3.3. Healthcare

        10.3.4. Automotive

        10.3.5. Consumer Electronics

        10.3.6. Energy and Mining

        10.3.7. Transportation and Logistics

        10.3.8. Oil and Gas

        10.3.9. Others (Education, Hospitality)

    10.4. Market Attractiveness Analysis By Industry Vertical

11. Global Market Analysis 2015 to 2022 and Forecast 2022 to 2032, by Region

    11.1. Introduction

    11.2. Historical Market Size (US$ Million) Analysis By Region, 2015 to 2022

    11.3. Current Market Size (US$ Million) & Analysis and Forecast By Region, 2022 to 2032

        11.3.1. North America

        11.3.2. South America

        11.3.3. Europe

        11.3.4. Asia Pacific

        11.3.5. Middle East & Africa

    11.4. Market Attractiveness Analysis By Region

12. North America Market Analysis 2015 to 2022 and Forecast 2022 to 2032

    12.1. Introduction

    12.2. Pricing Analysis

    12.3. Historical Value (US$ Million) Trend Analysis By Market Taxonomy, 2015 to 2022

    12.4. Value (US$ Million) & Forecast By Market Taxonomy, 2022 to 2032

        12.4.1. By Country

            12.4.1.1. United States of America

            12.4.1.2. Canada

        12.4.2. By Organization Size

        12.4.3. By Industry Vertical

        12.4.4. By Service Type

    12.5. Market Attractiveness Analysis

        12.5.1. By Country

        12.5.2. By Organization Size

        12.5.3. By Industry Vertical

        12.5.4. By Service Type

13. South America Market Analysis 2015 to 2022 and Forecast 2022 to 2032

    13.1. Introduction

    13.2. Pricing Analysis

    13.3. Historical Value (US$ Million) Trend Analysis By Market Taxonomy, 2015 to 2022

    13.4. Value (US$ Million) & Forecast By Market Taxonomy, 2022 to 2032

        13.4.1. By Country

            13.4.1.1. Brazil

            13.4.1.2. Argentina

            13.4.1.3. Rest of South America

        13.4.2. By Organization Size

        13.4.3. By Industry Vertical

        13.4.4. By Service Type

    13.5. Market Attractiveness Analysis

        13.5.1. By Country

        13.5.2. By Organization Size

        13.5.3. By Industry Vertical

        13.5.4. By Service Type

14. Europe Market Analysis 2015 to 2022 and Forecast 2022 to 2032

    14.1. Introduction

    14.2. Pricing Analysis

    14.3. Historical Value (US$ Million) Trend Analysis By Market Taxonomy, 2015 to 2022

    14.4. Value (US$ Million) & Forecast By Market Taxonomy, 2022 to 2032

        14.4.1. By Country

            14.4.1.1. Germany

            14.4.1.2. France

            14.4.1.3. United Kingdom

            14.4.1.4. Rest of Europe

        14.4.2. By Organization Size

        14.4.3. By Industry Vertical

        14.4.4. By Service Type

    14.5. Market Attractiveness Analysis

        14.5.1. By Country

        14.5.2. By Organization Size

        14.5.3. By Industry Vertical

        14.5.4. By Service Type

15. Asia Pacific Market Analysis 2015 to 2022 and Forecast 2022 to 2032

    15.1. Introduction

    15.2. Pricing Analysis

    15.3. Historical Value (US$ Million) Trend Analysis By Market Taxonomy, 2015 to 2022

    15.4. Value (US$ Million) & Forecast By Market Taxonomy, 2022 to 2032

        15.4.1. By Country

            15.4.1.1. China

            15.4.1.2. Japan

            15.4.1.3. India

            15.4.1.4. Rest of Asia Pacific

        15.4.2. By Organization Size

        15.4.3. By Industry Vertical

        15.4.4. By Service Type

    15.5. Market Attractiveness Analysis

        15.5.1. By Country

        15.5.2. By Organization Size

        15.5.3. By Industry Vertical

        15.5.4. By Service Type

16. Middle East and Africa Market Analysis 2015 to 2022 and Forecast 2022 to 2032

    16.1. Introduction

    16.2. Pricing Analysis

    16.3. Historical Value (US$ Million) Trend Analysis By Market Taxonomy, 2015 to 2022

    16.4. Value (US$ Million) & Forecast By Market Taxonomy, 2022 to 2032

        16.4.1. By Country

            16.4.1.1. GCC

            16.4.1.2. South Africa

            16.4.1.3. Rest of Middle East and Africa

        16.4.2. By Organization Size

        16.4.3. By Industry Vertical

        16.4.4. By Service Type

    16.5. Market Attractiveness Analysis

        16.5.1. By Country

        16.5.2. By Organization Size

        16.5.3. By Industry Vertical

        16.5.4. By Service Type

17. Key Countries Market Analysis 2015 to 2022 and Forecast 2022 to 2032

    17.1. Introduction

        17.1.1. Market Value Proportion Analysis, By Key Countries

        17.1.2. Global Vs. Country Growth Comparison

    17.2. US Market Analysis

        17.2.1. Value Proportion Analysis by Market Taxonomy

        17.2.2. Value & Analysis and Forecast by Market Taxonomy, 2015 to 2032

            17.2.2.1. By Organization Size

            17.2.2.2. By Industry Vertical

            17.2.2.3. By Service Type

    17.3. Canada Market Analysis

        17.3.1. Value Proportion Analysis by Market Taxonomy

        17.3.2. Value & Analysis and Forecast by Market Taxonomy, 2015 to 2032

            17.3.2.1. By Organization Size

            17.3.2.2. By Industry Vertical

            17.3.2.3. By Service Type

    17.4. Argentina Market Analysis

        17.4.1. Value Proportion Analysis by Market Taxonomy

        17.4.2. Value & Analysis and Forecast by Market Taxonomy, 2015 to 2032

            17.4.2.1. By Organization Size

            17.4.2.2. By Industry Vertical

            17.4.2.3. By Service Type

    17.5. Brazil Market Analysis

        17.5.1. Value Proportion Analysis by Market Taxonomy

        17.5.2. Value & Analysis and Forecast by Market Taxonomy, 2015 to 2032

            17.5.2.1. By Organization Size

            17.5.2.2. By Industry Vertical

            17.5.2.3. By Service Type

    17.6. Germany Market Analysis

        17.6.1. Value Proportion Analysis by Market Taxonomy

        17.6.2. Value & Analysis and Forecast by Market Taxonomy, 2015 to 2032

            17.6.2.1. By Organization Size

            17.6.2.2. By Industry Vertical

            17.6.2.3. By Service Type

    17.7. France Market Analysis

        17.7.1. Value Proportion Analysis by Market Taxonomy

        17.7.2. Value & Analysis and Forecast by Market Taxonomy, 2015 to 2032

            17.7.2.1. By Organization Size

            17.7.2.2. By Industry Vertical

            17.7.2.3. By Service Type

    17.8. UK Market Analysis

        17.8.1. Value Proportion Analysis by Market Taxonomy

        17.8.2. Value & Analysis and Forecast by Market Taxonomy, 2015 to 2032

            17.8.2.1. By Organization Size

            17.8.2.2. By Industry Vertical

            17.8.2.3. By Service Type

    17.9. India Market Analysis

        17.9.1. Value Proportion Analysis by Market Taxonomy

        17.9.2. Value & Analysis and Forecast by Market Taxonomy, 2015 to 2032

            17.9.2.1. By Organization Size

            17.9.2.2. By Industry Vertical

            17.9.2.3. By Service Type

    17.10. China Market Analysis

        17.10.1. Value Proportion Analysis by Market Taxonomy

        17.10.2. Value & Analysis and Forecast by Market Taxonomy, 2015 to 2032

            17.10.2.1. By Organization Size

            17.10.2.2. By Industry Vertical

            17.10.2.3. By Service Type

    17.11. Japan Countries Market Analysis

        17.11.1. Value Proportion Analysis by Market Taxonomy

        17.11.2. Value & Analysis and Forecast by Market Taxonomy, 2015 to 2032

            17.11.2.1. By Organization Size

            17.11.2.2. By Industry Vertical

            17.11.2.3. By Service Type

    17.12. GCC Market Analysis

        17.12.1. Value Proportion Analysis by Market Taxonomy

        17.12.2. Value & Analysis and Forecast by Market Taxonomy, 2015 to 2032

            17.12.2.1. By Organization Size

            17.12.2.2. By Industry Vertical

            17.12.2.3. By Service Type

    17.13. South Africa Market Analysis

        17.13.1. Value Proportion Analysis by Market Taxonomy

        17.13.2. Value & Analysis and Forecast by Market Taxonomy, 2015 to 2032

            17.13.2.1. By Organization Size

            17.13.2.2. By Industry Vertical

            17.13.2.3. By Service Type

18. Market Structure Analysis

    18.1. Market Analysis by Tier of Companies

    18.2. Market Concentration

    18.3. Market Share Analysis of Top Players

    18.4. Market Presence Analysis

        18.4.1. By Regional Footprint of Players

        18.4.2. Product Footprint by Players

        18.4.3. Channel Footprint by Players

19. Competition Analysis

    19.1. Competition Dashboard

    19.2. Competition Benchmarking

    19.3. Competition Deep Dive

        19.3.1. EE limited

            19.3.1.1. Overview

            19.3.1.2. Product Portfolio

            19.3.1.3. Sales Footprint

            19.3.1.4. Strategy Overview

        19.3.2. AT&T

        19.3.3. Gemalto NV

        19.3.4. PTC

        19.3.5. Oracle

        19.3.6. Ericsson AB

        19.3.7. VERIZON COMMUNICATIONS INC

        19.3.8. Deutsche Telekom AG

        19.3.9. Vodafone + telefonica

        19.3.10. Aeris

20. Assumptions and Acronyms Used

21. Research Methodology

Don't pay for what you don't need

Customize your report by selecting specific countries or regions and save 30%!

List of Tables

Table 1: Global Value (US$ Million), By Organization Size, 2015 to 2022

Table 2: Global Value (US$ Million), By Organization Size, 2022 to 2032

Table 3: Global Value (US$ Million), By Industry Vertical, 2015 to 2022

Table 4: Global Value (US$ Million), By Industry Vertical, 2022 to 2032

Table 5: Global Value (US$ Million), By Service Type, 2015 to 2022

Table 6: Global Value (US$ Million), By Service Type, 2022 to 2032

Table 7: Global Market, By Region, 2015 to 2022

Table 8: Global Market, By Region, 2022 to 2032

Table 9: North America Value (US$ Million), By Organization Size, 2015 to 2022

Table 10: North America Value (US$ Million), By Organization Size, 2022 to 2032

Table 11: North America Value (US$ Million), By Industry Vertical, 2015 to 2022

Table 12: North America Value (US$ Million), By Industry Vertical, 2022 to 2032

Table 13: North America Value (US$ Million), By Service Type, 2015 to 2022

Table 14: North America Value (US$ Million), By Service Type, 2022 to 2032

Table 15: North America Market, By Country, 2015 to 2022

Table 16: North America Market, By Country, 2022 to 2032

Table 17: South America Value (US$ Million), By Organization Size, 2015 to 2022

Table 18: South America Value (US$ Million), By Organization Size, 2022 to 2032

Table 19: South America Value (US$ Million), By Industry Vertical, 2015 to 2022

Table 20: South America Value (US$ Million), By Industry Vertical, 2022 to 2032

Table 21: South America Value (US$ Million), By Service Type, 2015 to 2022

Table 22: South America Value (US$ Million), By Service Type, 2022 to 2032

Table 23: South America Market, By Country, 2015 to 2022

Table 24: South America Market, By Country, 2022 to 2032

Table 25: Europe Value (US$ Million), By Organization Size, 2015 to 2022

Table 26: Europe Value (US$ Million), By Organization Size, 2022 to 2032

Table 27: Europe Value (US$ Million), By Industry Vertical, 2015 to 2022

Table 28: Europe Value (US$ Million), By Industry Vertical, 2022 to 2032

Table 29: Europe Value (US$ Million), By Service Type, 2015 to 2022

Table 30: Europe Value (US$ Million), By Service Type, 2022 to 2032

Table 31: Europe Market, By Country, 2015 to 2022

Table 32: Europe Market, By Country, 2022 to 2032

Table 33: Asia Pacific Value (US$ Million), By Organization Size, 2015 to 2022

Table 34: Asia Pacific Value (US$ Million), By Organization Size, 2022 to 2032

Table 35: Asia Pacific Value (US$ Million), By Industry Vertical, 2015 to 2022

Table 36: Asia Pacific Value (US$ Million), By Industry Vertical, 2022 to 2032

Table 37: Asia Pacific Value (US$ Million), By Service Type, 2015 to 2022

Table 38: Asia Pacific Value (US$ Million), By Service Type, 2022 to 2032

Table 39: Asia Pacific Market, By Country, 2015 to 2022

Table 40: Asia Pacific Market, By Country, 2022 to 2032

Table 41: Middle East and Africa Value (US$ Million), By Organization Size, 2015 to 2022

Table 42: Middle East and Africa Value (US$ Million), By Organization Size, 2022 to 2032

Table 43: Middle East and Africa Value (US$ Million), By Industry Vertical, 2015 to 2022

Table 44: Middle East and Africa Value (US$ Million), By Industry Vertical, 2022 to 2032

Table 45: Middle East and Africa Value (US$ Million), By Service Type, 2015 to 2022

Table 46: Middle East and Africa Value (US$ Million), By Service Type, 2022 to 2032

Table 47: Middle East and Africa Market, By Country, 2015 to 2022

Table 48: Middle East and Africa Market, By Country, 2022 to 2032

Table 49: Global Market Incremental $ Opportunity, By Organization Size, 2015 to 2022

Table 50: Global Market Incremental $ Opportunity, By Industry Vertical, 2022 to 2032

Table 51: Global Market Incremental $ Opportunity, By Service Type, 2015 to 2022

Table 52: Global Market Incremental $ Opportunity, by Region, 2022 to 2032

Table 53: North America Market Incremental $ Opportunity, By Organization Size, 2015 to 2022

Table 54: North America Market Incremental $ Opportunity, By Industry Vertical, 2022 to 2032

Table 55: North America Market Incremental $ Opportunity, By Service Type, 2015 to 2022

Table 56: North America Market Incremental $ Opportunity, by Country, 2022 to 2032

Table 57: South America Market Incremental $ Opportunity, By Organization Size, 2015 to 2022

Table 58: South America Market Incremental $ Opportunity, By Industry Vertical, 2022 to 2032

Table 59: South America Market Incremental $ Opportunity, By Service Type, 2015 to 2022

Table 60: South America Market Incremental $ Opportunity, by Country, 2022 to 2032

Table 61: Europe Market Incremental $ Opportunity, By Organization Size, 2015 to 2022

Table 62: Europe Market Incremental $ Opportunity, By Industry Vertical, 2022 to 2032

Table 63: Europe Market Incremental $ Opportunity, By Service Type, 2015 to 2022

Table 64: Europe Market Incremental $ Opportunity, by Country, 2022 - 2032

Table 65: Asia Pacific Market Incremental $ Opportunity, By Organization Size, 2015 to 2022

Table 66: Asia Pacific Market Incremental $ Opportunity, By Industry Vertical, 2022 to 2032

Table 67: Asia Pacific Market Incremental $ Opportunity, By Service Type, 2015 to 2022

Table 68: Asia Pacific Market Incremental $ Opportunity, by Country, 2022 to 2032

Table 69: Middle East and Africa Market Incremental $ Opportunity, By Organization Size, 2015 to 2022

Table 70: Middle East and Africa Market Incremental $ Opportunity, By Industry Vertical, 2022 to 2032

Table 71: Middle East and Africa Market Incremental $ Opportunity, By Service Type, 2015 to 2022

Table 72: Middle East and Africa Market Incremental $ Opportunity, by Country, 2022 to 2032
Sudip Saha
Sudip Saha

Principal Consultant

Talk to Analyst

Find your sweet spots for generating winning opportunities in this market.

List of Charts

Figure 1: Global Market Value (US$ Million) and Year-on-Year Growth, 2015 to 2032

Figure 2: Global Market Absolute $ Historical Gain (2015 to 2022) and Opportunity (2022 to 2032), US$ Million

Figure 3: Global Market Share, By Organization Size, 2022 & 2032

Figure 4: Global Market Y-o-Y Growth Projections, Organization Size - 2022 to 2032

Figure 5: Global Market Attractiveness Index, Organization Size - 2022 to 2032

Figure 6: Global Market Share, By Industry Vertical, 2022 & 2032

Figure 7: Global Market Y-o-Y Growth Projections, By Industry Vertical - 2022 to 2032

Figure 8: Global Market Attractiveness Index, By Industry Vertical - 2022 to 2032

Figure 9: Global Market Share, By Service Type, 2022 & 2032

Figure 10: Global Market Y-o-Y Growth Projections, By Service Type - 2022 to 2032

Figure 11: Global Market Attractiveness Index, By Service Type - 2022 to 2032

Figure 12: Global Market Share, By Service Type, 2022 & 2032

Figure 13: Global Market Y-o-Y Growth Projections, By Service Type - 2022 to 2032

Figure 14: Global Market Attractiveness Index, By Service Type - 2022 to 2032

Figure 15: Global Market Share, by Region, 2022 & 2032

Figure 16: Global Market Y-o-Y Growth Projections, by Region - 2022 to 2032

Figure 17: Global Market Attractiveness Index, by Region - 2022 to 2032

Figure 18: North America Market Value (US$ Million) and Year-on-Year Growth, 2015 to 2032

Figure 19: North America Market Absolute $ Opportunity Historical (2015 to 2022) and Forecast Period (2022 to 2032), US$ Million

Figure 20: North America Market Share, Organization Size, 2022 & 2032

Figure 21: North America Market Y-o-Y Growth Projections, Organization Size - 2022 to 2032

Figure 22: North America Market Attractiveness Index, Organization Size - 2022 to 2032

Figure 23: North America Market Share, By Industry Vertical, 2022 & 2032

Figure 24: North America Market Y-o-Y Growth Projections, By Industry Vertical - 2022 to 2032

Figure 25: North America Market Attractiveness Index, By Industry Vertical - 2022 to 2032

Figure 26: North America Market Share, By Service Type, 2022 & 2032

Figure 27: North America Market Y-o-Y Growth Projections, By Service Type - 2022 to 2032

Figure 28: North America Market Attractiveness Index, By Service Type - 2022 to 2032

Figure 29: North America Market Share, By Service Type, 2022 & 2032

Figure 30: North America Market Y-o-Y Growth Projections, By Service Type - 2022 to 2032

Figure 31: North America Market Attractiveness Index, By Service Type - 2022 to 2032

Figure 32: North America Market Share, by Country, 2022 & 2032

Figure 33: North America Market Y-o-Y Growth Projections, by Country - 2022 to 2032

Figure 34: North America Market Attractiveness Index, by Country - 2022 to 2032

Figure 35: South America Market Value (US$ Million) and Year-on-Year Growth, 2015 to 2032

Figure 36: South America Market Absolute $ Opportunity Historical (2015 to 2022) and Forecast Period (2022 to 2032), US$ Million

Figure 37: South America Market Share, Organization Size, 2022 & 2032

Figure 38: South America Market Y-o-Y Growth Projections, Organization Size - 2022 to 2032

Figure 39: South America Market Attractiveness Index, Organization Size - 2022 to 2032

Figure 40: South America Market Share, By Industry Vertical, 2022 & 2032

Figure 41: South America Market Y-o-Y Growth Projections, By Industry Vertical - 2022 to 2032

Figure 42: South America Market Attractiveness Index, By Industry Vertical - 2022 to 2032

Figure 43: South America Market Share, By Service Type, 2022 & 2032

Figure 44: South America Market Y-o-Y Growth Projections, By Service Type - 2022 to 2032

Figure 45: South America Market Attractiveness Index, By Service Type - 2022 to 2032

Figure 46: South America Market Share, By Service Type, 2022 & 2032

Figure 47: South America Market Y-o-Y Growth Projections, By Service Type - 2022 to 2032

Figure 48: South America Market Attractiveness Index, By Service Type - 2022 to 2032

Figure 49: South America Market Share, by Country, 2022 & 2032

Figure 50: South America Market Y-o-Y Growth Projections, by Country - 2022 to 2032

Figure 51: South America Market Attractiveness Index, by Country - 2022 to 2032

Figure 52: Europe Market Value (US$ Million) and Year-on-Year Growth, 2015 to 2032

Figure 53: Europe Market Absolute $ Opportunity Historical (2015 to 2022) and Forecast Period (2022 to 2032), US$ Million

Figure 54: Europe Market Share, Organization Size, 2022 & 2032

Figure 55: Europe Market Y-o-Y Growth Projections, Organization Size - 2022 to 2032

Figure 56: Europe Market Attractiveness Index, Organization Size - 2022 to 2032

Figure 57: Europe Market Share, By Industry Vertical, 2022 & 2032

Figure 58: Europe Market Y-o-Y Growth Projections, By Industry Vertical - 2022 to 2032

Figure 59: Europe Market Attractiveness Index, By Industry Vertical - 2022 to 2032

Figure 60: Europe Market Share, By Service Type, 2022 & 2032

Figure 61: Europe Market Y-o-Y Growth Projections, By Service Type - 2022 to 2032

Figure 62: Europe Market Attractiveness Index, By Service Type - 2022 to 2032

Figure 63: Europe Market Share, By Service Type, 2022 & 2032

Figure 64: Europe Market Y-o-Y Growth Projections, By Service Type - 2022 to 2032

Figure 65: Europe Market Attractiveness Index, By Service Type - 2022 to 2032

Figure 66: Europe Market Share, by Country, 2022 & 2032

Figure 67: Europe Market Y-o-Y Growth Projections, by Country - 2022 to 2032

Figure 68: Europe Market Attractiveness Index, by Country - 2022 to 2032

Figure 69: MEA Market Value (US$ Million) and Year-on-Year Growth, 2015 to 2032

Figure 70: MEA Market Absolute $ Opportunity Historical (2015 to 2022) and Forecast Period (2022 to 2032), US$ Million

Figure 71: MEA Market Share, Organization Size, 2022 & 2032

Figure 72: MEA Market Y-o-Y Growth Projections, Organization Size - 2022 to 2032

Figure 73: MEA Market Attractiveness Index, Organization Size - 2022 to 2032

Figure 74: MEA Market Share, By Industry Vertical, 2022 & 2032

Figure 75: MEA Market Y-o-Y Growth Projections, By Industry Vertical - 2022 to 2032

Figure 76: MEA Market Attractiveness Index, By Industry Vertical - 2022 to 2032

Figure 77: MEA Market Share, By Service Type, 2022 & 2032

Figure 78: MEA Market Y-o-Y Growth Projections, By Service Type - 2022 to 2032

Figure 79: MEA Market Attractiveness Index, By Service Type - 2022 to 2032

Figure 80: MEA Market Share, By Service Type, 2022 & 2032

Figure 81: MEA Market Y-o-Y Growth Projections, By Service Type - 2022 to 2032

Figure 82: MEA Market Attractiveness Index, By Service Type - 2022 to 2032

Figure 83: MEA Market Share, by Country, 2022 & 2032

Figure 84: MEA Market Y-o-Y Growth Projections, by Country - 2022 to 2032

Figure 85: MEA Market Attractiveness Index, by Country - 2022 to 2032

Figure 86: Asia Pacific Market Value (US$ Million) and Year-on-Year Growth, 2015  to 2030

Figure 87: Asia Pacific Market Absolute $ Opportunity Historical (2016 to 2019) and Forecast Period (2020 to 2030), US$ Million

Figure 88: Asia Pacific Market Share, Organization Size, 2022 & 2032

Figure 89: Asia Pacific Market Y-o-Y Growth Projections, Organization Size - 2022 to 2032

Figure 90: Asia Pacific Market Attractiveness Index, Organization Size - 2022 to 2032

Figure 91: Asia Pacific Market Share, By Industry Vertical, 2022 & 2032

Figure 92: Asia Pacific Market Y-o-Y Growth Projections, By Industry Vertical - 2022 to 2032

Figure 93: Asia Pacific Market Attractiveness Index, By Industry Vertical - 2022 to 2032

Figure 94: Asia Pacific Market Share, By Service Type, 2022 & 2032

Figure 95: Asia Pacific Market Y-o-Y Growth Projections, By Service Type - 2022 to 2032

Figure 96: Asia Pacific Market Attractiveness Index, By Service Type - 2022 to 2032

Figure 97: Asia Pacific Market Share, By Service Type, 2022 & 2032

Figure 98: Asia Pacific Market Y-o-Y Growth Projections, By Service Type - 2022 to 2032

Figure 99: Asia Pacific Market Attractiveness Index, By Service Type - 2022 to 2032

Figure 100: Asia Pacific Market Share, by Country, 2022 & 2032

Figure 101: Asia Pacific Market Y-o-Y Growth Projections, by Country - 2022 to 2032

Figure 102: Asia Pacific Market Attractiveness Index, by Country - 2022 to 2032

Figure 103: US Market Value (US$ Million) and Forecast, 2022 to 2032

Figure 104: US Market Share, Organization Size, 2022

Figure 105: US Market Share, By Industry Vertical, 2022

Figure 106: US Market Share, By Service Type, 2022

Figure 107: Canada Market Value (US$ Million) and Forecast, 2022 to 2032

Figure 108: Canada Market Share, Organization Size, 2022

Figure 109: Canada Market Share, By Industry Vertical, 2022

Figure 110: Canada Market Share, By Service Type, 2022

Figure 111: Brazil Market Value (US$ Million) and Forecast, 2022 to 2032

Figure 112: Brazil Market Share, Organization Size, 2022

Figure 113: Brazil Market Share, By Industry Vertical, 2022

Figure 114: Brazil Market Share, By Service Type, 2022

Figure 115: Argentina Market Value (US$ Million) and Forecast, 2022 to 2032

Figure 116: Argentina Market Share, Organization Size, 2022

Figure 117: Argentina Market Share, By Industry Vertical, 2022

Figure 118: Argentina Market Share, By Service Type, 2022

Figure 119: Germany Market Value (US$ Million) and Forecast, 2022 to 2032

Figure 120: Germany Market Share, Organization Size, 2022

Figure 121: Germany Market Share, By Industry Vertical, 2022

Figure 122: Germany Market Share, By Service Type, 2022

Figure 123: UK Market Value (US$ Million) and Forecast, 2022 to 2032

Figure 124: UK Market Share, Organization Size, 2022

Figure 125: UK Market Share, By Industry Vertical, 2022

Figure 126: UK Market Share, By Service Type, 2022

Figure 127: France Market Value (US$ Million) and Forecast, 2022 to 2032

Figure 128: France Market Share, Organization Size, 2022

Figure 129: France Market Share, By Industry Vertical, 2022

Figure 130: France Market Share, By Service Type, 2022

Figure 131: China Market Value (US$ Million) and Forecast, 2022 to 2032

Figure 132: China Market Share, Organization Size, 2022

Figure 133: China Market Share, By Industry Vertical, 2022

Figure 134: China Market Share, By Service Type, 2022

Figure 135: Japan Market Value (US$ Million) and Forecast, 2022 to 2032

Figure 136: Japan Market Share, Organization Size, 2022

Figure 137: Japan Market Share, By Industry Vertical, 2022

Figure 138: Japan Market Share, By Service Type, 2022

Figure 139: India Market Value (US$ Million) and Forecast, 2022 to 2032

Figure 140: India Market Share, Organization Size, 2022

Figure 141: India Market Share, By Industry Vertical, 2022

Figure 142: India Market Share, By Service Type, 2022

Figure 143: India Market Value (US$ Million) and Forecast, 2022 to 2032

Figure 144: India Market Share, Organization Size, 2022

Figure 145: India Market Share, By Industry Vertical, 2022

Figure 146: India Market Share, By Service Type, 2022

Figure 147: GCC Countries Market Value (US$ Million) and Forecast, 2022 to 2032

Figure 148: GCC Countries Market Share, Organization Size, 2022

Figure 149: GCC Countries Market Share, By Industry Vertical, 2022

Figure 150: GCC Countries Market Share, By Service Type, 2022

Figure 151: South Africa Market Value (US$ Million) and Forecast, 2022 to 2032

Figure 152: South Africa Market Share, Organization Size, 2022

Figure 153: South Africa Market Share, By Industry Vertical, 2022

Figure 154: South Africa Market Share, By Service Type, 2022

Recommendations

Technology

Audio Conferencing Services Market

Published : September 2022

Technology

VOIP Services Market

Published : September 2022

Technology

Telecommunications Services Market

Published : September 2022

Technology

Russian IT Software and Services Market

Published : December 2014

Explore Technology Insights

View Reports