AI Legal Services Market Size and Share Forecast Outlook 2025 to 2035

The Global AI Legal Services Market is expected to record a valuation of USD 1,742.3 million in 2025 and USD 10,431.6 million in 2035, with an increase of USD 8,689.3 million, which equals a growth of ~499% over the decade. The overall expansion represents a CAGR of 19.6% and a ~6X increase in market size.
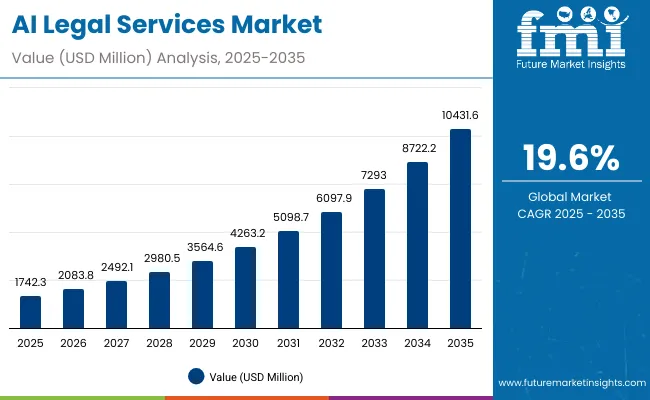
Quick Stats for Global AI Legal Services Market

  • Global AI Legal Services Market Value (2025): USD 1,742.3 million
  • Global AI Legal Services Market Forecast Value (2035): USD 10,431.6 million
  • Global AI Legal Services Market Forecast CAGR: 19.6%
  • Leading Segment in Global AI Legal Services Market in 2025: Law Firms (46.9%)
  • Key Growth Regions in the Global AI Legal Services Market: North America, Asia-Pacific, Europe
  • Top Key Players in Global AI Legal Services Market: Thomson Reuters Corporation, LexisNexis Legal & Professional, Relativity ODA LLC, Everlaw Inc., Evisort Inc., Luminance Technologies Ltd., DISCO Inc., Casetext Inc., Kira Systems Inc., Ironclad Inc., ContractPod Technologies Ltd., Lawgeex Technologies Ltd., Onit Inc., Lexion Inc., ThoughtRiver Ltd.

Ai Legal Services Market

Global AI Legal Services Market Key Takeaways

Metric Value
Market Estimated Value in (2025E) USD 1,742.3 million
Market Forecast Value in (2035F) USD 10,431.6 million
Forecast CAGR (2025 to 2035) 19.6%

During the first five-year period from 2025 to 2030, the market increases from USD 1,742.3 million to USD 4,263.2 million, adding USD 2,520.9 million, which accounts for ~29% of the total decade growth. This phase records steady adoption in Legal Research & Analytics, Contract Lifecycle Management, and E-Discovery & Document Review, driven by the need for efficiency in legal workflows. Natural Language Processing & Generative AI dominates this period as it caters to over 40% of AI deployments requiring advanced document understanding, drafting, and summarization.

The second half from 2030 to 2035 contributes USD 6,168.4 million, equal to ~71% of total growth, as the market jumps from USD 4,263.2 million to USD 10,431.6 million. This acceleration is powered by widespread deployment of enterprise AI copilots, RAG-powered legal research, and automation of compliance and litigation support across global law firms, corporate legal departments, and public sector agencies.

Managed AI legal services and cloud-delivered legal AI platforms together capture a larger share above 50% by the end of the decade. Subscription-based analytics, compliance monitoring, and CLM automation add recurring revenue, increasing the service share beyond 50% in total value.

From 2020 to 2024, the Global AI Legal Services Market grew from an emerging stage to a multi-billion-dollar technology-driven sector, driven by software- and service-led adoption. During this period, the competitive landscape was dominated by major legal tech platforms controlling a large portion of revenue, with leaders such as Thomson Reuters and LexisNexis focusing on legal research, case analytics, and content access integration. Competitive differentiation relied on accuracy, content coverage, and workflow integration, while managed services were still in a nascent phase, contributing less than 15% of the total market value.

Demand for AI-driven legal services will expand to USD 1,742.3 million in 2025, and the revenue mix will shift as AI-powered software and managed services grow to over 50% share. Traditional legal tech leaders face rising competition from digital-first players offering LLM-based drafting, automated compliance, and AI-assisted litigation tools. Major incumbents are pivoting to hybrid models, integrating analytics, workflow automation, and enterprise copilots to retain relevance.

Emerging entrants specializing in cloud-native compliance tools, contract automation, and semantic legal search are gaining share. The competitive advantage is moving away from standalone AI features toward ecosystem strength, scalability, governance, and recurring revenue models.

Why the Global AI Legal Services Market is Growing?

Advances in NLP and generative AI have transformed legal workflows, enabling faster research, automated contract drafting, and compliance risk detection. AI-powered Legal Research & Analytics has gained popularity due to its suitability for rapid case law retrieval, predictive legal insights, and summarization. The rise of LLM-powered assistants has contributed to enhanced efficiency and decision-making capabilities. Law firms, corporate legal departments, ALSPs, and public sector agencies are driving demand for AI solutions that integrate seamlessly into existing legal and operational workflows.

Expansion of automation in e-discovery, compliance monitoring, and litigation support has fueled market growth. Innovations in cloud-based AI legal platforms, integrated CLM systems, and multilingual legal document review are expected to open new application areas. Segment growth is expected to be led by Law Firms in end users, Natural Language Processing & Generative AI in technology, and Legal Research & Analytics in service types due to their centrality in the legal process.

Segmental Analysis

The Global AI Legal Services Market is segmented by end user industry, service type, and technology. In end user industry, Law Firms hold the largest share at 46.9% in 2025, driven by strong uptake of AI for legal research, drafting, and case analytics. Tier 1 firms lead adoption, followed by Tier 2 and boutique practices. Corporate Legal Departments form the second-largest group, with large enterprises adopting AI faster than mid-sized teams and SMEs.

ALSPs are expanding their AI capabilities for contract review and compliance services, while Public Sector and Judiciary agencies are beginning to integrate AI into court systems and regulatory tracking. By service type, Legal Research & Analytics dominates with 32.3% in 2025, supported by demand for AI-powered legal search, predictive analytics, and summarization tools. Contract Lifecycle Management (CLM) follows, with use cases in drafting, review, and compliance checks.

E-Discovery & Document Review benefits from predictive coding, translation, and evidence identification, while Litigation Support, Compliance & Regulatory Monitoring, and Billing & Matter Management represent smaller but growing areas. In technology, Natural Language Processing & Generative AI leads with 40.7% in 2025, powering document summarization, drafting, and conversational assistants. Machine Learning & Predictive Analytics ranks second, followed by Computer Vision, Robotic Process Automation + AI, and Knowledge Graphs & Semantic Search, which are gaining traction for document processing, workflow automation, and advanced search capabilities.
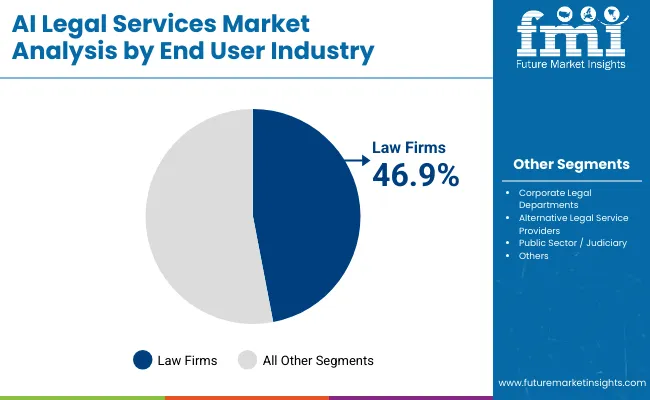
Insights into the End User Industry Segment with Law Firms Leading in Market Share

Ai Legal Services Market By End User

End User Industry Segment Market Value Share, 2025
Law Firms 46.9%
Others 53.1%

The Law Firms segment is projected to contribute 46.9% of the Global AI Legal Services Market revenue in 2025, maintaining its lead as the dominant end user category. This is driven by high adoption of AI for legal research, contract review, and litigation strategy among Tier 1 and Tier 2 firms. Large law firms are prioritizing investments in AI-powered tools to improve efficiency, reduce research time, and enhance client service delivery.

Growth in this segment is also supported by the integration of generative AI and machine learning into existing workflows, enabling automated document summarization, predictive case analytics, and clause standardization. As corporate clients demand faster turnaround times and greater cost transparency, law firms are leveraging AI to remain competitive. The segment is expected to retain its position as the primary driver of AI legal services adoption through the forecast period.
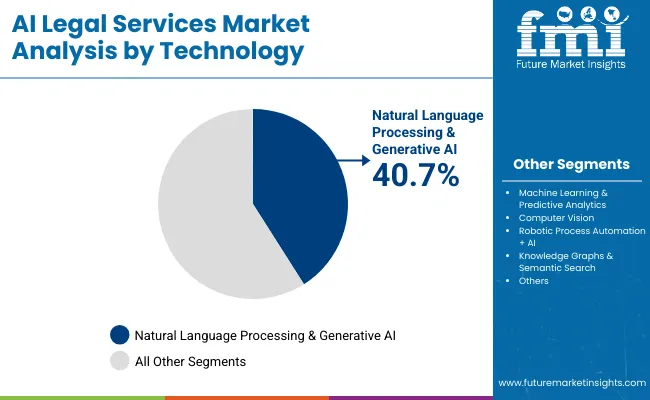
Insights into the Technology Segment with Natural Language Processing & Generative AI Leading in Market Share

Ai Legal Services Market By Technology

Technology Segment Market Value Share, 2025
Natural Language Processing & Generative AI 40.7%
Others 59.3%

The Natural Language Processing & Generative AI segment is forecasted to hold 40.7% of the Global AI Legal Services Market share in 2025, driven by its critical role in document drafting, summarization, and conversational legal assistants. These capabilities enable faster legal research, improved accuracy in case preparation, and more efficient handling of high-volume documentation. Advancements in large language models and domain-specific training for legal contexts are enhancing output quality, reducing error rates, and enabling multilingual processing. As legal professionals increasingly integrate generative AI into core operations, this technology is expected to remain at the forefront, underpinning a wide range of AI legal applications.
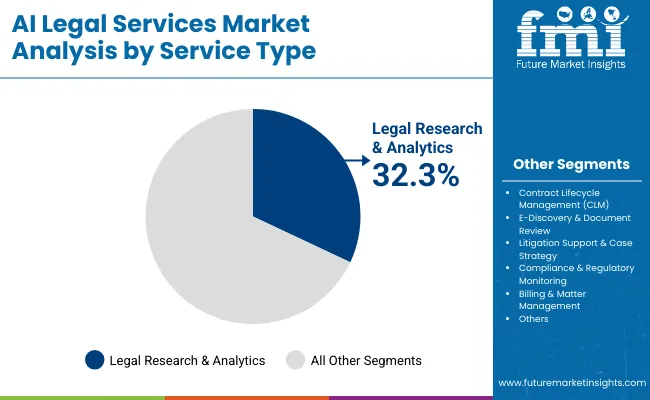
Insights into the Service Type Segment with Legal Research & Analytics Leading in Market Share

Ai Legal Services Market By Service

Service Type Segment Market Value Share, 2025
Legal Research & Analytics 32.3%
Others 67.7%

The Legal Research & Analytics segment is projected to account for 32.3% of the Global AI Legal Services Market revenue in 2025, establishing itself as the leading service type. This segment benefits from growing demand for AI-powered legal search, case law retrieval, predictive analytics, and knowledge management systems. These solutions help legal teams quickly identify relevant precedents, assess case outcomes, and synthesize large volumes of information. The adoption of AI in research and analytics is also enhancing compliance monitoring and risk assessment. With the continued expansion of legal datasets and the need for rapid, accurate insights, Legal Research & Analytics is expected to maintain its leading role in the market over the coming years.

What are the Drivers, Restraints, and Key Trends of the Global AI Legal Services Market?

Drivers

Shift from Point Tools to Enterprise-Integrated AI Legal Platforms

Law firms and corporate legal departments are moving away from standalone AI products toward integrated platforms that embed AI across research, contract lifecycle, compliance, and litigation support. This unified approach reduces tool-switching, enables cross-workflow data sharing, and delivers stronger ROI, particularly for Tier 1 firms managing high-volume, multi-jurisdictional matters. As procurement teams prioritize platform consolidation, vendors offering modular but integrated solutions are winning larger, multi-year contracts.

Adoption of Domain-Specific Large Language Models (LLMs) Trained on Proprietary Legal Corpora

Vendors are building LLMs fine-tuned on jurisdiction-specific statutes, case law, and legal commentary. These domain-specific models outperform general-purpose AI in accuracy and compliance, driving adoption in regulated environments like financial services, IP law, and government legal offices where precision is critical. Their ability to deliver explainable outputs and align with professional conduct rules is accelerating uptake among risk-conscious legal teams.

Restraints

Fragmentation of Legal Data Sources and Limited Interoperability

Many AI tools still struggle to integrate with legacy case management systems, billing platforms, and jurisdiction-specific databases. This lack of interoperability creates workflow bottlenecks and limits the scalability of AI solutions across multinational law firms. The problem is compounded when vendors rely on proprietary formats, making cross-platform collaboration more complex and costly.

High Cost of Customization and Compliance Readiness for Multi-Jurisdictional Deployment

Rolling out AI legal services in multiple countries often requires costly customization to meet local privacy laws, bar regulations, and data residency rules. This significantly increases time-to-value for global firms and can deter smaller practices from adoption. Additionally, the lack of standardized certification for AI legal tools in many jurisdictions forces firms to shoulder the compliance validation burden themselves.

Key Trends

Rise of AI-Augmented Alternative Legal Service Providers (ALSPs)

ALSPs are leveraging AI for large-scale document review, contract abstraction, and compliance monitoring, enabling them to undercut traditional law firms on cost and delivery time. This is reshaping client sourcing strategies, particularly for repeatable, high-volume legal tasks. As ALSPs mature technologically, their service portfolios are expanding into higher-margin advisory and analytics roles traditionally reserved for law firms.

Embedding AI Assistants into Client-Facing Legal Portals

Firms are integrating AI-driven chat interfaces into client portals to provide instant status updates, explain legal procedures, and surface relevant documents. This is transforming client engagement models and differentiating firms in competitive markets, especially in corporate law and M&A advisory. In many cases, these assistants are becoming the primary client touchpoint for routine queries, freeing lawyers to focus on high-value tasks.
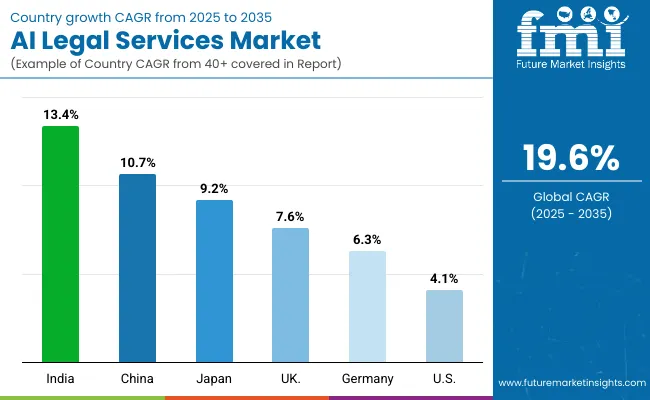
Analysis of Global AI Legal Services Market By Key Countries

Ai Legal Services Market By Country

The global AI Legal Services Market shows clear regional variation in adoption speed, influenced by the maturity of legal technology ecosystems, regulatory frameworks, and digital transformation priorities in legal services. Asia-Pacific emerges as the fastest-growing region, anchored by India at 13.4% CAGR and China at 10.7%.

India’s trajectory is driven by the rapid modernization of corporate legal departments, increasing use of AI for contract lifecycle management in multinational outsourcing hubs, and the expansion of legal tech startups offering subscription-based AI platforms. China’s growth reflects strong integration of AI into smart court initiatives, large-scale government-led digital justice programs, and rapid adoption of domain-specific LLMs trained on Chinese statutes and case law.

Europe maintains a balanced growth profile, led by the UK at 7.6% and Germany at 6.3%. Growth in these countries is supported by strict compliance mandates under the EU AI Act, high digital readiness among law firms, and strong demand for AI-powered compliance and risk management tools in heavily regulated sectors such as finance, healthcare, and manufacturing. UK-based law firms are early adopters of AI-powered legal research and predictive litigation analytics, while Germany’s corporate legal departments are leveraging AI for multilingual contract review and cross-border compliance.

North America shows steady but more mature market expansion, with the USA at 4.1% CAGR. The USA retains the largest global market share but its slower growth rate reflects high market penetration among large law firms and corporate legal teams. Growth is increasingly service-driven, with emphasis on managed AI legal services, cloud-native legal platforms, and client-facing AI assistants rather than initial technology adoption. Japan stands out in Asia with a 9.2% CAGR, driven by government-backed legal digitalization programs, a surge in AI pilot projects among corporate counsel, and increasing use of AI in IP law and patent filings to enhance speed and accuracy.
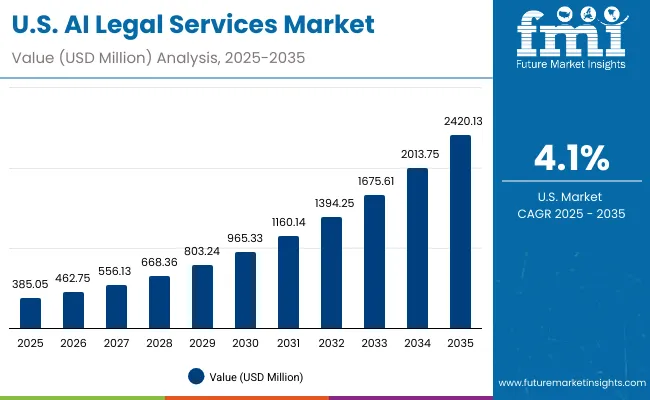
Sales Outlook for AI Legal Services in the United States

Ai Legal Services Market Usa

The AI Legal Services Market in the United States is projected to grow at a CAGR of 4.1%, led by strong adoption among large law firms, corporate legal departments, and public sector agencies. Large-scale integration of AI into legal research, contract management, and litigation strategy is driving recurring revenue streams for leading platforms. ALSPs in the USA are also scaling AI-driven document review and compliance services for cost-conscious clients. In-house legal teams are increasingly adopting AI copilots and semantic search tools to improve turnaround times and support cross-border compliance requirements.

  • USA law firms are embedding generative AI into client advisory workflows.
  • Corporate legal departments are expanding AI-powered contract lifecycle management.
  • ALSPs are using AI to deliver faster, more cost-efficient discovery and review services.

Growth and Expansion Outlook for AI Legal Services in the United Kingdom

The AI Legal Services Market in the United Kingdom is expected to grow at a CAGR of 7.6%, supported by strong uptake in legal research automation, predictive litigation analytics, and compliance monitoring. Magic Circle and top-tier regional firms are deploying LLM-based drafting and knowledge management tools to maintain competitive advantage. Public sector investment in AI-powered court systems and regulatory tracking is also driving demand. Cross-sector legal needs in finance, healthcare, and energy are fueling adoption of multilingual AI solutions.

  • UK-based law firms are integrating AI assistants for research and case preparation.
  • Regulatory bodies are deploying AI for compliance audits and risk scoring.
  • Public sector digital justice programs are embedding AI into case management systems.

Growth and Expansion Outlook for AI Legal Services in India

India is witnessing rapid growth in the AI Legal Services Market, which is forecast to expand at a CAGR of 13.4% through 2035. Mid-sized law firms and corporate legal teams in tier-2 cities are increasingly investing in AI solutions due to competitive pricing and cloud-based delivery models. Legal tech startups are offering subscription-based AI research tools, contract automation, and compliance monitoring tailored to the Indian regulatory framework. Government e-court initiatives are accelerating adoption in the public sector.
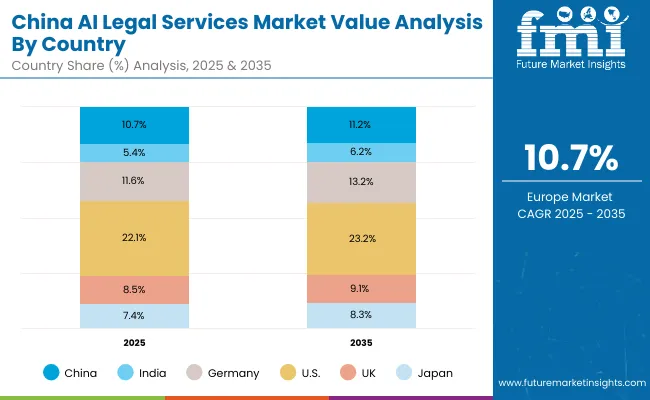
  • Affordable AI legal platforms are enabling adoption by mid-tier law firms.
  • Corporate counsel in export-oriented sectors are adopting AI for compliance readiness.
  • Digital court and e-filing programs are integrating AI for faster case resolution.

Sales Outlook for AI Legal Services in China

Ai Legal Services Market China

The AI Legal Services Market in China is expected to grow at a CAGR of 10.7%, among the fastest globally. This growth is fueled by smart court rollouts, city-level legal digitalization programs, and competitive innovation by domestic AI vendors. State-owned enterprises and large private companies are implementing AI-driven compliance monitoring, contract review, and dispute resolution tools. Local tech firms are developing LLMs trained on Chinese statutes and case law, improving output accuracy for domestic users.
  • Smart court programs are integrating AI for judgment drafting and evidence review.
  • Large enterprises are using AI for multilingual contract analysis and regulatory tracking.
  • Domestic AI vendors are offering competitively priced solutions tailored to local legal needs.

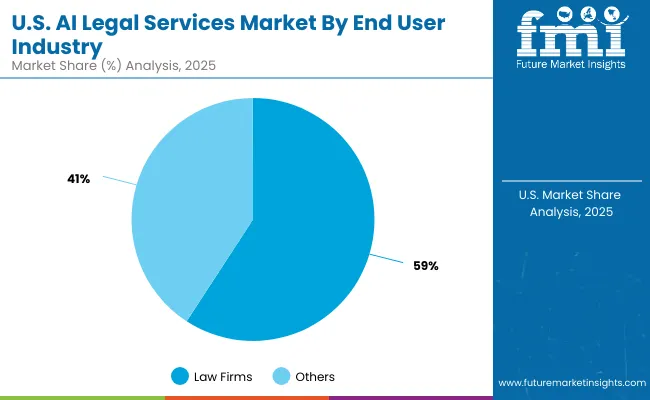
Opportunity Analysis of the United States AI Legal Services Market

Ai Legal Services Market Usa 2

End User Industry Segment Market Value Share, 2025
Law Firms 59.2%
Others 40.8%

The AI Legal Services Market in the United States is valued at USD 385.05 million in 2025, with Law Firms leading at 59.2%, followed by Others at 40.8%. The dominance of law firms is a direct outcome of the USA legal sector’s maturity and high willingness to invest in AI-powered solutions for legal research, litigation support, and contract lifecycle management. Top-tier firms are embedding generative AI into internal knowledge systems, enabling faster client advisory, improved case preparation, and predictive analytics for litigation outcomes.

This leadership positions law firms as the primary drivers of AI legal innovation in the country, with growing adoption of AI copilots, semantic search, and multilingual document review. Corporate legal departments and ALSPs are expanding at a steady pace, but the law firm segment continues to account for the largest revenue share due to larger budgets and more complex case requirements. Over the next decade, platform integration and managed AI services are expected to further solidify law firms’ position as the central growth engine of the USA market.
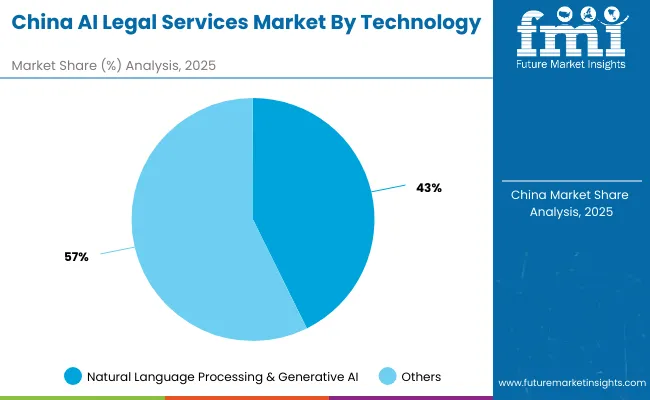
Opportunity Analysis of the China AI Legal Services Market

Ai Legal Services Market China 2

Technology Segment Market Value Share, 2025
Natural Language Processing & Generative AI 42.7%
Others 57.3%

The AI Legal Services Market in China is valued at USD 186.43 million in 2025, with Natural Language Processing & Generative AI leading at 42.7%, followed by other technologies at 57.3%. The strength of this segment is fueled by large-scale deployment of LLMs trained on Chinese statutes, case law, and administrative regulations, making them highly effective for domestic legal research, compliance monitoring, and judgment drafting in smart courts.

Government-backed legal digitalization programs are accelerating the integration of NLP-driven AI tools into court systems and public legal services, while top Chinese law firms and corporate legal departments are adopting AI assistants for multilingual document processing and automated risk assessments. As AI technology matures and integrates with compliance automation, the NLP & Generative AI segment is expected to expand its role in both public sector initiatives and private sector legal operations.
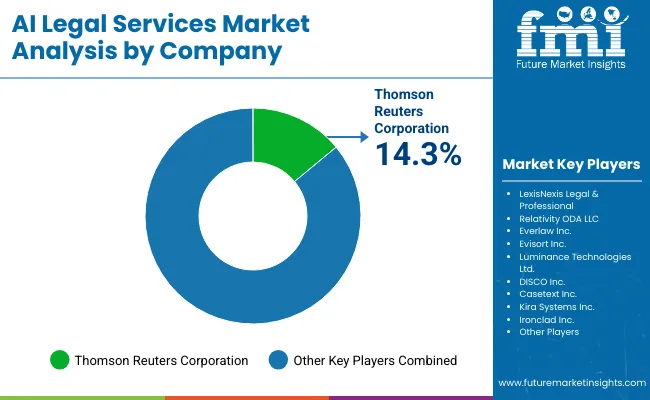
Competitive Landscape of the Global AI Legal Services Market

Ai Legal Services Market By Company

The AI Legal Services Market is moderately fragmented, with global leaders, regional innovators, and niche-focused providers competing across multiple service and technology areas. Thomson Reuters Corporation, holding a 14.3% global value share in 2025, leads the market through its integrated suite of AI-powered legal research, analytics, and contract lifecycle management platforms.

Its strategy emphasizes large language model (LLM) integration, cloud-native collaboration tools, and predictive analytics tailored for litigation and compliance. Other significant playersincluding LexisNexis Legal & Professional, Relativity ODA LLC, and Luminance Technologies Ltd.are focusing on combining natural language processing with workflow automation, enabling law firms and corporate legal departments to achieve faster case preparation, document review, and regulatory monitoring.

Specialized providers such as Evisort Inc., Casetext Inc., and ContractPod Technologies Ltd. are targeting high-growth niches like AI-driven contract drafting, clause extraction, and semantic search. Their ability to offer domain-specific models, API integrations, and flexible deployment options positions them as strong contenders in targeted segments. Competitive differentiation in this market is shifting from standalone software or technology capabilities toward fully integrated legal ecosystemscombining AI assistants, knowledge graphs, compliance dashboards, and subscription-based legal services that scale across diverse client needs.

Key Developments in Global AI Legal Services Market

  • On July 8, 2025, several top global law firmsincluding DLA Piper, Gibson Dunn, and Ropes & Grayannounced full integration of AI research and drafting assistants into litigation, discovery, and compliance workflows.
  • On January 15, 2025, Harvey secured $300 million in Series D funding at a $3 billion valuation, accelerating product development for AI-driven legal automation.

Scope of the Report

Item Value
Quantitative Units USD 1,742.3 million
End User Industry Law Firms: Tier 1, Tier 2, Boutique & Specialized Practices; Corporate Legal Departments: Large enterprises, Mid-sized corporate teams, SMEs; Alternative Legal Service Providers ; Public Sector / Judiciary: Courts & tribunals, Government legal offices, Regulatory agencies
Service Type Legal Research & Analytics, Co ntract Lifecycle Management, E-Discovery & Document Review, Litigation Support & Case Strategy, Compliance & Regulatory Monitoring, Billing & Matter Management
Technology Natural Language Processing & Generative AI, Machine Learning & Predictive Analytic, Computer Vision, Robotic Process Automation + AI, Knowledge Graphs & Semantic Search
Regions Covered North America, Europe, Asia-Pacific, Latin America, Middle East & Africa
Country Covered United States, Canada, Germany, France, United Kingdom, China, Japan, India, Brazil, South Africa
Key Companies Profiled Thomson Reuters Corporation, LexisNexis Legal & Professional, Relativity ODA LLC, Everlaw Inc., Evisort Inc., Luminance Technologies Ltd., DISCO Inc., Casetext Inc., Kira Systems Inc., Ironclad Inc., ContractPod Technologies Ltd., Lawgeex Technologies Ltd., Onit Inc., Lexion Inc., ThoughtRiver Ltd.
Additional Attributes Dollar sales by technology (Natural Language Processing & Generative AI, Others), dollar sales by service type (Legal Research & Analytics, Others), dollar sales by end-use industry (Law Firms, Others), adoption trends in AI-driven legal research and contract review, increasing use of generative AI for litigation support, sector-specific growth in law firms and corporate legal departments, integration with cloud-based and API-driven platforms, regional trends influenced by legal digitization policies, innovations in NLP models, document automation, and AI-assisted compliance solutions.

Key Segments

By End User Industry:

  • Law Firms
    • Tier 1
    • Tier 2
    • Boutique & Specialized Practices
  • Corporate Legal Departments
    • Large enterprises
    • Mid-sized corporate teams
    • SMEs
  • Alternative Legal Service Providers
  • Public Sector / Judiciary
    • Courts & tribunals
    • Government legal offices
    • Regulatory agencies

By Service Type:

  • Legal Research & Analytics
    • AI-powered legal search & case law retrieval
    • Predictive legal analytics
    • Knowledge management & content summarization
  • Contract Lifecycle Management (CLM)
    • AI-based contract drafting & review
    • Risk scoring & compliance checks
    • Clause extraction & standardization
  • E-Discovery & Document Review
    • AI-assisted evidence identification
    • Predictive coding & relevance ranking
    • Multi-language translation & redaction
  • Litigation Support & Case Strategy
    • AI-generated argument maps & timelines
    • Expert witness identification
    • Legal precedent analysis
  • Compliance & Regulatory Monitoring
    • Automated policy updates tracking
    • AI compliance audits
    • Regulatory risk assessment
  • Billing & Matter Management
    • AI-based timekeeping
    • Legal spend optimization
    • Pricing model recommendations

By Technology:

  • Natural Language Processing & Generative AI
    • LLM-based drafting & summarization
    • Conversational legal assistants
  • Machine Learning & Predictive Analytics
    • Outcome forecasting
    • Anomaly detection in contracts/billing
  • Computer Vision
    • Document scanning & OCR
    • Image/evidence recognition
  • Robotic Process Automation + AI
    • Workflow automation for repetitive tasks
    • Integrations with legal ERP & CRM
  • Knowledge Graphs & Semantic Search
    • Context-aware legal queries
    • Cross-document relationship mapping

By Region:

  • North America
  • Latin America
  • Europe
  • East Asia
  • South Asia & Pacific
  • Middle East and Africa

Table of Content

  1. Executive Summary
    • Global Market Outlook
    • Demand-side Trends
    • Supply-side Trends
    • Technology Roadmap Analysis
    • Analysis and Recommendations
  2. Market Overview
    • Market Coverage / Taxonomy
    • Market Definition / Scope / Limitations
  3. Market Background
    • Market Dynamics
      • Drivers
      • Restraints
      • Opportunity
      • Trends
    • Scenario Forecast
      • Demand in Optimistic Scenario
      • Demand in Likely Scenario
      • Demand in Conservative Scenario
    • Opportunity Map Analysis
    • Product Life Cycle Analysis
    • Supply Chain Analysis
      • Supply Side Participants and their Roles
        • Producers
        • Mid-Level Participants (Traders/ Agents/ Brokers)
        • Wholesalers and Distributors
      • Value Added and Value Created at Node in the Supply Chain
      • List of Raw Material Suppliers
      • List of Existing and Potential Buyer’s
    • Investment Feasibility Matrix
    • Value Chain Analysis
      • Profit Margin Analysis
      • Wholesalers and Distributors
      • Retailers
    • PESTLE and Porter’s Analysis
    • Regulatory Landscape
      • By Key Regions
      • By Key Countries
    • Regional Parent Market Outlook
    • Production and Consumption Statistics
    • Import and Export Statistics
  4. Global Market Analysis 2020 to 2024 and Forecast, 2025 to 2035
    • Historical Market Size Value (USD Million) & Volume (Units) Analysis, 2020 to 2024
    • Current and Future Market Size Value (USD Million) & Volume (Units) Projections, 2025 to 2035
      • Y-o-Y Growth Trend Analysis
      • Absolute $ Opportunity Analysis
  5. Global Market Analysis 2020 to 2024 and Forecast 2025 to 2035, By End User Industry
    • Introduction / Key Findings
    • Historical Market Size Value (USD Million) & Volume (Units) Analysis By End User Industry, 2020 to 2024
    • Current and Future Market Size Value (USD Million) & Volume (Units) Analysis and Forecast By End User Industry, 2025 to 2035
      • Law Firms
        • Tier 1
        • Tier 2
        • Boutique & Specialized Practices
      • Corporate Legal Departments
        • Large enterprises
        • Mid-sized corporate teams
        • SMEs
      • Alternative Legal Service Providers
      • Public Sector / Judiciary
        • Courts & tribunals
        • Government legal offices
        • Regulatory agencies
    • Y-o-Y Growth Trend Analysis By End User Industry, 2020 to 2024
    • Absolute $ Opportunity Analysis By End User Industry, 2025 to 2035
  6. Global Market Analysis 2020 to 2024 and Forecast 2025 to 2035, By Service Type
    • Introduction / Key Findings
    • Historical Market Size Value (USD Million) & Volume (Units) Analysis By Service Type, 2020 to 2024
    • Current and Future Market Size Value (USD Million) & Volume (Units) Analysis and Forecast By Service Type, 2025 to 2035
      • Legal Research & Analytics
        • AI-powered legal search & case law retrieval
        • Predictive legal analytics
        • Knowledge management & content summarization
      • Contract Lifecycle Management (CLM)
        • AI-based contract drafting & review
        • Risk scoring & compliance checks
        • Clause extraction & standardization
      • E-Discovery & Document Review
        • AI-assisted evidence identification
        • Predictive coding & relevance ranking
        • Multi-language translation & redaction
      • Litigation Support & Case Strategy
        • AI-generated argument maps & timelines
        • Expert witness identification
        • Legal precedent analysis
      • Compliance & Regulatory Monitoring
        • Automated policy updates tracking
        • AI compliance audits
        • Regulatory risk assessment
      • Billing & Matter Management
        • AI-based timekeeping
        • Legal spend optimization
        • Pricing model recommendations
    • Y-o-Y Growth Trend Analysis By Service Type, 2020 to 2024
    • Absolute $ Opportunity Analysis By Service Type, 2025 to 2035
  7. Global Market Analysis 2020 to 2024 and Forecast 2025 to 2035, By Technology
    • Introduction / Key Findings
    • Historical Market Size Value (USD Million) & Volume (Units) Analysis By Technology, 2020 to 2024
    • Current and Future Market Size Value (USD Million) & Volume (Units) Analysis and Forecast By Technology, 2025 to 2035
      • Natural Language Processing & Generative AI
        • LLM-based drafting & summarization
        • Conversational legal assistants
      • Machine Learning & Predictive Analytics
        • Outcome forecasting
        • Anomaly detection in contracts/billing
      • Computer Vision
        • Document scanning & OCR
        • Image/evidence recognition
      • Robotic Process Automation + AI
        • Workflow automation for repetitive tasks
        • Integrations with legal ERP & CRM
      • Knowledge Graphs & Semantic Search
        • Context-aware legal queries
        • Cross-document relationship mapping
    • Y-o-Y Growth Trend Analysis By Technology, 2020 to 2024
    • Absolute $ Opportunity Analysis By Technology, 2025 to 2035
  8. Global Market Analysis 2020 to 2024 and Forecast 2025 to 2035, By Region
    • Introduction
    • Historical Market Size Value (USD Million) & Volume (Units) Analysis By Region, 2020 to 2024
    • Current Market Size Value (USD Million) & Volume (Units) Analysis and Forecast By Region, 2025 to 2035
      • North America
      • Latin America
      • Europe
      • East Asia
      • South Asia & Pacific
      • Middle East and Africa
    • Market Attractiveness Analysis By Region
  9. North America Market Analysis 2020 to 2024 and Forecast 2025 to 2035, By Country
    • Historical Market Size Value (USD Million) & Volume (Units) Trend Analysis By Market Taxonomy, 2020 to 2024
    • Market Size Value (USD Million) & Volume (Units) Forecast By Market Taxonomy, 2025 to 2035
      • By Country
        • USA
        • Canada
      • By End User Industry
      • By Service Type
      • By Technology
    • Market Attractiveness Analysis
      • By Country
      • By End User Industry
      • By Service Type
      • By Technology
    • Key Takeaways
  10. Latin America Market Analysis 2020 to 2024 and Forecast 2025 to 2035, By Country
    • Historical Market Size Value (USD Million) & Volume (Units) Trend Analysis By Market Taxonomy, 2020 to 2024
    • Market Size Value (USD Million) & Volume (Units) Forecast By Market Taxonomy, 2025 to 2035
      • By Country
        • Brazil
        • Mexico
        • Colombia
        • Rest of Latin America
      • By End User Industry
      • By Service Type
      • By Technology
    • Market Attractiveness Analysis
      • By Country
      • By End User Industry
      • By Service Type
      • By Technology
    • Key Takeaways
  11. Europe Market Analysis 2020 to 2024 and Forecast 2025 to 2035, By Country
    • Historical Market Size Value (USD Million) & Volume (Units) Trend Analysis By Market Taxonomy, 2020 to 2024
    • Market Size Value (USD Million) & Volume (Units) Forecast By Market Taxonomy, 2025 to 2035
      • By Country
        • Germany
        • UK
        • France
        • Italy
        • Spain
        • Belgium
        • Netherlands
        • Nordic
        • Switzerland
        • Russia
        • Poland
        • Rest of Europe
      • By End User Industry
      • By Service Type
      • By Technology
    • Market Attractiveness Analysis
      • By Country
      • By End User Industry
      • By Service Type
      • By Technology
    • Key Takeaways
  12. East Asia Market Analysis 2020 to 2024 and Forecast 2025 to 2035, By Country
    • Historical Market Size Value (USD Million) & Volume (Units) Trend Analysis By Market Taxonomy, 2020 to 2024
    • Market Size Value (USD Million) & Volume (Units) Forecast By Market Taxonomy, 2025 to 2035
      • By Country
        • China
        • Japan
        • South Korea
      • By End User Industry
      • By Service Type
      • By Technology
    • Market Attractiveness Analysis
      • By Country
      • By End User Industry
      • By Service Type
      • By Technology
    • Key Takeaways
  13. South Asia & Pacific Market Analysis 2020 to 2024 and Forecast 2025 to 2035, By Country
    • Historical Market Size Value (USD Million) & Volume (Units) Trend Analysis By Market Taxonomy, 2020 to 2024
    • Market Size Value (USD Million) & Volume (Units) Forecast By Market Taxonomy, 2025 to 2035
      • By Country
        • India
        • Thailand
        • Malaysia
        • Indonesia
        • Singapore
        • Vietnam
        • Australia
        • New Zealand
        • Rest of South Asia
      • By End User Industry
      • By Service Type
      • By Technology
    • Market Attractiveness Analysis
      • By Country
      • By End User Industry
      • By Service Type
      • By Technology
    • Key Takeaways
  14. Middle East and Africa Market Analysis 2020 to 2024 and Forecast 2025 to 2035, By Country
    • Historical Market Size Value (USD Million) & Volume (Units) Trend Analysis By Market Taxonomy, 2020 to 2024
    • Market Size Value (USD Million) & Volume (Units) Forecast By Market Taxonomy, 2025 to 2035
      • By Country
        • Turkey
        • UAE
        • Saudi Arabia
        • Israel
        • Other GCC Countries
        • North Africa
        • South Africa
      • By End User Industry
      • By Service Type
      • By Technology
    • Market Attractiveness Analysis
      • By Country
      • By End User Industry
      • By Service Type
      • By Technology
    • Key Takeaways
  15. Key Countries Market Analysis
    • USA
      • Pricing Analysis
      • Market Share Analysis, 2024
        • By End User Industry
        • By Service Type
        • By Technology
    • Canada
      • Pricing Analysis
      • Market Share Analysis, 2024
        • By End User Industry
        • By Service Type
        • By Technology
    • Brazil
      • Pricing Analysis
      • Market Share Analysis, 2024
        • By End User Industry
        • By Service Type
        • By Technology
    • Mexico
      • Pricing Analysis
      • Market Share Analysis, 2024
        • By End User Industry
        • By Service Type
        • By Technology
    • Colombia
      • Pricing Analysis
      • Market Share Analysis, 2024
        • By End User Industry
        • By Service Type
        • By Technology
    • Germany
      • Pricing Analysis
      • Market Share Analysis, 2024
        • By End User Industry
        • By Service Type
        • By Technology
    • UK
      • Pricing Analysis
      • Market Share Analysis, 2024
        • By End User Industry
        • By Service Type
        • By Technology
    • France
      • Pricing Analysis
      • Market Share Analysis, 2024
        • By End User Industry
        • By Service Type
        • By Technology
    • Italy
      • Pricing Analysis
      • Market Share Analysis, 2024
        • By End User Industry
        • By Service Type
        • By Technology
    • Spain
      • Pricing Analysis
      • Market Share Analysis, 2024
        • By End User Industry
        • By Service Type
        • By Technology
    • Belgium
      • Pricing Analysis
      • Market Share Analysis, 2024
        • By End User Industry
        • By Service Type
        • By Technology
    • Netherlands
      • Pricing Analysis
      • Market Share Analysis, 2024
        • By End User Industry
        • By Service Type
        • By Technology
    • Nordic
      • Pricing Analysis
      • Market Share Analysis, 2024
        • By End User Industry
        • By Service Type
        • By Technology
    • Switzerland
      • Pricing Analysis
      • Market Share Analysis, 2024
        • By End User Industry
        • By Service Type
        • By Technology
    • Russia
      • Pricing Analysis
      • Market Share Analysis, 2024
        • By End User Industry
        • By Service Type
        • By Technology
    • Poland
      • Pricing Analysis
      • Market Share Analysis, 2024
        • By End User Industry
        • By Service Type
        • By Technology
    • China
      • Pricing Analysis
      • Market Share Analysis, 2024
        • By End User Industry
        • By Service Type
        • By Technology
    • Japan
      • Pricing Analysis
      • Market Share Analysis, 2024
        • By End User Industry
        • By Service Type
        • By Technology
    • South Korea
      • Pricing Analysis
      • Market Share Analysis, 2024
        • By End User Industry
        • By Service Type
        • By Technology
    • India
      • Pricing Analysis
      • Market Share Analysis, 2024
        • By End User Industry
        • By Service Type
        • By Technology
    • Thailand
      • Pricing Analysis
      • Market Share Analysis, 2024
        • By End User Industry
        • By Service Type
        • By Technology
    • Indonesia
      • Pricing Analysis
      • Market Share Analysis, 2024
        • By End User Industry
        • By Service Type
        • By Technology
    • Australia
      • Pricing Analysis
      • Market Share Analysis, 2024
        • By End User Industry
        • By Service Type
        • By Technology
    • New Zealand
      • Pricing Analysis
      • Market Share Analysis, 2024
        • By End User Industry
        • By Service Type
        • By Technology
    • Turkey
      • Pricing Analysis
      • Market Share Analysis, 2024
        • By End User Industry
        • By Service Type
        • By Technology
    • UAE
      • Pricing Analysis
      • Market Share Analysis, 2024
        • By End User Industry
        • By Service Type
        • By Technology
    • Saudi Arabia
      • Pricing Analysis
      • Market Share Analysis, 2024
        • By End User Industry
        • By Service Type
        • By Technology
    • Israel
      • Pricing Analysis
      • Market Share Analysis, 2024
        • By End User Industry
        • By Service Type
        • By Technology
    • North Africa
      • Pricing Analysis
      • Market Share Analysis, 2024
        • By End User Industry
        • By Service Type
        • By Technology
    • South Africa
      • Pricing Analysis
      • Market Share Analysis, 2024
        • By End User Industry
        • By Service Type
        • By Technology
  16. Market Structure Analysis
    • Competition Dashboard
    • Competition Benchmarking
    • Market Share Analysis of Top Players
      • By Regional
      • By End User Industry
      • By Service Type
      • By Technology
  17. Competition Analysis
    • Competition Deep Dive
      • Thomson Reuters Corporation
        • Overview
        • Product Portfolio
        • Profitability by Market Segments (Product/Age /Sales Channel/Region)
        • Sales Footprint
        • Strategy Overview
          • Marketing Strategy
          • Product Strategy
          • Channel Strategy
      • LexisNexis Legal & Professional
        • Overview
        • Product Portfolio
        • Profitability by Market Segments (Product/Age /Sales Channel/Region)
        • Sales Footprint
        • Strategy Overview
          • Marketing Strategy
          • Product Strategy
          • Channel Strategy
      • Relativity ODA LLC
        • Overview
        • Product Portfolio
        • Profitability by Market Segments (Product/Age /Sales Channel/Region)
        • Sales Footprint
        • Strategy Overview
          • Marketing Strategy
          • Product Strategy
          • Channel Strategy
      • Everlaw Inc.
        • Overview
        • Product Portfolio
        • Profitability by Market Segments (Product/Age /Sales Channel/Region)
        • Sales Footprint
        • Strategy Overview
          • Marketing Strategy
          • Product Strategy
          • Channel Strategy
      • Evisort Inc.
        • Overview
        • Product Portfolio
        • Profitability by Market Segments (Product/Age /Sales Channel/Region)
        • Sales Footprint
        • Strategy Overview
          • Marketing Strategy
          • Product Strategy
          • Channel Strategy
      • Luminance Technologies Ltd.
        • Overview
        • Product Portfolio
        • Profitability by Market Segments (Product/Age /Sales Channel/Region)
        • Sales Footprint
        • Strategy Overview
          • Marketing Strategy
          • Product Strategy
          • Channel Strategy
      • DISCO Inc.
        • Overview
        • Product Portfolio
        • Profitability by Market Segments (Product/Age /Sales Channel/Region)
        • Sales Footprint
        • Strategy Overview
          • Marketing Strategy
          • Product Strategy
          • Channel Strategy
      • Casetext Inc.
        • Overview
        • Product Portfolio
        • Profitability by Market Segments (Product/Age /Sales Channel/Region)
        • Sales Footprint
        • Strategy Overview
          • Marketing Strategy
          • Product Strategy
          • Channel Strategy
      • Kira Systems Inc.
        • Overview
        • Product Portfolio
        • Profitability by Market Segments (Product/Age /Sales Channel/Region)
        • Sales Footprint
        • Strategy Overview
          • Marketing Strategy
          • Product Strategy
          • Channel Strategy
      • Ironclad Inc.
        • Overview
        • Product Portfolio
        • Profitability by Market Segments (Product/Age /Sales Channel/Region)
        • Sales Footprint
        • Strategy Overview
          • Marketing Strategy
          • Product Strategy
          • Channel Strategy
      • ContractPod Technologies Ltd.
        • Overview
        • Product Portfolio
        • Profitability by Market Segments (Product/Age /Sales Channel/Region)
        • Sales Footprint
        • Strategy Overview
          • Marketing Strategy
          • Product Strategy
          • Channel Strategy
      • Lawgeex Technologies Ltd.
        • Overview
        • Product Portfolio
        • Profitability by Market Segments (Product/Age /Sales Channel/Region)
        • Sales Footprint
        • Strategy Overview
          • Marketing Strategy
          • Product Strategy
          • Channel Strategy
      • Onit Inc.
        • Overview
        • Product Portfolio
        • Profitability by Market Segments (Product/Age /Sales Channel/Region)
        • Sales Footprint
        • Strategy Overview
          • Marketing Strategy
          • Product Strategy
          • Channel Strategy
      • Lexion Inc.
        • Overview
        • Product Portfolio
        • Profitability by Market Segments (Product/Age /Sales Channel/Region)
        • Sales Footprint
        • Strategy Overview
          • Marketing Strategy
          • Product Strategy
          • Channel Strategy
      • ThoughtRiver Ltd.
        • Overview
        • Product Portfolio
        • Profitability by Market Segments (Product/Age /Sales Channel/Region)
        • Sales Footprint
        • Strategy Overview
          • Marketing Strategy
          • Product Strategy
          • Channel Strategy
  18. Assumptions & Acronyms Used
  19. Research Methodology

List of Tables

  • Table 1: Global Market Value (USD Million) Forecast by Region, 2020-2035
  • Table 2: Global Market Volume (Units) Forecast by Region, 2020-2035
  • Table 3: Global Market Value (USD Million) Forecast by End User Industry, 2020-2035
  • Table 4: Global Market Volume (Units) Forecast by End User Industry, 2020-2035
  • Table 5: Global Market Value (USD Million) Forecast by Service Type, 2020-2035
  • Table 6: Global Market Volume (Units) Forecast by Service Type, 2020-2035
  • Table 7: Global Market Value (USD Million) Forecast by Technology, 2020-2035
  • Table 8: Global Market Volume (Units) Forecast by Technology, 2020-2035
  • Table 9: North America Market Value (USD Million) Forecast by Country, 2020-2035
  • Table 10: North America Market Volume (Units) Forecast by Country, 2020-2035
  • Table 11: North America Market Value (USD Million) Forecast by End User Industry, 2020-2035
  • Table 12: North America Market Volume (Units) Forecast by End User Industry, 2020-2035
  • Table 13: North America Market Value (USD Million) Forecast by Service Type, 2020-2035
  • Table 14: North America Market Volume (Units) Forecast by Service Type, 2020-2035
  • Table 15: North America Market Value (USD Million) Forecast by Technology, 2020-2035
  • Table 16: North America Market Volume (Units) Forecast by Technology, 2020-2035
  • Table 17: Latin America Market Value (USD Million) Forecast by Country, 2020-2035
  • Table 18: Latin America Market Volume (Units) Forecast by Country, 2020-2035
  • Table 19: Latin America Market Value (USD Million) Forecast by End User Industry, 2020-2035
  • Table 20: Latin America Market Volume (Units) Forecast by End User Industry, 2020-2035
  • Table 21: Latin America Market Value (USD Million) Forecast by Service Type, 2020-2035
  • Table 22: Latin America Market Volume (Units) Forecast by Service Type, 2020-2035
  • Table 23: Latin America Market Value (USD Million) Forecast by Technology, 2020-2035
  • Table 24: Latin America Market Volume (Units) Forecast by Technology, 2020-2035
  • Table 25: Europe Market Value (USD Million) Forecast by Country, 2020-2035
  • Table 26: Europe Market Volume (Units) Forecast by Country, 2020-2035
  • Table 27: Europe Market Value (USD Million) Forecast by End User Industry, 2020-2035
  • Table 28: Europe Market Volume (Units) Forecast by End User Industry, 2020-2035
  • Table 29: Europe Market Value (USD Million) Forecast by Service Type, 2020-2035
  • Table 30: Europe Market Volume (Units) Forecast by Service Type, 2020-2035
  • Table 31: Europe Market Value (USD Million) Forecast by Technology, 2020-2035
  • Table 32: Europe Market Volume (Units) Forecast by Technology, 2020-2035
  • Table 33: East Asia Market Value (USD Million) Forecast by Country, 2020-2035
  • Table 34: East Asia Market Volume (Units) Forecast by Country, 2020-2035
  • Table 35: East Asia Market Value (USD Million) Forecast by End User Industry, 2020-2035
  • Table 36: East Asia Market Volume (Units) Forecast by End User Industry, 2020-2035
  • Table 37: East Asia Market Value (USD Million) Forecast by Service Type, 2020-2035
  • Table 38: East Asia Market Volume (Units) Forecast by Service Type, 2020-2035
  • Table 39: East Asia Market Value (USD Million) Forecast by Technology, 2020-2035
  • Table 40: East Asia Market Volume (Units) Forecast by Technology, 2020-2035
  • Table 41: South Asia & Pacific Market Value (USD Million) Forecast by Country, 2020-2035
  • Table 42: South Asia & Pacific Market Volume (Units) Forecast by Country, 2020-2035
  • Table 43: South Asia & Pacific Market Value (USD Million) Forecast by End User Industry, 2020-2035
  • Table 44: South Asia & Pacific Market Volume (Units) Forecast by End User Industry, 2020-2035
  • Table 45: South Asia & Pacific Market Value (USD Million) Forecast by Service Type, 2020-2035
  • Table 46: South Asia & Pacific Market Volume (Units) Forecast by Service Type, 2020-2035
  • Table 47: South Asia & Pacific Market Value (USD Million) Forecast by Technology, 2020-2035
  • Table 48: South Asia & Pacific Market Volume (Units) Forecast by Technology, 2020-2035
  • Table 49: Middle East and Africa Market Value (USD Million) Forecast by Country, 2020-2035
  • Table 50: Middle East and Africa Market Volume (Units) Forecast by Country, 2020-2035
  • Table 51: Middle East and Africa Market Value (USD Million) Forecast by End User Industry, 2020-2035
  • Table 52: Middle East and Africa Market Volume (Units) Forecast by End User Industry, 2020-2035
  • Table 53: Middle East and Africa Market Value (USD Million) Forecast by Service Type, 2020-2035
  • Table 54: Middle East and Africa Market Volume (Units) Forecast by Service Type, 2020-2035
  • Table 55: Middle East and Africa Market Value (USD Million) Forecast by Technology, 2020-2035
  • Table 56: Middle East and Africa Market Volume (Units) Forecast by Technology, 2020-2035

List of Figures

  • Figure 1: Global Market Value (USD Million) by End User Industry, 2025-2035
  • Figure 2: Global Market Value (USD Million) by Service Type, 2025-2035
  • Figure 3: Global Market Value (USD Million) by Technology, 2025-2035
  • Figure 4: Global Market Value (USD Million) by Region, 2025-2035
  • Figure 5: Global Market Value (USD Million) Analysis by Region, 2020-2035
  • Figure 6: Global Market Volume (Units) Analysis by Region, 2020-2035
  • Figure 7: Global Market Value Share (%) and BPS Analysis by Region, 2025-2035
  • Figure 8: Global Market Y-o-Y Growth (%) Projections by Region, 2025-2035
  • Figure 9: Global Market Value (USD Million) Analysis by End User Industry, 2020-2035
  • Figure 10: Global Market Volume (Units) Analysis by End User Industry, 2020-2035
  • Figure 11: Global Market Value Share (%) and BPS Analysis by End User Industry, 2025-2035
  • Figure 12: Global Market Y-o-Y Growth (%) Projections by End User Industry, 2025-2035
  • Figure 13: Global Market Value (USD Million) Analysis by Service Type, 2020-2035
  • Figure 14: Global Market Volume (Units) Analysis by Service Type, 2020-2035
  • Figure 15: Global Market Value Share (%) and BPS Analysis by Service Type, 2025-2035
  • Figure 16: Global Market Y-o-Y Growth (%) Projections by Service Type, 2025-2035
  • Figure 17: Global Market Value (USD Million) Analysis by Technology, 2020-2035
  • Figure 18: Global Market Volume (Units) Analysis by Technology, 2020-2035
  • Figure 19: Global Market Value Share (%) and BPS Analysis by Technology, 2025-2035
  • Figure 20: Global Market Y-o-Y Growth (%) Projections by Technology, 2025-2035
  • Figure 21: Global Market Attractiveness by End User Industry, 2025-2035
  • Figure 22: Global Market Attractiveness by Service Type, 2025-2035
  • Figure 23: Global Market Attractiveness by Technology, 2025-2035
  • Figure 24: Global Market Attractiveness by Region, 2025-2035
  • Figure 25: North America Market Value (USD Million) by End User Industry, 2025-2035
  • Figure 26: North America Market Value (USD Million) by Service Type, 2025-2035
  • Figure 27: North America Market Value (USD Million) by Technology, 2025-2035
  • Figure 28: North America Market Value (USD Million) by Country, 2025-2035
  • Figure 29: North America Market Value (USD Million) Analysis by Country, 2020-2035
  • Figure 30: North America Market Volume (Units) Analysis by Country, 2020-2035
  • Figure 31: North America Market Value Share (%) and BPS Analysis by Country, 2025-2035
  • Figure 32: North America Market Y-o-Y Growth (%) Projections by Country, 2025-2035
  • Figure 33: North America Market Value (USD Million) Analysis by End User Industry, 2020-2035
  • Figure 34: North America Market Volume (Units) Analysis by End User Industry, 2020-2035
  • Figure 35: North America Market Value Share (%) and BPS Analysis by End User Industry, 2025-2035
  • Figure 36: North America Market Y-o-Y Growth (%) Projections by End User Industry, 2025-2035
  • Figure 37: North America Market Value (USD Million) Analysis by Service Type, 2020-2035
  • Figure 38: North America Market Volume (Units) Analysis by Service Type, 2020-2035
  • Figure 39: North America Market Value Share (%) and BPS Analysis by Service Type, 2025-2035
  • Figure 40: North America Market Y-o-Y Growth (%) Projections by Service Type, 2025-2035
  • Figure 41: North America Market Value (USD Million) Analysis by Technology, 2020-2035
  • Figure 42: North America Market Volume (Units) Analysis by Technology, 2020-2035
  • Figure 43: North America Market Value Share (%) and BPS Analysis by Technology, 2025-2035
  • Figure 44: North America Market Y-o-Y Growth (%) Projections by Technology, 2025-2035
  • Figure 45: North America Market Attractiveness by End User Industry, 2025-2035
  • Figure 46: North America Market Attractiveness by Service Type, 2025-2035
  • Figure 47: North America Market Attractiveness by Technology, 2025-2035
  • Figure 48: North America Market Attractiveness by Country, 2025-2035
  • Figure 49: Latin America Market Value (USD Million) by End User Industry, 2025-2035
  • Figure 50: Latin America Market Value (USD Million) by Service Type, 2025-2035
  • Figure 51: Latin America Market Value (USD Million) by Technology, 2025-2035
  • Figure 52: Latin America Market Value (USD Million) by Country, 2025-2035
  • Figure 53: Latin America Market Value (USD Million) Analysis by Country, 2020-2035
  • Figure 54: Latin America Market Volume (Units) Analysis by Country, 2020-2035
  • Figure 55: Latin America Market Value Share (%) and BPS Analysis by Country, 2025-2035
  • Figure 56: Latin America Market Y-o-Y Growth (%) Projections by Country, 2025-2035
  • Figure 57: Latin America Market Value (USD Million) Analysis by End User Industry, 2020-2035
  • Figure 58: Latin America Market Volume (Units) Analysis by End User Industry, 2020-2035
  • Figure 59: Latin America Market Value Share (%) and BPS Analysis by End User Industry, 2025-2035
  • Figure 60: Latin America Market Y-o-Y Growth (%) Projections by End User Industry, 2025-2035
  • Figure 61: Latin America Market Value (USD Million) Analysis by Service Type, 2020-2035
  • Figure 62: Latin America Market Volume (Units) Analysis by Service Type, 2020-2035
  • Figure 63: Latin America Market Value Share (%) and BPS Analysis by Service Type, 2025-2035
  • Figure 64: Latin America Market Y-o-Y Growth (%) Projections by Service Type, 2025-2035
  • Figure 65: Latin America Market Value (USD Million) Analysis by Technology, 2020-2035
  • Figure 66: Latin America Market Volume (Units) Analysis by Technology, 2020-2035
  • Figure 67: Latin America Market Value Share (%) and BPS Analysis by Technology, 2025-2035
  • Figure 68: Latin America Market Y-o-Y Growth (%) Projections by Technology, 2025-2035
  • Figure 69: Latin America Market Attractiveness by End User Industry, 2025-2035
  • Figure 70: Latin America Market Attractiveness by Service Type, 2025-2035
  • Figure 71: Latin America Market Attractiveness by Technology, 2025-2035
  • Figure 72: Latin America Market Attractiveness by Country, 2025-2035
  • Figure 73: Europe Market Value (USD Million) by End User Industry, 2025-2035
  • Figure 74: Europe Market Value (USD Million) by Service Type, 2025-2035
  • Figure 75: Europe Market Value (USD Million) by Technology, 2025-2035
  • Figure 76: Europe Market Value (USD Million) by Country, 2025-2035
  • Figure 77: Europe Market Value (USD Million) Analysis by Country, 2020-2035
  • Figure 78: Europe Market Volume (Units) Analysis by Country, 2020-2035
  • Figure 79: Europe Market Value Share (%) and BPS Analysis by Country, 2025-2035
  • Figure 80: Europe Market Y-o-Y Growth (%) Projections by Country, 2025-2035
  • Figure 81: Europe Market Value (USD Million) Analysis by End User Industry, 2020-2035
  • Figure 82: Europe Market Volume (Units) Analysis by End User Industry, 2020-2035
  • Figure 83: Europe Market Value Share (%) and BPS Analysis by End User Industry, 2025-2035
  • Figure 84: Europe Market Y-o-Y Growth (%) Projections by End User Industry, 2025-2035
  • Figure 85: Europe Market Value (USD Million) Analysis by Service Type, 2020-2035
  • Figure 86: Europe Market Volume (Units) Analysis by Service Type, 2020-2035
  • Figure 87: Europe Market Value Share (%) and BPS Analysis by Service Type, 2025-2035
  • Figure 88: Europe Market Y-o-Y Growth (%) Projections by Service Type, 2025-2035
  • Figure 89: Europe Market Value (USD Million) Analysis by Technology, 2020-2035
  • Figure 90: Europe Market Volume (Units) Analysis by Technology, 2020-2035
  • Figure 91: Europe Market Value Share (%) and BPS Analysis by Technology, 2025-2035
  • Figure 92: Europe Market Y-o-Y Growth (%) Projections by Technology, 2025-2035
  • Figure 93: Europe Market Attractiveness by End User Industry, 2025-2035
  • Figure 94: Europe Market Attractiveness by Service Type, 2025-2035
  • Figure 95: Europe Market Attractiveness by Technology, 2025-2035
  • Figure 96: Europe Market Attractiveness by Country, 2025-2035
  • Figure 97: East Asia Market Value (USD Million) by End User Industry, 2025-2035
  • Figure 98: East Asia Market Value (USD Million) by Service Type, 2025-2035
  • Figure 99: East Asia Market Value (USD Million) by Technology, 2025-2035
  • Figure 100: East Asia Market Value (USD Million) by Country, 2025-2035
  • Figure 101: East Asia Market Value (USD Million) Analysis by Country, 2020-2035
  • Figure 102: East Asia Market Volume (Units) Analysis by Country, 2020-2035
  • Figure 103: East Asia Market Value Share (%) and BPS Analysis by Country, 2025-2035
  • Figure 104: East Asia Market Y-o-Y Growth (%) Projections by Country, 2025-2035
  • Figure 105: East Asia Market Value (USD Million) Analysis by End User Industry, 2020-2035
  • Figure 106: East Asia Market Volume (Units) Analysis by End User Industry, 2020-2035
  • Figure 107: East Asia Market Value Share (%) and BPS Analysis by End User Industry, 2025-2035
  • Figure 108: East Asia Market Y-o-Y Growth (%) Projections by End User Industry, 2025-2035
  • Figure 109: East Asia Market Value (USD Million) Analysis by Service Type, 2020-2035
  • Figure 110: East Asia Market Volume (Units) Analysis by Service Type, 2020-2035
  • Figure 111: East Asia Market Value Share (%) and BPS Analysis by Service Type, 2025-2035
  • Figure 112: East Asia Market Y-o-Y Growth (%) Projections by Service Type, 2025-2035
  • Figure 113: East Asia Market Value (USD Million) Analysis by Technology, 2020-2035
  • Figure 114: East Asia Market Volume (Units) Analysis by Technology, 2020-2035
  • Figure 115: East Asia Market Value Share (%) and BPS Analysis by Technology, 2025-2035
  • Figure 116: East Asia Market Y-o-Y Growth (%) Projections by Technology, 2025-2035
  • Figure 117: East Asia Market Attractiveness by End User Industry, 2025-2035
  • Figure 118: East Asia Market Attractiveness by Service Type, 2025-2035
  • Figure 119: East Asia Market Attractiveness by Technology, 2025-2035
  • Figure 120: East Asia Market Attractiveness by Country, 2025-2035
  • Figure 121: South Asia & Pacific Market Value (USD Million) by End User Industry, 2025-2035
  • Figure 122: South Asia & Pacific Market Value (USD Million) by Service Type, 2025-2035
  • Figure 123: South Asia & Pacific Market Value (USD Million) by Technology, 2025-2035
  • Figure 124: South Asia & Pacific Market Value (USD Million) by Country, 2025-2035
  • Figure 125: South Asia & Pacific Market Value (USD Million) Analysis by Country, 2020-2035
  • Figure 126: South Asia & Pacific Market Volume (Units) Analysis by Country, 2020-2035
  • Figure 127: South Asia & Pacific Market Value Share (%) and BPS Analysis by Country, 2025-2035
  • Figure 128: South Asia & Pacific Market Y-o-Y Growth (%) Projections by Country, 2025-2035
  • Figure 129: South Asia & Pacific Market Value (USD Million) Analysis by End User Industry, 2020-2035
  • Figure 130: South Asia & Pacific Market Volume (Units) Analysis by End User Industry, 2020-2035
  • Figure 131: South Asia & Pacific Market Value Share (%) and BPS Analysis by End User Industry, 2025-2035
  • Figure 132: South Asia & Pacific Market Y-o-Y Growth (%) Projections by End User Industry, 2025-2035
  • Figure 133: South Asia & Pacific Market Value (USD Million) Analysis by Service Type, 2020-2035
  • Figure 134: South Asia & Pacific Market Volume (Units) Analysis by Service Type, 2020-2035
  • Figure 135: South Asia & Pacific Market Value Share (%) and BPS Analysis by Service Type, 2025-2035
  • Figure 136: South Asia & Pacific Market Y-o-Y Growth (%) Projections by Service Type, 2025-2035
  • Figure 137: South Asia & Pacific Market Value (USD Million) Analysis by Technology, 2020-2035
  • Figure 138: South Asia & Pacific Market Volume (Units) Analysis by Technology, 2020-2035
  • Figure 139: South Asia & Pacific Market Value Share (%) and BPS Analysis by Technology, 2025-2035
  • Figure 140: South Asia & Pacific Market Y-o-Y Growth (%) Projections by Technology, 2025-2035
  • Figure 141: South Asia & Pacific Market Attractiveness by End User Industry, 2025-2035
  • Figure 142: South Asia & Pacific Market Attractiveness by Service Type, 2025-2035
  • Figure 143: South Asia & Pacific Market Attractiveness by Technology, 2025-2035
  • Figure 144: South Asia & Pacific Market Attractiveness by Country, 2025-2035
  • Figure 145: Middle East and Africa Market Value (USD Million) by End User Industry, 2025-2035
  • Figure 146: Middle East and Africa Market Value (USD Million) by Service Type, 2025-2035
  • Figure 147: Middle East and Africa Market Value (USD Million) by Technology, 2025-2035
  • Figure 148: Middle East and Africa Market Value (USD Million) by Country, 2025-2035
  • Figure 149: Middle East and Africa Market Value (USD Million) Analysis by Country, 2020-2035
  • Figure 150: Middle East and Africa Market Volume (Units) Analysis by Country, 2020-2035
  • Figure 151: Middle East and Africa Market Value Share (%) and BPS Analysis by Country, 2025-2035
  • Figure 152: Middle East and Africa Market Y-o-Y Growth (%) Projections by Country, 2025-2035
  • Figure 153: Middle East and Africa Market Value (USD Million) Analysis by End User Industry, 2020-2035
  • Figure 154: Middle East and Africa Market Volume (Units) Analysis by End User Industry, 2020-2035
  • Figure 155: Middle East and Africa Market Value Share (%) and BPS Analysis by End User Industry, 2025-2035
  • Figure 156: Middle East and Africa Market Y-o-Y Growth (%) Projections by End User Industry, 2025-2035
  • Figure 157: Middle East and Africa Market Value (USD Million) Analysis by Service Type, 2020-2035
  • Figure 158: Middle East and Africa Market Volume (Units) Analysis by Service Type, 2020-2035
  • Figure 159: Middle East and Africa Market Value Share (%) and BPS Analysis by Service Type, 2025-2035
  • Figure 160: Middle East and Africa Market Y-o-Y Growth (%) Projections by Service Type, 2025-2035
  • Figure 161: Middle East and Africa Market Value (USD Million) Analysis by Technology, 2020-2035
  • Figure 162: Middle East and Africa Market Volume (Units) Analysis by Technology, 2020-2035
  • Figure 163: Middle East and Africa Market Value Share (%) and BPS Analysis by Technology, 2025-2035
  • Figure 164: Middle East and Africa Market Y-o-Y Growth (%) Projections by Technology, 2025-2035
  • Figure 165: Middle East and Africa Market Attractiveness by End User Industry, 2025-2035
  • Figure 166: Middle East and Africa Market Attractiveness by Service Type, 2025-2035
  • Figure 167: Middle East and Africa Market Attractiveness by Technology, 2025-2035
  • Figure 168: Middle East and Africa Market Attractiveness by Country, 2025-2035

Frequently Asked Questions

How big is the AI Legal Services Market in 2025?

The global AI Legal Services Market is estimated to be valued at USD 1,742.3 million in 2025.

What will be the size of AI Legal Services Market in 2035?

The market size for the AI Legal Services Market is projected to reach USD 10,431.6 million by 2035.

How much will be the AI Legal Services Market growth between 2025 and 2035?

The AI Legal Services Market is expected to grow at a 19.6% CAGR between 2025 and 2035.

What are the key end user industry in the AI Legal Services Market?

The key end user industry in the AI Legal Services Market is Law Firms.

Which technology segment will contribute a significant share in the AI Legal Services Market in 2025?

In terms of technology, Natural Language Processing & Generative AI is expected to command 40.7% share in the AI Legal Services Market in 2025.

Explore Similar Insights

Future Market Insights

AI Legal Services Market