Global AI HR Services Market Size and Share Forecast Outlook 2025 to 2035

The Global AI HR Services Market is expected to record a valuation of USD 11,046 million in 2025 and USD 55,077 million in 2035, with an increase of USD 44,031 million, which equals a growth of 398% over the decade. The overall expansion represents a CAGR of 17.4% and a ~5X increase in market size.
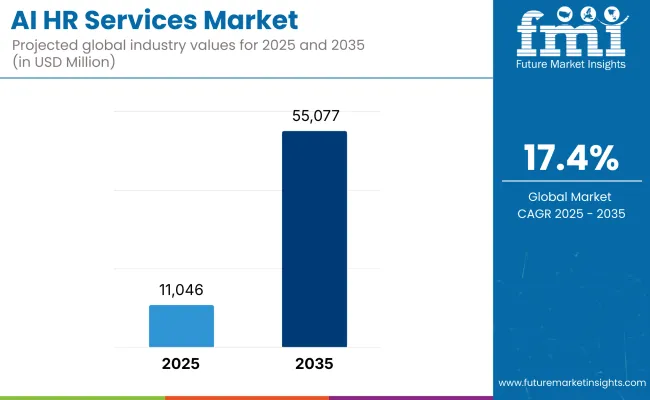
Quick Stats for Global AI HR Services Market

  • Global AI HR Services Market Value (2025): USD 11,046 million
  • Global AI HR Services Market Forecast Value (2035): USD 55,077 million
  • Global AI HR Services Market Forecast CAGR: 17.4%
  • Leading Segment in 2025: BFSI (18.3%) Key Growth Regions: North America, Asia-Pacific, Europe
  • Top Key Players: Workday, Inc., Oracle Corporation, SAP SE, ADP, Inc., Ceridian HCM Holding Inc., UKG Inc., Cornerstone OnDemand, Inc., IBM Corporation, Eightfold AI, Inc., HireVue, Inc., iCIMS, Inc., Phenom People, Inc., Talview, Inc., Harver B.V., SmartRecruiters, Inc.

Ai Hr Services Market

Global AI HR Services Market Key Takeaways

Metric Value
Market Estimated Value in (2025E) USD 11,046 million
Market Forecast Value in (2035F) USD 55,077 million
Forecast CAGR (2025 to 2035) 17.4%

During the first five-year period from 2025 to 2030, the market increases from USD 11,046 million to USD 24,665 million, adding USD 13,619 million, which accounts for 30.9% of the total decade growth. This phase records steady adoption in BFSI, healthcare & life sciences, and manufacturing, driven by the need for automation and compliance. Talent Acquisition & Recruitment dominates this period as it caters to over 27% of enterprise applications requiring large-scale AI-driven hiring solutions.

The second half from 2030 to 2035 contributes USD 30,412 million, equal to 69.1% of total growth, as the market jumps from USD 24,665 million to USD 55,077 million. This acceleration is powered by widespread deployment of predictive workforce analytics, AI-based employee engagement systems, and integrated L&D platforms in global enterprises. Machine Learning & Predictive Analytics captures a larger share above 33% by the end of the decade. Software-led analytics and cloud platforms add recurring revenue, increasing the software services share beyond 40% in total value.

From 2020 to 2024, the Global AI HR Services Market grew from USD 7,500 million to USD 10,300 million, driven by strong adoption in talent acquisition and cloud-based HCM platforms. During this period, the competitive landscape was dominated by integrated HR software providers controlling nearly 50% of revenue, with leaders such as Workday, Oracle, and SAP focusing on enterprise-scale AI-enabled HCM suites.

Competitive differentiation relied on platform integration, predictive analytics capabilities, and compliance management, while standalone AI tools were often deployed as niche solutions rather than full-suite offerings.

Service-based models began gaining traction, contributing more than 15% of the total market value by 2024. Demand for AI HR Services will expand to USD 11,046 million in 2025, and the revenue mix will shift as software and analytics services grow to over 40% share. Traditional HCM leaders face rising competition from AI-first companies offering bias detection, conversational AI for employee engagement, and predictive workforce planning.

Major HR tech vendors are pivoting to hybrid models, integrating AI analytics and cloud-based workflows to retain relevance. Emerging entrants specializing in AI-based candidate experience, AR/VR onboarding, and industry-specific AI HR platforms are gaining share. The competitive advantage is moving away from pure platform functionality toward ecosystem integration, scalability, and recurring revenue streams.

Why the Global AI HR Services Market is growing?

Advances in AI algorithms and cloud platforms have improved recruitment accuracy and speed, allowing for more efficient workforce management across diverse industries. Talent Acquisition & Recruitment has gained popularity due to its suitability for high-volume hiring, automated candidate matching, and bias detection. The rise of predictive analytics technology has contributed to enhanced decision-making and real-time workforce planning. Industries such as BFSI, healthcare, and manufacturing are driving demand for AI HR solutions that integrate seamlessly with existing HCM workflows.

Expansion of AI-enabled onboarding, engagement, and performance management processes has fueled market growth. Innovations in conversational AI, workforce sentiment analysis, and AI-based L&D platforms are expected to open new application areas. Segment growth is expected to be led by BFSI in end-user industries, Talent Acquisition in service type categories, and Machine Learning & Predictive Analytics in technology types due to their scalability, precision, and adaptability.

Segmental Analysis

The market is segmented by end-user industry, service type, technology type, and region. End-user industries include BFSI, healthcare & life sciences, manufacturing, retail & e-commerce, IT/ITeS & software, telecom & media, energy, utilities & mining, transportation, logistics & aviation, public sector & government, education, hospitality & travel, pharma & biotech, construction & real estate, agriculture & food processing, and non-profit & NGOs.

Service type categories encompass talent acquisition & recruitment, onboarding automation & employee experience portals, performance management & continuous feedback systems, learning & development, employee engagement & wellbeing analytics, workforce planning & predictive analytics, compliance & risk management, and payroll & benefits optimization. Technology types include machine learning & predictive analytics, natural language processing (NLP), computer vision, generative AI, and robotic process automation. Regionally, the scope spans North America, Latin America, Europe, East Asia, South Asia & Pacific, and the Middle East & Africa.
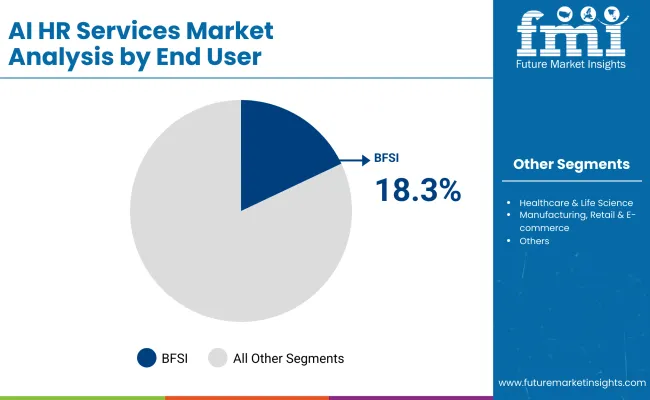
Insights into the End-User Industry Segment with BFSI Leading in Market Share

Ai Hr Services Market By Enduser

End User Industry Segment Market Value Share, 2025
BFSI 18.3%
Others 81.7%

The BFSI segment is projected to contribute 18.3% of the Global AI HR Services Market revenue in 2025, maintaining its lead as the dominant end-user category. This is driven by ongoing demand for AI-driven compliance hiring, large-scale workforce planning, and risk-based talent analytics. BFSI organizations have been among the earliest adopters of AI HR tools to ensure regulatory adherence while improving operational efficiency.

The segment’s growth is also supported by the sector’s emphasis on bias detection, fraud risk mitigation in hiring, and predictive performance analytics for critical roles. As AI adoption deepens in banking and insurance, providers are integrating advanced machine learning models into recruitment and employee engagement platforms. The BFSI segment is expected to retain its position as the backbone of AI HR adoption globally.
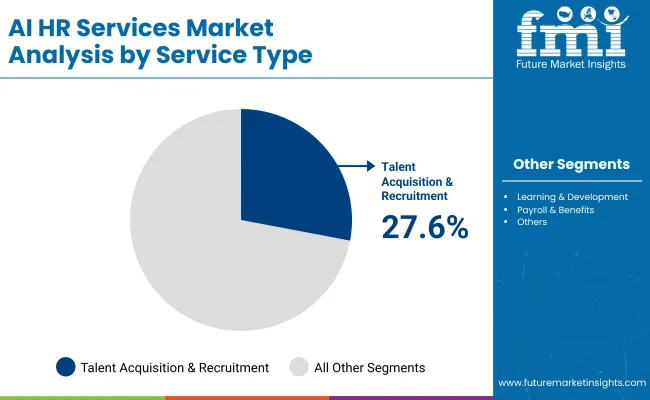
Insights into the Service Type Segment with Talent Acquisition & Recruitment Dominating the Demand

Ai Hr Services Market By Service

Service Type Segment Market Value Share, 2025
Talent Acquisition & Recruitment 27.6%
Segment 72.4%

The Talent Acquisition & Recruitment segment is forecasted to hold 27.6% of the market share in 2025, led by its application in high-volume hiring, automated candidate screening, and predictive fit scoring. This service type is favored for its ability to reduce time-to-hire, improve candidate matching accuracy, and remove repetitive manual screening tasks. Its integration with AI chatbots, ATS platforms, and bias-mitigation algorithms has facilitated widespread adoption in enterprise recruitment operations.

The segment’s growth is bolstered by advancements in natural language processing and machine learning that improve resume parsing and candidate ranking. As industries increasingly require faster and more data-driven hiring decisions, Talent Acquisition & Recruitment is expected to continue its dominance in the market.

Insights into the Technology Type Segment with Machine Learning & Predictive Analytics Leading

Technology Type Segment Market Value Share, 2025
Machine Learning & Predictive Analytics 33.8%
Segment 6 6.2%

The Machine Learning & Predictive Analytics segment is projected to account for 33.8% of the Global AI HR Services Market revenue in 2025, establishing it as the leading technology type. This technology is preferred for its ability to deliver predictive workforce insights, attrition risk scores, and optimized talent deployment based on historical and real-time data. Its suitability for large-scale HR data processing and compatibility with both standalone AI tools and integrated HCM suites has made it popular across BFSI, healthcare, manufacturing, and IT/ITeS.

Developments in algorithmic modeling and cloud-based AI platforms have enhanced accuracy, speed, and scalability, enabling better workforce planning and strategic decision-making. Given its balance of predictive power and adaptability, Machine Learning & Predictive Analytics is expected to maintain its leading role in the Global AI HR Services Market.

What are the Drivers, Restraints, and Key Trends of the Global AI HR Service Market?

Drivers

Regulatory-Driven AI Deployment in BFSI and Healthcare

In BFSI, AI is being used to ensure that hiring, background checks, and training records meet compliance requirements under strict audit environments. In healthcare, credential verification and license renewals for clinical staff are increasingly automated with AI HR tools to meet HIPAA and local regulatory timelines. This creates a continuous demand cycle as regulations evolve, forcing updates and expansion of AI systems. Vendors that can embed explainable AI into compliance workflows are gaining a competitive advantage in these sectors.

Shift from Role-Based to Skills-Based Workforce Models

AI HR services are enabling organizations to break down job roles into granular skill units and match them dynamically with project needs. This approach supports faster reskilling and redeployment of employees in industries undergoing rapid technological change. The model also enables cross-border talent allocation in global enterprises without needing to redefine organizational structures. As remote work normalizes, AI-driven skills mapping is becoming a foundation for global workforce optimization.

Restraints

Algorithmic Bias and Litigation Risk

Bias in AI recruitment algorithms has been linked to discriminatory hiring outcomes, sparking legal action and public scrutiny. Enterprises face brand and financial risks if deployed systems cannot provide transparent, bias-free decision-making. This is prompting some companies to slow down procurement and pilot AI systems in limited functions before enterprise-wide rollout. Vendors are under pressure to offer bias audit tools and certification to maintain buyer confidence.

Integration Bottlenecks with Legacy HRMS

Organizations with heavily customized or outdated HR management systems often find it challenging to integrate modern AI solutions. The problem is particularly acute in industries with long IT replacement cycles, like manufacturing and public services. These integration challenges not only delay implementation timelines but also inflate project costs, deterring mid-sized enterprises from adoption. Vendors that can offer modular, API-driven integration are more likely to penetrate these segments.

Key Trends

Rise of AI-Driven Workforce Wellbeing Platforms

Enterprises are using AI to track sentiment in employee communications, monitor engagement levels, and flag potential burnout risks. This has become especially relevant in high-stress sectors such as healthcare, customer service, and financial trading floors. Integration with wearable devices and health apps is enabling proactive wellbeing interventions. This trend is also feeding into corporate ESG commitments by linking wellbeing metrics to sustainability and governance goals.

Integration of AI HR Services into ESG and DEI Reporting

Companies are embedding AI HR analytics into sustainability dashboards to track diversity and inclusion targets in real time. In Europe, this is becoming a compliance necessity under expanding non-financial reporting rules. Automated DEI reporting reduces manual effort and improves accuracy in disclosures to regulators and investors. This trend is also driving a new wave of partnerships between AI HR vendors and ESG data platforms.
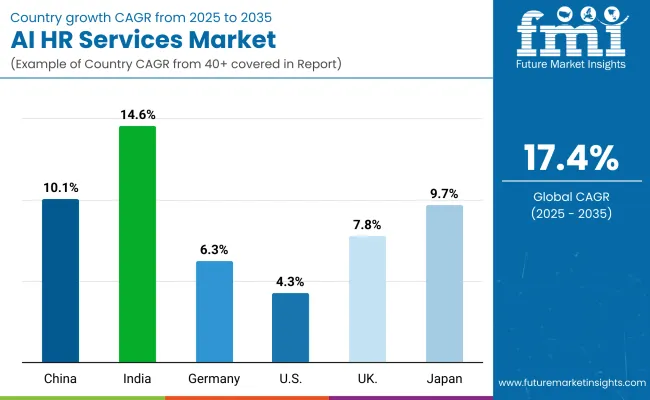
Analysis of Global AI HR Services Market By Key Countries

Ai Hr Services Market By Country

Countries CAGR (2025 to 2035)
China 10.1%
India 14.6%
Germany 6.3%
USA 4.3%
UK 7.8%
Japan 9.7%

The Global AI HR Services Market shows a pronounced regional disparity in adoption speed, strongly influenced by regulatory mandates, digital transformation maturity, and AI readiness in HR infrastructure. Asia-Pacific emerges as the fastest-growing region, anchored by India at 14.6% CAGR and China at 10.1% CAGR. This acceleration is driven by large-scale digital workforce transformation programs, rapid adoption of AI-powered learning platforms, and government-backed mandates for skill development and compliance automation.

China’s regulatory framework promoting AI-driven upskilling in manufacturing, BFSI, and public administration further accelerates adoption of AI HR services for workforce planning and employee engagement. India’s trajectory reflects rising integration of AI HR tools among large IT services exporters and manufacturing hubs, supporting both domestic talent development and export-oriented service delivery.

Europe maintains a stable growth profile, led by Germany at 6.3% CAGR and the UK at 7.8% CAGR, supported by stringent labor compliance frameworks, skill certification requirements, and enterprise investment in predictive workforce analytics. High penetration of AI-enabled HCM suites and strong uptake in BFSI and manufacturing keep Europe competitive with Asia-Pacific, particularly in adoption for compliance tracking, employee wellbeing analytics, and hybrid work enablement.

North America shows moderate expansion, with the USA at 4.3% CAGR, reflecting maturity in large enterprise adoption and a slower pace of market share growth compared to Asia-Pacific. Growth in North America is more service-driven, with increasing demand for AI-enabled learning and development, DEI compliance analytics, and cloud-native employee engagement platforms rather than pure process automation. Japan, with a CAGR of 9.7%, stands out in Asia for its focus on AI HR applications in aging workforce management, employee reskilling, and manufacturing productivity optimization.

Sales Outlook for AI HR Services Market in the United States

Year USA AI HR Services (USD Miilion)
2025 2363.84
2026 2815.94
2027 3354.51
2028 3996.08
2029 4760.35
2030 5670.79
2031 6755.36
2032 8047.37
2033 9586.47
2034 11419.94
2035 13604.07

The AI HR Services Market in the United States is projected to grow at a CAGR of 4.3%, led by increased investment across BFSI, healthcare, and IT services. BFSI alone accounts for 21.4% of the USA market in 2025 (USD 506.84 million), driven by compliance automation and predictive workforce planning. Enterprise-wide adoption of AI HR platforms is also rising in healthcare for credential management and in technology firms for skills-based talent deployment. Demand for analytics-driven employee engagement and integrated DEI compliance reporting is creating opportunities for SaaS-based platform providers.

  • BFSI dominates as a major use case for AI HR deployment in compliance-heavy hiring and training.
  • Healthcare organizations are using AI HR services for license management and workforce scheduling.
  • Large technology firms are integrating skills mapping into internal mobility programs.

Growth and Expansion Outlook for AI HR Services Market in the United Kingdom

The AI HR Services Market in the United Kingdom is expected to grow at a CAGR of 7.8%, supported by applications in public sector workforce planning, financial services compliance, and hybrid workforce engagement. Large banking institutions have accelerated usage of AI-driven recruitment and bias detection tools to improve hiring quality and meet fairness mandates. Government departments and universities are integrating AI HR platforms for talent development and compliance reporting. The corporate sector is adopting predictive analytics for succession planning and retention risk management.

  • Banking and finance firms are using AI for automated candidate screening and DEI compliance.
  • Public institutions are digitizing workforce management for greater transparency.
  • Corporates are embedding predictive workforce analytics for long-term planning.

Growth and Expansion Outlook for AI HR Services Market in India

India is witnessing rapid growth in AI HR Services, which is forecast to expand at a CAGR of 14.6% through 2035. A sharp increase in deployments across tier-1 and tier-2 cities is being driven by large IT services providers and manufacturing clusters. Enterprises are leveraging AI HR services for high-volume recruitment, AI-powered learning programs, and employee wellbeing analytics. Educational institutions and vocational training centers are integrating AI into skill development curricula.

  • Tier-2 city adoption is accelerating due to affordable cloud-based AI HR platforms.
  • IT services firms are embedding AI HR tools in campus hiring and onboarding processes.
  • Manufacturing units are adopting predictive analytics for workforce optimization.

Sales Outlook for AI HR Services Market in China

Countries 2025
China 12.3%
India 5.2%
Germany 11.2%
USA 21.4%
UK 9.2%
Japan 8.1%
Countries 2035
China 13.4%
India 6.2%
Germany 10.1%
USA 24.7%
UK 8.1%
Japan 7.2%

The AI HR Services Market in China is expected to grow at a CAGR of 10.1%. This momentum is driven by smart workforce transformation programs, large-scale AI learning and development initiatives, and competitive innovation by domestic HR tech firms. Learning & Development is a leading service type in China, reflecting strong corporate and government investment in upskilling. Affordable AI HR platforms from local providers are enabling adoption across SMEs, education, and government bodies.

  • Large-scale reskilling programs are driving adoption of AI-powered learning platforms.
  • Enterprises in manufacturing and tech are integrating AI HR analytics for workforce planning.
  • Local vendors are expanding adoption with competitively priced SaaS HR solutions.

Opportunity Analysis of USA AI HR Services Market

End User Industry Segment Market Value Share, 2025
BFSI 21.2%
Others 78.8%

The AI HR Services Market in the USA is valued at USD 2,363.84 million in 2025, with BFSI leading at 21.2% (USD 501.13 million), followed by other industries collectively accounting for 78.8% (USD 1,862.71 million). The dominance of BFSI is due to its heavy reliance on AI-driven recruitment, fraud risk assessment in hiring, and advanced workforce analytics. The USA BFSI sector’s compliance-heavy hiring environment favors AI tools for background checks, skill validation, and predictive employee retention models.

AI-driven HR systems are also crucial for managing large, distributed workforces, ensuring efficiency, and meeting regulatory obligations. As digital banking and fintech services expand, AI-enabled talent management platforms will see stronger demand, especially in specialized roles like cybersecurity and quantitative analytics. Other industries, while diverse, are adopting AI HR services for cost optimization, workforce planning, and real-time performance analytics, further fueling market growth.

Opportunity Analysis of China AI HR Services Market

Service Segment Market Value Share, 2025
Learning & Development 26.7%
Others 73.3%

The AI HR Services Market in China is valued at USD 1,358.70 million in 2025, with Learning & Development leading at 26.7% (USD 362.21 million).This reflects China’s aggressive upskilling initiatives in AI, robotics, and automation-focused industries. L&D services powered by AI enable real-time skill gap assessments, adaptive learning paths, and performance trackingcritical in China’s rapidly transforming industrial and tech ecosystem.

The government’s emphasis on digital talent development, combined with corporate re-skilling programs, drives adoption. Other segmentsincluding recruitment, employee engagement, and HR analyticsremain vital, particularly in manufacturing, e-commerce, and technology sectors undergoing automation and global expansion. As China’s talent demand diversifies, AI HR services will be integral to sustaining workforce competitiveness.
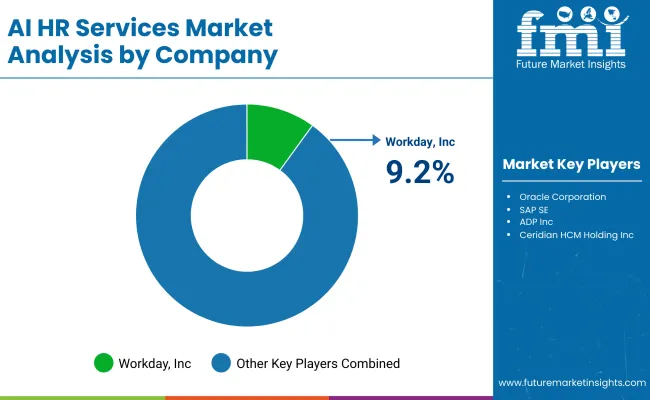
Competitive Landscape of Global AI HR Services Market

Ai Hr Services Market By Company

The Global AI HR Services Market is moderately fragmented, with global leaders, mid-sized innovators, and niche-focused specialists competing across diverse application areas. Global technology leaders such as Workday, Inc., Oracle Corporation, and SAP SE hold significant market share, driven by integrated AI capabilities, predictive workforce analytics, and deep alignment with enterprise HCM systems. Their strategies increasingly emphasize bias detection, AI-powered skills mapping, and end-to-end talent lifecycle management for industries like BFSI, healthcare, and manufacturing.

Established mid-sized players, including UKG Inc., Ceridian HCM Holding Inc., and Cornerstone OnDemand, Inc., cater to the demand for scalable cloud-based HR solutions with AI-enhanced modules. These companies are accelerating adoption through flexible deployment models, configurable workflows, and integration with learning management platforms, making them highly relevant for employee engagement, L&D, and compliance management.

Specialized providers such as Eightfold AI, Inc., HireVue, Inc., and Phenom People, Inc. focus on application-specific AI solutions for talent acquisition, candidate experience enhancement, and workforce planning. Their strength lies in AI model specialization, rapid innovation cycles, and the ability to address unique industry needs rather than purely competing on global scale. Competitive differentiation is shifting away from core HR process automation toward integrated ecosystems that include predictive analytics, AI-driven employee wellbeing tools, and subscription-based service models with embedded DEI and ESG reporting capabilities.

Key Developments in Global AI HR Services Market

  • On March 19, 2025, Workday launched its Spring 2025 release with over 350 new product features and AI enhancements, including Illuminate AI Agents and an Agent System of Record (ASR), enabling governed deployment of AI agents across HR, finance, and planning.
  • On April 16, 2025, Oracle introduced AI Agent Studio within Fusion Cloud HCM, allowing HR teams to build custom AI agents to automate tasks such as career planning, performance guidance, and workflow approvals, alongside the Cloud HCM 25A generative AI upgrade.

Scope of the Report

Item Value
Quantitative Units USD 11,046 million
Service Type Talent Acquisition & Recruitment, Onboarding Automation & Employee Experience Portals, Performance Management & Continuous Feedback Systems, Learning & Development, Employee Engagement & Wellbeing Analytics, Workforce Planning & Predictive Analytics, Compliance & Risk Management, Payroll & Benefits Optimization
Technology Type Machine Learning & Predictive Analytics, Natural Language Processing, Computer Vision, Generative AI, Robotic Process Automation
End-User Industry BFSI, Healthcare & Life Sciences, Manufacturing, Retail & E-commerce, IT/ ITeS & Software, Telecom & Media, Energy, Utilities & Mining, Transp ortation, Logistics & Aviation, Education, Pharma & Biotech
Regions Covered North America, Europe, Asia-Pacific, Latin America, Middle East & Africa
Country Covered United States, Canada, Germany, France, United Kingdom, China, Japan, India, Brazil, South Africa
Key Companies Profiled Workday, Inc., Oracle Corporation, SAP SE, ADP, Inc., Ceridian HCM Holding Inc., UKG Inc., Cornerstone OnDemand, Inc., IBM Corporation, Eightfold AI, Inc., HireVue, Inc., iCIMS, Inc., Phenom People, Inc., Talview, Inc., Harver B.V., SmartRecruiters, Inc.
Additional Attributes D ollar sales by service type and end-user industry, adoption trends in compliance automation and AI-driven workforce planning, rising demand for AI-based talent acquisition and learning platforms, sector-specific growth in BFSI, healthcare, and manufacturing, technology adoption segmentation, integration with ESG/DEI compliance analytics and cloud HCM suites, regional trends influenced by digital transformation mandates, and innovations in machine learning, NLP, and generative AI applications in HR.

Key Segments

By End User Industry:

  • BFSI
  • Healthcare & Life Sciences
  • Manufacturing
  • Retail & E-commerce
  • IT/ITeS & Software
  • Telecom & Media
  • Energy, Utilities & Mining
  • Transportation, Logistics & Aviation
  • Education
  • Pharma & Biotech

By Service Type:

  • Talent Acquisition & Recruitment
  • Onboarding Automation & Employee Experience Portals
  • Performance Management & Continuous Feedback Systems
  • Learning & Development
  • Employee Engagement & Wellbeing Analytics
  • Workforce Planning & Predictive Analytics
  • Compliance & Risk Management
  • Payroll & Benefits Optimization

By Technology Type:

  • Machine Learning & Predictive Analytics
  • Natural Language Processing
  • Computer Vision
  • Generative AI
  • Robotic Process Automation

By Region:

  • North America
  • Latin America
  • Europe
  • East Asia
  • South Asia & Pacific
  • Middle East and Africa

Table of Content

  1. Executive Summary
    • Global Market Outlook
    • Demand-side Trends
    • Supply-side Trends
    • Technology Roadmap Analysis
    • Analysis and Recommendations
  2. Market Overview
    • Market Coverage / Taxonomy
    • Market Definition / Scope / Limitations
  3. Market Background
    • Market Dynamics
      • Drivers
      • Restraints
      • Opportunity
      • Trends
    • Scenario Forecast
      • Demand in Optimistic Scenario
      • Demand in Likely Scenario
      • Demand in Conservative Scenario
    • Opportunity Map Analysis
    • Product Life Cycle Analysis
    • Supply Chain Analysis
      • Supply Side Participants and their Roles
        • Producers
        • Mid-Level Participants (Traders/ Agents/ Brokers)
        • Wholesalers and Distributors
      • Value Added and Value Created at Node in the Supply Chain
      • List of Raw Material Suppliers
      • List of Existing and Potential Buyer’s
    • Investment Feasibility Matrix
    • Value Chain Analysis
      • Profit Margin Analysis
      • Wholesalers and Distributors
      • Retailers
    • PESTLE and Porter’s Analysis
    • Regulatory Landscape
      • By Key Regions
      • By Key Countries
    • Regional Parent Market Outlook
    • Production and Consumption Statistics
    • Import and Export Statistics
  4. Global Market Analysis 2020 to 2024 and Forecast, 2025 to 2035
    • Historical Market Size Value (USD Million) & Volume (Units) Analysis, 2020 to 2024
    • Current and Future Market Size Value (USD Million) & Volume (Units) Projections, 2025 to 2035
      • Y-o-Y Growth Trend Analysis
      • Absolute $ Opportunity Analysis
  5. Global Market Analysis 2020 to 2024 and Forecast 2025 to 2035, By End User Industry
    • Introduction / Key Findings
    • Historical Market Size Value (USD Million) & Volume (Units) Analysis By End User Industry, 2020 to 2024
    • Current and Future Market Size Value (USD Million) & Volume (Units) Analysis and Forecast By End User Industry, 2025 to 2035
      • BFSI
      • Healthcare & Life Sciences
      • Manufacturing
      • Retail & E-commerce
      • IT/ITeS & Software
      • Telecom & Media
      • Energy, Utilities & Mining
      • Transportation, Logistics & Aviation
      • Education
      • Pharma & Biotech
    • Y-o-Y Growth Trend Analysis By End User Industry, 2020 to 2024
    • Absolute $ Opportunity Analysis By End User Industry, 2025 to 2035
  6. Global Market Analysis 2020 to 2024 and Forecast 2025 to 2035, By Service Type
    • Introduction / Key Findings
    • Historical Market Size Value (USD Million) & Volume (Units) Analysis By Service Type, 2020 to 2024
    • Current and Future Market Size Value (USD Million) & Volume (Units) Analysis and Forecast By Service Type, 2025 to 2035
      • Talent Acquisition & Recruitment
      • Onboarding Automation & Employee Experience Portals
      • Performance Management & Continuous Feedback Systems
      • Learning & Development
      • Employee Engagement & Wellbeing Analytics
      • Workforce Planning & Predictive Analytics
      • Compliance & Risk Management
      • Payroll & Benefits Optimization
    • Y-o-Y Growth Trend Analysis By Service Type, 2020 to 2024
    • Absolute $ Opportunity Analysis By Service Type, 2025 to 2035
  7. Global Market Analysis 2020 to 2024 and Forecast 2025 to 2035, By Technology Type
    • Introduction / Key Findings
    • Historical Market Size Value (USD Million) & Volume (Units) Analysis By Technology Type, 2020 to 2024
    • Current and Future Market Size Value (USD Million) & Volume (Units) Analysis and Forecast By Technology Type, 2025 to 2035
      • Machine Learning & Predictive Analytics
      • Natural Language Processing
      • Computer Vision
      • Generative AI
      • Robotic Process Automation
    • Y-o-Y Growth Trend Analysis By Technology Type, 2020 to 2024
    • Absolute $ Opportunity Analysis By Technology Type, 2025 to 2035
  8. Global Market Analysis 2020 to 2024 and Forecast 2025 to 2035, By Region
    • Introduction
    • Historical Market Size Value (USD Million) & Volume (Units) Analysis By Region, 2020 to 2024
    • Current Market Size Value (USD Million) & Volume (Units) Analysis and Forecast By Region, 2025 to 2035
      • North America
      • Latin America
      • Europe
      • East Asia
      • South Asia & Pacific
      • Middle East and Africa
    • Market Attractiveness Analysis By Region
  9. North America Market Analysis 2020 to 2024 and Forecast 2025 to 2035, By Country
    • Historical Market Size Value (USD Million) & Volume (Units) Trend Analysis By Market Taxonomy, 2020 to 2024
    • Market Size Value (USD Million) & Volume (Units) Forecast By Market Taxonomy, 2025 to 2035
      • By Country
        • USA
        • Canada
      • By End User Industry
      • By Service Type
      • By Technology Type
    • Market Attractiveness Analysis
      • By Country
      • By End User Industry
      • By Service Type
      • By Technology Type
    • Key Takeaways
  10. Latin America Market Analysis 2020 to 2024 and Forecast 2025 to 2035, By Country
    • Historical Market Size Value (USD Million) & Volume (Units) Trend Analysis By Market Taxonomy, 2020 to 2024
    • Market Size Value (USD Million) & Volume (Units) Forecast By Market Taxonomy, 2025 to 2035
      • By Country
        • Brazil
        • Mexico
        • Colombia
        • Rest of Latin America
      • By End User Industry
      • By Service Type
      • By Technology Type
    • Market Attractiveness Analysis
      • By Country
      • By End User Industry
      • By Service Type
      • By Technology Type
    • Key Takeaways
  11. Europe Market Analysis 2020 to 2024 and Forecast 2025 to 2035, By Country
    • Historical Market Size Value (USD Million) & Volume (Units) Trend Analysis By Market Taxonomy, 2020 to 2024
    • Market Size Value (USD Million) & Volume (Units) Forecast By Market Taxonomy, 2025 to 2035
      • By Country
        • Germany
        • UK
        • France
        • Italy
        • Spain
        • Belgium
        • Netherlands
        • Nordic
        • Switzerland
        • Russia
        • Poland
        • Rest of Europe
      • By End User Industry
      • By Service Type
      • By Technology Type
    • Market Attractiveness Analysis
      • By Country
      • By End User Industry
      • By Service Type
      • By Technology Type
    • Key Takeaways
  12. East Asia Market Analysis 2020 to 2024 and Forecast 2025 to 2035, By Country
    • Historical Market Size Value (USD Million) & Volume (Units) Trend Analysis By Market Taxonomy, 2020 to 2024
    • Market Size Value (USD Million) & Volume (Units) Forecast By Market Taxonomy, 2025 to 2035
      • By Country
        • China
        • Japan
        • South Korea
      • By End User Industry
      • By Service Type
      • By Technology Type
    • Market Attractiveness Analysis
      • By Country
      • By End User Industry
      • By Service Type
      • By Technology Type
    • Key Takeaways
  13. South Asia & Pacific Market Analysis 2020 to 2024 and Forecast 2025 to 2035, By Country
    • Historical Market Size Value (USD Million) & Volume (Units) Trend Analysis By Market Taxonomy, 2020 to 2024
    • Market Size Value (USD Million) & Volume (Units) Forecast By Market Taxonomy, 2025 to 2035
      • By Country
        • India
        • Thailand
        • Malaysia
        • Indonesia
        • Singapore
        • Vietnam
        • Australia
        • New Zealand
        • Rest of South Asia
      • By End User Industry
      • By Service Type
      • By Technology Type
    • Market Attractiveness Analysis
      • By Country
      • By End User Industry
      • By Service Type
      • By Technology Type
    • Key Takeaways
  14. Middle East and Africa Market Analysis 2020 to 2024 and Forecast 2025 to 2035, By Country
    • Historical Market Size Value (USD Million) & Volume (Units) Trend Analysis By Market Taxonomy, 2020 to 2024
    • Market Size Value (USD Million) & Volume (Units) Forecast By Market Taxonomy, 2025 to 2035
      • By Country
        • Turkey
        • UAE
        • Saudi Arabia
        • Israel
        • Other GCC Countries
        • North Africa
        • South Africa
      • By End User Industry
      • By Service Type
      • By Technology Type
    • Market Attractiveness Analysis
      • By Country
      • By End User Industry
      • By Service Type
      • By Technology Type
    • Key Takeaways
  15. Key Countries Market Analysis
    • USA
      • Pricing Analysis
      • Market Share Analysis, 2024
        • By End User Industry
        • By Service Type
        • By Technology Type
    • Canada
      • Pricing Analysis
      • Market Share Analysis, 2024
        • By End User Industry
        • By Service Type
        • By Technology Type
    • Brazil
      • Pricing Analysis
      • Market Share Analysis, 2024
        • By End User Industry
        • By Service Type
        • By Technology Type
    • Mexico
      • Pricing Analysis
      • Market Share Analysis, 2024
        • By End User Industry
        • By Service Type
        • By Technology Type
    • Colombia
      • Pricing Analysis
      • Market Share Analysis, 2024
        • By End User Industry
        • By Service Type
        • By Technology Type
    • Rest of Latin America
      • Pricing Analysis
      • Market Share Analysis, 2024
        • By End User Industry
        • By Service Type
        • By Technology Type
    • Germany
      • Pricing Analysis
      • Market Share Analysis, 2024
        • By End User Industry
        • By Service Type
        • By Technology Type
    • UK
      • Pricing Analysis
      • Market Share Analysis, 2024
        • By End User Industry
        • By Service Type
        • By Technology Type
    • France
      • Pricing Analysis
      • Market Share Analysis, 2024
        • By End User Industry
        • By Service Type
        • By Technology Type
    • Italy
      • Pricing Analysis
      • Market Share Analysis, 2024
        • By End User Industry
        • By Service Type
        • By Technology Type
    • Spain
      • Pricing Analysis
      • Market Share Analysis, 2024
        • By End User Industry
        • By Service Type
        • By Technology Type
    • Belgium
      • Pricing Analysis
      • Market Share Analysis, 2024
        • By End User Industry
        • By Service Type
        • By Technology Type
    • Netherlands
      • Pricing Analysis
      • Market Share Analysis, 2024
        • By End User Industry
        • By Service Type
        • By Technology Type
    • Nordic
      • Pricing Analysis
      • Market Share Analysis, 2024
        • By End User Industry
        • By Service Type
        • By Technology Type
    • Switzerland
      • Pricing Analysis
      • Market Share Analysis, 2024
        • By End User Industry
        • By Service Type
        • By Technology Type
    • Russia
      • Pricing Analysis
      • Market Share Analysis, 2024
        • By End User Industry
        • By Service Type
        • By Technology Type
    • Poland
      • Pricing Analysis
      • Market Share Analysis, 2024
        • By End User Industry
        • By Service Type
        • By Technology Type
    • Rest of Europe
      • Pricing Analysis
      • Market Share Analysis, 2024
        • By End User Industry
        • By Service Type
        • By Technology Type
    • China
      • Pricing Analysis
      • Market Share Analysis, 2024
        • By End User Industry
        • By Service Type
        • By Technology Type
    • Japan
      • Pricing Analysis
      • Market Share Analysis, 2024
        • By End User Industry
        • By Service Type
        • By Technology Type
    • South Korea
      • Pricing Analysis
      • Market Share Analysis, 2024
        • By End User Industry
        • By Service Type
        • By Technology Type
    • India
      • Pricing Analysis
      • Market Share Analysis, 2024
        • By End User Industry
        • By Service Type
        • By Technology Type
    • Thailand
      • Pricing Analysis
      • Market Share Analysis, 2024
        • By End User Industry
        • By Service Type
        • By Technology Type
    • Malaysia
      • Pricing Analysis
      • Market Share Analysis, 2024
        • By End User Industry
        • By Service Type
        • By Technology Type
    • Indonesia
      • Pricing Analysis
      • Market Share Analysis, 2024
        • By End User Industry
        • By Service Type
        • By Technology Type
    • Singapore
      • Pricing Analysis
      • Market Share Analysis, 2024
        • By End User Industry
        • By Service Type
        • By Technology Type
    • Vietnam
      • Pricing Analysis
      • Market Share Analysis, 2024
        • By End User Industry
        • By Service Type
        • By Technology Type
    • Australia
      • Pricing Analysis
      • Market Share Analysis, 2024
        • By End User Industry
        • By Service Type
        • By Technology Type
    • New Zealand
      • Pricing Analysis
      • Market Share Analysis, 2024
        • By End User Industry
        • By Service Type
        • By Technology Type
    • Rest of South Asia
      • Pricing Analysis
      • Market Share Analysis, 2024
        • By End User Industry
        • By Service Type
        • By Technology Type
  16. Market Structure Analysis
    • Competition Dashboard
    • Competition Benchmarking
    • Market Share Analysis of Top Players
      • By Regional
      • By End User Industry
      • By Service Type
      • By Technology Type
  17. Competition Analysis
    • Competition Deep Dive
      • Workday, Inc.
        • Overview
        • Product Portfolio
        • Profitability by Market Segments (Product/Age /Sales Channel/Region)
        • Sales Footprint
        • Strategy Overview
          • Marketing Strategy
          • Product Strategy
          • Channel Strategy
      • Oracle Corporation
        • Overview
        • Product Portfolio
        • Profitability by Market Segments (Product/Age /Sales Channel/Region)
        • Sales Footprint
        • Strategy Overview
          • Marketing Strategy
          • Product Strategy
          • Channel Strategy
      • SAP SE
        • Overview
        • Product Portfolio
        • Profitability by Market Segments (Product/Age /Sales Channel/Region)
        • Sales Footprint
        • Strategy Overview
          • Marketing Strategy
          • Product Strategy
          • Channel Strategy
      • ADP, Inc.
        • Overview
        • Product Portfolio
        • Profitability by Market Segments (Product/Age /Sales Channel/Region)
        • Sales Footprint
        • Strategy Overview
          • Marketing Strategy
          • Product Strategy
          • Channel Strategy
      • Ceridian HCM Holding Inc.
        • Overview
        • Product Portfolio
        • Profitability by Market Segments (Product/Age /Sales Channel/Region)
        • Sales Footprint
        • Strategy Overview
          • Marketing Strategy
          • Product Strategy
          • Channel Strategy
      • UKG Inc.
        • Overview
        • Product Portfolio
        • Profitability by Market Segments (Product/Age /Sales Channel/Region)
        • Sales Footprint
        • Strategy Overview
          • Marketing Strategy
          • Product Strategy
          • Channel Strategy
      • Cornerstone OnDemand, Inc.
        • Overview
        • Product Portfolio
        • Profitability by Market Segments (Product/Age /Sales Channel/Region)
        • Sales Footprint
        • Strategy Overview
          • Marketing Strategy
          • Product Strategy
          • Channel Strategy
      • IBM Corporation
        • Overview
        • Product Portfolio
        • Profitability by Market Segments (Product/Age /Sales Channel/Region)
        • Sales Footprint
        • Strategy Overview
          • Marketing Strategy
          • Product Strategy
          • Channel Strategy
      • Eightfold AI, Inc.
        • Overview
        • Product Portfolio
        • Profitability by Market Segments (Product/Age /Sales Channel/Region)
        • Sales Footprint
        • Strategy Overview
          • Marketing Strategy
          • Product Strategy
          • Channel Strategy
      • HireVue, Inc.
        • Overview
        • Product Portfolio
        • Profitability by Market Segments (Product/Age /Sales Channel/Region)
        • Sales Footprint
        • Strategy Overview
          • Marketing Strategy
          • Product Strategy
          • Channel Strategy
      • iCIMS, Inc.
        • Overview
        • Product Portfolio
        • Profitability by Market Segments (Product/Age /Sales Channel/Region)
        • Sales Footprint
        • Strategy Overview
          • Marketing Strategy
          • Product Strategy
          • Channel Strategy
      • Phenom People, Inc.
        • Overview
        • Product Portfolio
        • Profitability by Market Segments (Product/Age /Sales Channel/Region)
        • Sales Footprint
        • Strategy Overview
          • Marketing Strategy
          • Product Strategy
          • Channel Strategy
      • Talview, Inc.
        • Overview
        • Product Portfolio
        • Profitability by Market Segments (Product/Age /Sales Channel/Region)
        • Sales Footprint
        • Strategy Overview
          • Marketing Strategy
          • Product Strategy
          • Channel Strategy
      • Harver B.V.
        • Overview
        • Product Portfolio
        • Profitability by Market Segments (Product/Age /Sales Channel/Region)
        • Sales Footprint
        • Strategy Overview
          • Marketing Strategy
          • Product Strategy
          • Channel Strategy
      • SmartRecruiters, Inc.
        • Overview
        • Product Portfolio
        • Profitability by Market Segments (Product/Age /Sales Channel/Region)
        • Sales Footprint
        • Strategy Overview
          • Marketing Strategy
          • Product Strategy
          • Channel Strategy
  18. Assumptions & Acronyms Used
  19. Research Methodology

List of Tables

  • Table 1: Global Market Value (USD Million) Forecast by Region, 2020-2035
  • Table 2: Global Market Volume (Units) Forecast by Region, 2020-2035
  • Table 3: Global Market Value (USD Million) Forecast by End User Industry, 2020-2035
  • Table 4: Global Market Volume (Units) Forecast by End User Industry, 2020-2035
  • Table 5: Global Market Value (USD Million) Forecast by Service Type, 2020-2035
  • Table 6: Global Market Volume (Units) Forecast by Service Type, 2020-2035
  • Table 7: Global Market Value (USD Million) Forecast by Technology Type, 2020-2035
  • Table 8: Global Market Volume (Units) Forecast by Technology Type, 2020-2035
  • Table 9: North America Market Value (USD Million) Forecast by Country, 2020-2035
  • Table 10: North America Market Volume (Units) Forecast by Country, 2020-2035
  • Table 11: North America Market Value (USD Million) Forecast by End User Industry, 2020-2035
  • Table 12: North America Market Volume (Units) Forecast by End User Industry, 2020-2035
  • Table 13: North America Market Value (USD Million) Forecast by Service Type, 2020-2035
  • Table 14: North America Market Volume (Units) Forecast by Service Type, 2020-2035
  • Table 15: North America Market Value (USD Million) Forecast by Technology Type, 2020-2035
  • Table 16: North America Market Volume (Units) Forecast by Technology Type, 2020-2035
  • Table 17: Latin America Market Value (USD Million) Forecast by Country, 2020-2035
  • Table 18: Latin America Market Volume (Units) Forecast by Country, 2020-2035
  • Table 19: Latin America Market Value (USD Million) Forecast by End User Industry, 2020-2035
  • Table 20: Latin America Market Volume (Units) Forecast by End User Industry, 2020-2035
  • Table 21: Latin America Market Value (USD Million) Forecast by Service Type, 2020-2035
  • Table 22: Latin America Market Volume (Units) Forecast by Service Type, 2020-2035
  • Table 23: Latin America Market Value (USD Million) Forecast by Technology Type, 2020-2035
  • Table 24: Latin America Market Volume (Units) Forecast by Technology Type, 2020-2035
  • Table 25: Europe Market Value (USD Million) Forecast by Country, 2020-2035
  • Table 26: Europe Market Volume (Units) Forecast by Country, 2020-2035
  • Table 27: Europe Market Value (USD Million) Forecast by End User Industry, 2020-2035
  • Table 28: Europe Market Volume (Units) Forecast by End User Industry, 2020-2035
  • Table 29: Europe Market Value (USD Million) Forecast by Service Type, 2020-2035
  • Table 30: Europe Market Volume (Units) Forecast by Service Type, 2020-2035
  • Table 31: Europe Market Value (USD Million) Forecast by Technology Type, 2020-2035
  • Table 32: Europe Market Volume (Units) Forecast by Technology Type, 2020-2035
  • Table 33: East Asia Market Value (USD Million) Forecast by Country, 2020-2035
  • Table 34: East Asia Market Volume (Units) Forecast by Country, 2020-2035
  • Table 35: East Asia Market Value (USD Million) Forecast by End User Industry, 2020-2035
  • Table 36: East Asia Market Volume (Units) Forecast by End User Industry, 2020-2035
  • Table 37: East Asia Market Value (USD Million) Forecast by Service Type, 2020-2035
  • Table 38: East Asia Market Volume (Units) Forecast by Service Type, 2020-2035
  • Table 39: East Asia Market Value (USD Million) Forecast by Technology Type, 2020-2035
  • Table 40: East Asia Market Volume (Units) Forecast by Technology Type, 2020-2035
  • Table 41: South Asia & Pacific Market Value (USD Million) Forecast by Country, 2020-2035
  • Table 42: South Asia & Pacific Market Volume (Units) Forecast by Country, 2020-2035
  • Table 43: South Asia & Pacific Market Value (USD Million) Forecast by End User Industry, 2020-2035
  • Table 44: South Asia & Pacific Market Volume (Units) Forecast by End User Industry, 2020-2035
  • Table 45: South Asia & Pacific Market Value (USD Million) Forecast by Service Type, 2020-2035
  • Table 46: South Asia & Pacific Market Volume (Units) Forecast by Service Type, 2020-2035
  • Table 47: South Asia & Pacific Market Value (USD Million) Forecast by Technology Type, 2020-2035
  • Table 48: South Asia & Pacific Market Volume (Units) Forecast by Technology Type, 2020-2035
  • Table 49: Middle East and Africa Market Value (USD Million) Forecast by Country, 2020-2035
  • Table 50: Middle East and Africa Market Volume (Units) Forecast by Country, 2020-2035
  • Table 51: Middle East and Africa Market Value (USD Million) Forecast by End User Industry, 2020-2035
  • Table 52: Middle East and Africa Market Volume (Units) Forecast by End User Industry, 2020-2035
  • Table 53: Middle East and Africa Market Value (USD Million) Forecast by Service Type, 2020-2035
  • Table 54: Middle East and Africa Market Volume (Units) Forecast by Service Type, 2020-2035
  • Table 55: Middle East and Africa Market Value (USD Million) Forecast by Technology Type, 2020-2035
  • Table 56: Middle East and Africa Market Volume (Units) Forecast by Technology Type, 2020-2035

List of Figures

  • Figure 1: Global Market Value (USD Million) by End User Industry, 2025-2035
  • Figure 2: Global Market Value (USD Million) by Service Type, 2025-2035
  • Figure 3: Global Market Value (USD Million) by Technology Type, 2025-2035
  • Figure 4: Global Market Value (USD Million) by Region, 2025-2035
  • Figure 5: Global Market Value (USD Million) Analysis by Region, 2020-2035
  • Figure 6: Global Market Volume (Units) Analysis by Region, 2020-2035
  • Figure 7: Global Market Value Share (%) and BPS Analysis by Region, 2025-2035
  • Figure 8: Global Market Y-o-Y Growth (%) Projections by Region, 2025-2035
  • Figure 9: Global Market Value (USD Million) Analysis by End User Industry, 2020-2035
  • Figure 10: Global Market Volume (Units) Analysis by End User Industry, 2020-2035
  • Figure 11: Global Market Value Share (%) and BPS Analysis by End User Industry, 2025-2035
  • Figure 12: Global Market Y-o-Y Growth (%) Projections by End User Industry, 2025-2035
  • Figure 13: Global Market Value (USD Million) Analysis by Service Type, 2020-2035
  • Figure 14: Global Market Volume (Units) Analysis by Service Type, 2020-2035
  • Figure 15: Global Market Value Share (%) and BPS Analysis by Service Type, 2025-2035
  • Figure 16: Global Market Y-o-Y Growth (%) Projections by Service Type, 2025-2035
  • Figure 17: Global Market Value (USD Million) Analysis by Technology Type, 2020-2035
  • Figure 18: Global Market Volume (Units) Analysis by Technology Type, 2020-2035
  • Figure 19: Global Market Value Share (%) and BPS Analysis by Technology Type, 2025-2035
  • Figure 20: Global Market Y-o-Y Growth (%) Projections by Technology Type, 2025-2035
  • Figure 21: Global Market Attractiveness by End User Industry, 2025-2035
  • Figure 22: Global Market Attractiveness by Service Type, 2025-2035
  • Figure 23: Global Market Attractiveness by Technology Type, 2025-2035
  • Figure 24: Global Market Attractiveness by Region, 2025-2035
  • Figure 25: North America Market Value (USD Million) by End User Industry, 2025-2035
  • Figure 26: North America Market Value (USD Million) by Service Type, 2025-2035
  • Figure 27: North America Market Value (USD Million) by Technology Type, 2025-2035
  • Figure 28: North America Market Value (USD Million) by Country, 2025-2035
  • Figure 29: North America Market Value (USD Million) Analysis by Country, 2020-2035
  • Figure 30: North America Market Volume (Units) Analysis by Country, 2020-2035
  • Figure 31: North America Market Value Share (%) and BPS Analysis by Country, 2025-2035
  • Figure 32: North America Market Y-o-Y Growth (%) Projections by Country, 2025-2035
  • Figure 33: North America Market Value (USD Million) Analysis by End User Industry, 2020-2035
  • Figure 34: North America Market Volume (Units) Analysis by End User Industry, 2020-2035
  • Figure 35: North America Market Value Share (%) and BPS Analysis by End User Industry, 2025-2035
  • Figure 36: North America Market Y-o-Y Growth (%) Projections by End User Industry, 2025-2035
  • Figure 37: North America Market Value (USD Million) Analysis by Service Type, 2020-2035
  • Figure 38: North America Market Volume (Units) Analysis by Service Type, 2020-2035
  • Figure 39: North America Market Value Share (%) and BPS Analysis by Service Type, 2025-2035
  • Figure 40: North America Market Y-o-Y Growth (%) Projections by Service Type, 2025-2035
  • Figure 41: North America Market Value (USD Million) Analysis by Technology Type, 2020-2035
  • Figure 42: North America Market Volume (Units) Analysis by Technology Type, 2020-2035
  • Figure 43: North America Market Value Share (%) and BPS Analysis by Technology Type, 2025-2035
  • Figure 44: North America Market Y-o-Y Growth (%) Projections by Technology Type, 2025-2035
  • Figure 45: North America Market Attractiveness by End User Industry, 2025-2035
  • Figure 46: North America Market Attractiveness by Service Type, 2025-2035
  • Figure 47: North America Market Attractiveness by Technology Type, 2025-2035
  • Figure 48: North America Market Attractiveness by Country, 2025-2035
  • Figure 49: Latin America Market Value (USD Million) by End User Industry, 2025-2035
  • Figure 50: Latin America Market Value (USD Million) by Service Type, 2025-2035
  • Figure 51: Latin America Market Value (USD Million) by Technology Type, 2025-2035
  • Figure 52: Latin America Market Value (USD Million) by Country, 2025-2035
  • Figure 53: Latin America Market Value (USD Million) Analysis by Country, 2020-2035
  • Figure 54: Latin America Market Volume (Units) Analysis by Country, 2020-2035
  • Figure 55: Latin America Market Value Share (%) and BPS Analysis by Country, 2025-2035
  • Figure 56: Latin America Market Y-o-Y Growth (%) Projections by Country, 2025-2035
  • Figure 57: Latin America Market Value (USD Million) Analysis by End User Industry, 2020-2035
  • Figure 58: Latin America Market Volume (Units) Analysis by End User Industry, 2020-2035
  • Figure 59: Latin America Market Value Share (%) and BPS Analysis by End User Industry, 2025-2035
  • Figure 60: Latin America Market Y-o-Y Growth (%) Projections by End User Industry, 2025-2035
  • Figure 61: Latin America Market Value (USD Million) Analysis by Service Type, 2020-2035
  • Figure 62: Latin America Market Volume (Units) Analysis by Service Type, 2020-2035
  • Figure 63: Latin America Market Value Share (%) and BPS Analysis by Service Type, 2025-2035
  • Figure 64: Latin America Market Y-o-Y Growth (%) Projections by Service Type, 2025-2035
  • Figure 65: Latin America Market Value (USD Million) Analysis by Technology Type, 2020-2035
  • Figure 66: Latin America Market Volume (Units) Analysis by Technology Type, 2020-2035
  • Figure 67: Latin America Market Value Share (%) and BPS Analysis by Technology Type, 2025-2035
  • Figure 68: Latin America Market Y-o-Y Growth (%) Projections by Technology Type, 2025-2035
  • Figure 69: Latin America Market Attractiveness by End User Industry, 2025-2035
  • Figure 70: Latin America Market Attractiveness by Service Type, 2025-2035
  • Figure 71: Latin America Market Attractiveness by Technology Type, 2025-2035
  • Figure 72: Latin America Market Attractiveness by Country, 2025-2035
  • Figure 73: Europe Market Value (USD Million) by End User Industry, 2025-2035
  • Figure 74: Europe Market Value (USD Million) by Service Type, 2025-2035
  • Figure 75: Europe Market Value (USD Million) by Technology Type, 2025-2035
  • Figure 76: Europe Market Value (USD Million) by Country, 2025-2035
  • Figure 77: Europe Market Value (USD Million) Analysis by Country, 2020-2035
  • Figure 78: Europe Market Volume (Units) Analysis by Country, 2020-2035
  • Figure 79: Europe Market Value Share (%) and BPS Analysis by Country, 2025-2035
  • Figure 80: Europe Market Y-o-Y Growth (%) Projections by Country, 2025-2035
  • Figure 81: Europe Market Value (USD Million) Analysis by End User Industry, 2020-2035
  • Figure 82: Europe Market Volume (Units) Analysis by End User Industry, 2020-2035
  • Figure 83: Europe Market Value Share (%) and BPS Analysis by End User Industry, 2025-2035
  • Figure 84: Europe Market Y-o-Y Growth (%) Projections by End User Industry, 2025-2035
  • Figure 85: Europe Market Value (USD Million) Analysis by Service Type, 2020-2035
  • Figure 86: Europe Market Volume (Units) Analysis by Service Type, 2020-2035
  • Figure 87: Europe Market Value Share (%) and BPS Analysis by Service Type, 2025-2035
  • Figure 88: Europe Market Y-o-Y Growth (%) Projections by Service Type, 2025-2035
  • Figure 89: Europe Market Value (USD Million) Analysis by Technology Type, 2020-2035
  • Figure 90: Europe Market Volume (Units) Analysis by Technology Type, 2020-2035
  • Figure 91: Europe Market Value Share (%) and BPS Analysis by Technology Type, 2025-2035
  • Figure 92: Europe Market Y-o-Y Growth (%) Projections by Technology Type, 2025-2035
  • Figure 93: Europe Market Attractiveness by End User Industry, 2025-2035
  • Figure 94: Europe Market Attractiveness by Service Type, 2025-2035
  • Figure 95: Europe Market Attractiveness by Technology Type, 2025-2035
  • Figure 96: Europe Market Attractiveness by Country, 2025-2035
  • Figure 97: East Asia Market Value (USD Million) by End User Industry, 2025-2035
  • Figure 98: East Asia Market Value (USD Million) by Service Type, 2025-2035
  • Figure 99: East Asia Market Value (USD Million) by Technology Type, 2025-2035
  • Figure 100: East Asia Market Value (USD Million) by Country, 2025-2035
  • Figure 101: East Asia Market Value (USD Million) Analysis by Country, 2020-2035
  • Figure 102: East Asia Market Volume (Units) Analysis by Country, 2020-2035
  • Figure 103: East Asia Market Value Share (%) and BPS Analysis by Country, 2025-2035
  • Figure 104: East Asia Market Y-o-Y Growth (%) Projections by Country, 2025-2035
  • Figure 105: East Asia Market Value (USD Million) Analysis by End User Industry, 2020-2035
  • Figure 106: East Asia Market Volume (Units) Analysis by End User Industry, 2020-2035
  • Figure 107: East Asia Market Value Share (%) and BPS Analysis by End User Industry, 2025-2035
  • Figure 108: East Asia Market Y-o-Y Growth (%) Projections by End User Industry, 2025-2035
  • Figure 109: East Asia Market Value (USD Million) Analysis by Service Type, 2020-2035
  • Figure 110: East Asia Market Volume (Units) Analysis by Service Type, 2020-2035
  • Figure 111: East Asia Market Value Share (%) and BPS Analysis by Service Type, 2025-2035
  • Figure 112: East Asia Market Y-o-Y Growth (%) Projections by Service Type, 2025-2035
  • Figure 113: East Asia Market Value (USD Million) Analysis by Technology Type, 2020-2035
  • Figure 114: East Asia Market Volume (Units) Analysis by Technology Type, 2020-2035
  • Figure 115: East Asia Market Value Share (%) and BPS Analysis by Technology Type, 2025-2035
  • Figure 116: East Asia Market Y-o-Y Growth (%) Projections by Technology Type, 2025-2035
  • Figure 117: East Asia Market Attractiveness by End User Industry, 2025-2035
  • Figure 118: East Asia Market Attractiveness by Service Type, 2025-2035
  • Figure 119: East Asia Market Attractiveness by Technology Type, 2025-2035
  • Figure 120: East Asia Market Attractiveness by Country, 2025-2035
  • Figure 121: South Asia & Pacific Market Value (USD Million) by End User Industry, 2025-2035
  • Figure 122: South Asia & Pacific Market Value (USD Million) by Service Type, 2025-2035
  • Figure 123: South Asia & Pacific Market Value (USD Million) by Technology Type, 2025-2035
  • Figure 124: South Asia & Pacific Market Value (USD Million) by Country, 2025-2035
  • Figure 125: South Asia & Pacific Market Value (USD Million) Analysis by Country, 2020-2035
  • Figure 126: South Asia & Pacific Market Volume (Units) Analysis by Country, 2020-2035
  • Figure 127: South Asia & Pacific Market Value Share (%) and BPS Analysis by Country, 2025-2035
  • Figure 128: South Asia & Pacific Market Y-o-Y Growth (%) Projections by Country, 2025-2035
  • Figure 129: South Asia & Pacific Market Value (USD Million) Analysis by End User Industry, 2020-2035
  • Figure 130: South Asia & Pacific Market Volume (Units) Analysis by End User Industry, 2020-2035
  • Figure 131: South Asia & Pacific Market Value Share (%) and BPS Analysis by End User Industry, 2025-2035
  • Figure 132: South Asia & Pacific Market Y-o-Y Growth (%) Projections by End User Industry, 2025-2035
  • Figure 133: South Asia & Pacific Market Value (USD Million) Analysis by Service Type, 2020-2035
  • Figure 134: South Asia & Pacific Market Volume (Units) Analysis by Service Type, 2020-2035
  • Figure 135: South Asia & Pacific Market Value Share (%) and BPS Analysis by Service Type, 2025-2035
  • Figure 136: South Asia & Pacific Market Y-o-Y Growth (%) Projections by Service Type, 2025-2035
  • Figure 137: South Asia & Pacific Market Value (USD Million) Analysis by Technology Type, 2020-2035
  • Figure 138: South Asia & Pacific Market Volume (Units) Analysis by Technology Type, 2020-2035
  • Figure 139: South Asia & Pacific Market Value Share (%) and BPS Analysis by Technology Type, 2025-2035
  • Figure 140: South Asia & Pacific Market Y-o-Y Growth (%) Projections by Technology Type, 2025-2035
  • Figure 141: South Asia & Pacific Market Attractiveness by End User Industry, 2025-2035
  • Figure 142: South Asia & Pacific Market Attractiveness by Service Type, 2025-2035
  • Figure 143: South Asia & Pacific Market Attractiveness by Technology Type, 2025-2035
  • Figure 144: South Asia & Pacific Market Attractiveness by Country, 2025-2035
  • Figure 145: Middle East and Africa Market Value (USD Million) by End User Industry, 2025-2035
  • Figure 146: Middle East and Africa Market Value (USD Million) by Service Type, 2025-2035
  • Figure 147: Middle East and Africa Market Value (USD Million) by Technology Type, 2025-2035
  • Figure 148: Middle East and Africa Market Value (USD Million) by Country, 2025-2035
  • Figure 149: Middle East and Africa Market Value (USD Million) Analysis by Country, 2020-2035
  • Figure 150: Middle East and Africa Market Volume (Units) Analysis by Country, 2020-2035
  • Figure 151: Middle East and Africa Market Value Share (%) and BPS Analysis by Country, 2025-2035
  • Figure 152: Middle East and Africa Market Y-o-Y Growth (%) Projections by Country, 2025-2035
  • Figure 153: Middle East and Africa Market Value (USD Million) Analysis by End User Industry, 2020-2035
  • Figure 154: Middle East and Africa Market Volume (Units) Analysis by End User Industry, 2020-2035
  • Figure 155: Middle East and Africa Market Value Share (%) and BPS Analysis by End User Industry, 2025-2035
  • Figure 156: Middle East and Africa Market Y-o-Y Growth (%) Projections by End User Industry, 2025-2035
  • Figure 157: Middle East and Africa Market Value (USD Million) Analysis by Service Type, 2020-2035
  • Figure 158: Middle East and Africa Market Volume (Units) Analysis by Service Type, 2020-2035
  • Figure 159: Middle East and Africa Market Value Share (%) and BPS Analysis by Service Type, 2025-2035
  • Figure 160: Middle East and Africa Market Y-o-Y Growth (%) Projections by Service Type, 2025-2035
  • Figure 161: Middle East and Africa Market Value (USD Million) Analysis by Technology Type, 2020-2035
  • Figure 162: Middle East and Africa Market Volume (Units) Analysis by Technology Type, 2020-2035
  • Figure 163: Middle East and Africa Market Value Share (%) and BPS Analysis by Technology Type, 2025-2035
  • Figure 164: Middle East and Africa Market Y-o-Y Growth (%) Projections by Technology Type, 2025-2035
  • Figure 165: Middle East and Africa Market Attractiveness by End User Industry, 2025-2035
  • Figure 166: Middle East and Africa Market Attractiveness by Service Type, 2025-2035
  • Figure 167: Middle East and Africa Market Attractiveness by Technology Type, 2025-2035
  • Figure 168: Middle East and Africa Market Attractiveness by Country, 2025-2035

Frequently Asked Questions

How big is the Global AI HR Services Market in 2025?

The Global AI HR Services Market is estimated to be valued at USD 11,046 million in 2025.

What will be the size of the Global AI HR Services Market in 2035?

The market size for the Global AI HR Services Market is projected to reach USD 55,080 million by 2035.

How much will the Global AI HR Services Market grow between 2025 and 2035?

The Global AI HR Services Market is expected to grow at a 17.4% CAGR between 2025 and 2035.

What are the key service types in the Global AI HR Services Market?

The key service types in the Global AI HR Services Market are Talent Acquisition & Recruitment, Learning & Development, Workforce Planning & Predictive Analytics, and Employee Engagement & Wellbeing Analytics.

Which end-user industry will contribute the most significant share in the Global AI HR Services Market in 2025?

In terms of end-user industry, the BFSI segment will command an 18.3% share in the Global AI HR Services Market in 2025.

Explore Similar Insights

Future Market Insights

AI HR Services Market