AI Tutoring Services Market Size and Share Forecast Outlook 2025 to 2035

The AI Tutoring Services Market is expected to record a valuation of USD 3,716.6 million in 2025 and USD 21,625.2 million in 2035, with an increase of USD 17,908.6 million, which equals a growth of 481% over the decade. The overall expansion represents a CAGR of 19.3% and nearly a 6X increase in market size.
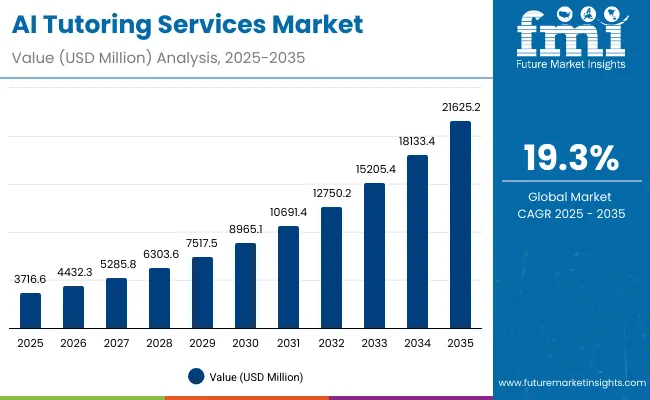
Quick Stats for AI Tutoring Services Market

  • AI Tutoring Services Market Value (2025): USD 3,716.6 million
  • AI Tutoring Services Market Forecast Value (2035): USD 21,625.2 million
  • AI Tutoring Services Market Forecast CAGR (2025 to 2035): 19.3%
  • Leading Segment in AI Tutoring Services Market in 2025: Pure AI Tutor (59.4%)
  • Key Growth Regions in the AI Tutoring Services Market: North America, Asia-Pacific, Europe
  • Top Key Players in AI Tutoring Services Market: Duolingo, Khan Academy (Khanmigo), Quizlet (Q-Chat), McGraw Hill ALEKS, Carnegie Learning (MATHia), Riiid, Squirrel AI Learning, Brainly, ELSA Speak, Photomath

Ai Tutoring Services Market

AI Tutoring Services Market Key Takeaways

Metric Value
Market Estimated Value in (2025E) USD 3,716.6 million
Market Forecast Value in (2035F) USD 21,625.2 million
Forecast CAGR (2025 to 2035) 19.3%

During the first five-year period from 2025 to 2030, the market increases from USD 3,716.6 million to USD 8,965.1 million, adding USD 5,248.5 million, which accounts for 29.3% of the total decade growth. This phase records steady adoption in K-12 learning, language learning, and STEM education, driven by the need for scalable, personalized, and cost-effective tutoring. Pure AI tutors dominate this period with over 59% share, supported by high demand for standalone app/web platforms that cater to over 65% of users.

The second half from 2030 to 2035 contributes USD 12,660.1 million, equal to 70.7% of total growth, as the market jumps from USD 8,965.1 million to USD 21,625.2 million. This acceleration is powered by widespread deployment of AI-driven co-pilot tutoring systems, LMS-integrated AI assistants, and multimodal learning solutions. Emerging markets, particularly India and China, drive this surge with CAGRs of 19.2% and 17.1% respectively. Hybrid human-AI tutoring gains traction, and subscription-based models coupled with AI analytics platforms increase recurring revenue, lifting the share of integrated solutions well above earlier levels by the end of the decade.

From 2020 to 2024, the AI Tutoring Services Market grew steadily, driven by early adoption in language learning apps, STEM-focused tutoring platforms, and test preparation tools. During this period, the competitive landscape was dominated by well-funded EdTech platforms, with leaders such as Duolingo, Khan Academy, and Quizlet leveraging AI for personalized learning paths. Competitive differentiation relied on adaptive learning algorithms, gamification, and multilingual capabilities, while human tutoring remained a secondary, premium add-on for advanced learners. Service-based hybrid tutoring models had minimal penetration, contributing less than 15% of the total market value.

Demand for AI tutoring is projected to reach USD 3,716.6 million in 2025, with the revenue mix shifting toward more integrated and hybrid solutions. Traditional app-based leaders face rising competition from AI-first platforms offering multimodal tutoring (text, voice, and code interpretation), cloud-based learning analytics, and subscription-driven personalized curriculums. Major incumbents are pivoting to hybrid human-AI teaching models, integrating AI co-pilots and school LMS compatibility to maintain relevance. Emerging entrants specializing in STEM-specific AI tutors, K-12 curriculum alignment, and industry-specific upskilling platforms are gaining share. The competitive advantage is moving away from content libraries alone toward ecosystem strength, cross-platform scalability, and recurring subscription revenues.

Why the AI Tutoring Services Market is growing?

Unlike traditional tutoring, AI tutoring platforms can deliver highly customized learning experiences to millions of students simultaneously. Advanced algorithms adapt content difficulty, pace, and format based on individual learner performance, ensuring engagement and better outcomes. This scalability makes it attractive for both cost-sensitive K-12 education systems and rapidly growing adult upskilling markets.

AI tutoring is increasingly embedded into tools students already use from mobile apps and messaging platforms to school LMS systems and productivity software. This seamless integration reduces adoption barriers and makes AI learning support available on-demand, whether during homework help, exam prep, or skill training, driving sustained usage and market expansion.

Segmental Analysis

The AI Tutoring Services Market is segmented by learning stage, subject use case, interaction mode, service type, delivery method, and pricing model, each contributing to the market’s growth dynamics. By learning stage, K-12 dominates adoption due to curriculum integration and parental demand for personalization, followed by higher education for supplementary learning, adult and professional learning for upskilling, and test preparation for competitive exam success.

By subject, Math & STEM lead thanks to measurable outcomes, while language learning, coding, humanities, and homework help also see strong uptake. In terms of interaction, text chat remains the most accessible, voice is rising in language-focused platforms, multimodal formats enhance comprehension through images and code, and live co-tutoring blends human expertise with AI support. By service type, pure AI tutors offer scalable automation, hybrid human-AI models address complex needs, and AI teacher assistants aid educators with grading and resource recommendations.

Delivery is dominated by standalone app/web platforms, with growing LMS integration in institutions and API/SDK embedding for developers. Pricing models range from freemium for mass reach, subscriptions for continuous learning, and usage-based models for short-term needs, to institutional licenses for bulk deployment across schools and universities. Regionally, the scope spans North America, Latin America, Western and Eastern Europe, Balkan and Baltic countries, Russia and Belarus, Central Asia, East Asia, South Asia and Pacific, and the Middle East and Africa.
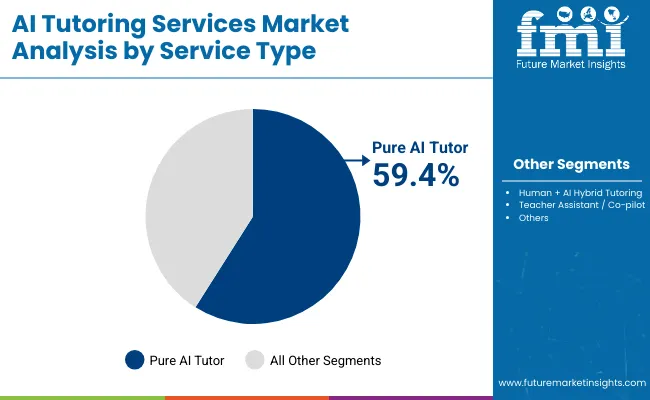
Insights into the Service Type Segment with Pure AI tutor Leading in Market Share

Ai Tutoring Services Market By Service

Service Type Value Share% 2025
Pure AI tutor 59.4%
Others 40.6%

The Pure AI Tutor segment is projected to contribute 59.4% of the AI Tutoring Services Market revenue in 2025, maintaining its lead as the dominant service type category. This leadership is driven by the scalability of AI-driven learning platforms, which can deliver personalized, adaptive education to millions of learners simultaneously without the need for proportional increases in human resources. Pure AI tutors are particularly popular in K-12 and language learning segments, where automation and low delivery costs are key adoption drivers.

The segment’s growth is further supported by continuous advancements in natural language processing, multimodal learning capabilities, and real-time feedback mechanisms. As integration with mobile apps, cloud-based analytics, and learning management systems becomes more widespread, Pure AI Tutors are evolving into comprehensive learning companions rather than standalone Q&A tools. This ability to combine cost efficiency with high personalization is expected to ensure the segment retains its dominant position in the AI Tutoring Services market throughout the forecast period.
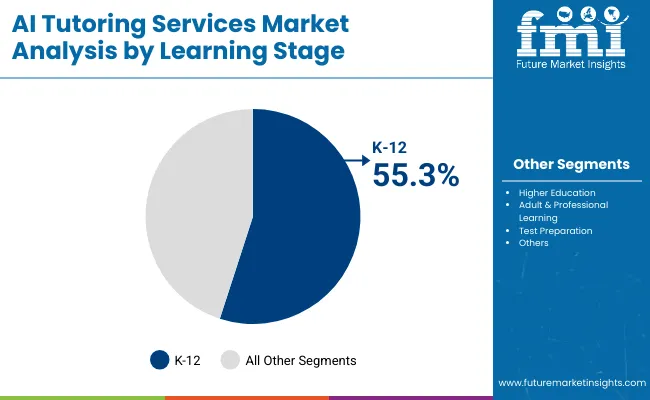
Insights into the Learning Stage Segment with K-12 Dominating the Demand

Ai Tutoring Services Market By Learning

Learning Stage Value Share% 2025
K-12 55.3%
Others 44.7%

The K-12 segment is forecasted to hold 55.3% of the AI Tutoring Services Market share in 2025, driven by the rapid adoption of digital learning tools in primary and secondary education. Schools and districts are increasingly integrating AI tutors to provide personalized learning experiences, adaptive assessments, and real-time progress tracking, addressing diverse student needs and bridging learning gaps.

This segment benefits from strong government initiatives, education technology funding, and the rising acceptance of AI-driven supplementary education among parents and educators. The flexibility of AI tutors to offer subject-specific guidance, homework help, and test preparation further boosts their adoption in K-12 settings. As hybrid and remote learning environments become a lasting part of the education system, the K-12 segment is expected to sustain its dominant position in the market.
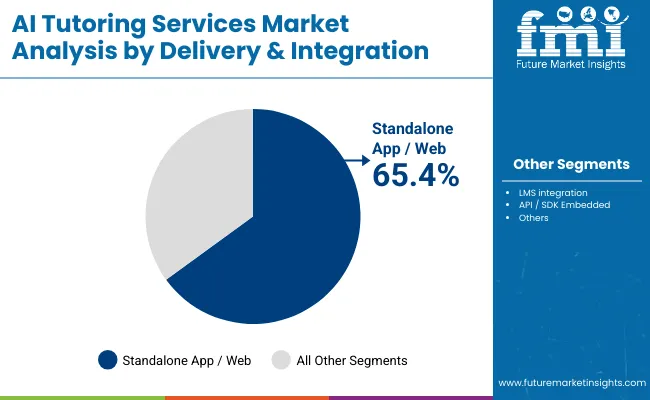
Insights into the Delivery & Integration Segment with Focus on Standalone app / web

Ai Tutoring Services Market By Delivery

Delivery & Integration Value Share% 2025
Standalone app / web 65.4%
Others 34.6%

The standalone app/web segment is projected to account for 65.4% of the AI Tutoring Services Market revenue in 2025, establishing itself as the most popular delivery method. This format is favored for its ease of access, device compatibility, and minimal setup requirements, enabling learners to engage with AI tutors across desktops, tablets, and smartphones without additional integrations.

Its dominance is further supported by the rise of direct-to-consumer AI tutoring platforms that provide seamless onboarding, personalized dashboards, and instant content updates. The ability to push feature enhancements and integrate AI-driven analytics without dependency on third-party systems ensures a faster innovation cycle. As mobile-first and web-based education consumption continues to rise, standalone app/web platforms are expected to maintain their leadership, appealing to both individual learners and institutional customers.

What are the Drivers, Restraints, and Key Trends of the AI Tutoring Services Market?

Scalable Personalization in Learning

One of the most significant growth drivers for the AI Tutoring Services Market is the ability to deliver scalable personalized learning experiences. Traditional tutoring requires a one-to-one or small group setting, which is resource-intensive and often costly. AI-powered tutoring platforms can simulate that personalization at scale by dynamically adjusting lesson content, difficulty levels, and pacing based on each learner’s progress and preferences. Advanced natural language processing, adaptive testing, and performance analytics allow these systems to identify knowledge gaps and deliver targeted interventions in real time.

This not only improves learning outcomes but also ensures continuous engagement by catering to different learning styles. Institutions, parents, and individual learners find value in the consistent quality of AI tutors, especially for subjects like math, science, and language learning. The scalability of this approach makes it ideal for large educational systems and emerging markets, where demand far exceeds the supply of qualified human tutors.

Rising Adoption in K-12 and Test Preparation

The K-12 and test preparation segments are at the forefront of AI tutoring adoption. Schools are integrating AI tutors into classroom and homework settings to provide personalized support, while after-school programs are using them to supplement traditional tutoring. AI tutors help students improve performance through instant feedback, gamified learning modules, and adaptive exercises tailored to standardized tests and competitive exam requirements.

Parents, increasingly concerned about their children’s academic competitiveness, are investing in AI tutoring subscriptions that offer measurable improvement in grades and test scores. In test prep, AI tutors can simulate exam environments, track progress, and adjust study plans automatically, reducing student stress and maximizing efficiency. This growth is also reinforced by government-backed digital learning initiatives, particularly in countries with large student populations like India and China. The ability to serve millions of learners simultaneously, while keeping costs lower than in-person tutoring, makes this segment a key revenue driver.

Data Privacy and Security Concerns

Data privacy remains a significant challenge for the AI Tutoring Services Market. AI tutoring systems rely heavily on collecting and analyzing large volumes of personal and performance data to customize learning experiences. This includes sensitive information such as student names, ages, academic records, behavioral patterns, and in some cases, biometric data for voice or facial recognition. In regions with strict data protection regulations, such as the EU’s GDPR or California’s CCPA, ensuring compliance can be complex and costly.

Parents and institutions are often wary of sharing student data with third-party platforms, particularly when those platforms operate internationally and store data in multiple jurisdictions. Security breaches could compromise sensitive information, leading to reputational damage and potential legal consequences for providers. As awareness of digital privacy increases, companies must invest heavily in encryption, secure cloud storage, and transparent data handling policies. Failure to address these concerns could slow adoption, especially in regulated education markets.

Growth of Hybrid Human-AI Tutoring Models

While pure AI tutors dominate in scalability and cost efficiency, there is a growing trend toward hybrid human-AI tutoring models. In this approach, AI handles routine tasks such as grading, delivering personalized lesson recommendations, and tracking progress, while human tutors provide contextual guidance, emotional support, and complex problem-solving. This combination leverages the strengths of bothAI ensures efficiency and consistency, while human educators add empathy and adaptability.

Hybrid models are especially popular in higher education, professional learning, and advanced test preparation, where nuanced explanations and real-world application examples are crucial. Schools and private tutoring companies are increasingly adopting this approach to maximize engagement and improve outcomes. Furthermore, this model addresses one of the key criticisms of AI tutorsthat they lack the human touchmaking it appealing to parents and learners who want a balance between technology and personal mentorship. As AI capabilities advance, these hybrid solutions are expected to become more seamless and widespread.
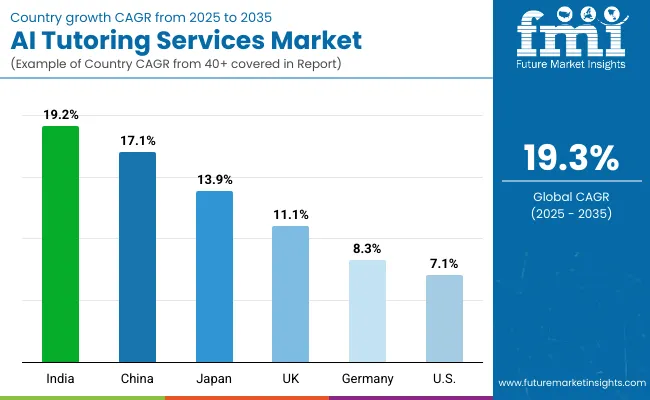
Analysis of AI Tutoring Services Market By Key Countries

Ai Tutoring Services Market By Country

Countries Estimated CAGR (2025 to 2035)
China 17.1%
USA 7.1%
India 19.2%
UK 11.1%
Germany 8.3%
Japan 13.9%

The global AI Tutoring Services Market displays strong regional variation, shaped by education digitization policies, broadband penetration, and cultural receptiveness to AI-assisted learning.

Asia-Pacific leads the growth trajectory, with India at 19.2% CAGR and China at 17.1%, driven by large student populations, national digital learning initiatives, and rising middle-class demand for affordable, scalable education solutions. China benefits from heavy investment in AI edtech startups and integration into government-backed smart classroom programs. India’s rapid expansion is fueled by competitive exam preparation demand, mobile-first learning platforms, and the growing acceptance of AI tutors in K-12 and higher education.

Japan follows closely with 13.9% CAGR, supported by its emphasis on lifelong learning and technology-driven workforce reskilling. In Europe, the UK (11.1%) and Germany (8.3%) maintain strong growth on the back of hybrid tutoring adoption and institutional licensing in universities. North America shows steadier expansion, with the USA at 7.1%, reflecting a mature edtech ecosystem where growth is more service-oriented, focusing on AI-teacher assistant tools and integration into existing learning management systems rather than pure tutoring apps.
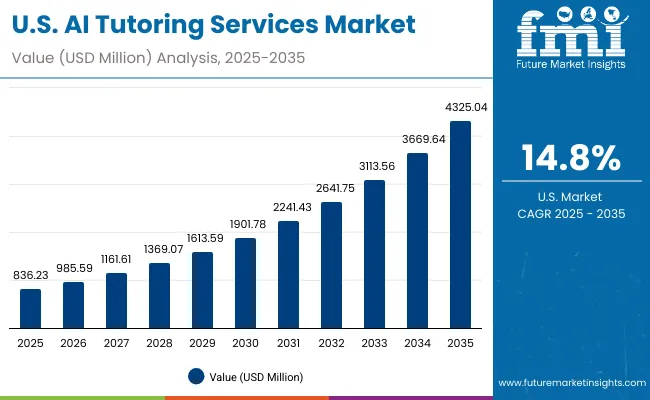
Sales Outlook for AI Tutoring Services in the United States

Ai Tutoring Services Market Usa

Year USA AITutoring Services Market (USD Million)
2025 836.23
2026 985.59
2027 1161.61
2028 1369.07
2029 1613.59
2030 1901.78
2031 2241.43
2032 2641.75
2033 3113.56
2034 3669.64
2035 4325.04

The AI Tutoring Services Market in the United States is forecast to grow at a CAGR of 14.8% from 2025 to 2035, driven by rising adoption across K-12 schools, higher education institutions, and corporate training programs. Increased funding for digital learning infrastructure and government-backed AI education initiatives are accelerating deployment. The integration of AI tutors as teacher assistants in blended classrooms is also expanding, improving student engagement and reducing educator workload. The USA market benefits from high broadband penetration, strong edtech startup ecosystems, and strategic collaborations between AI developers and educational publishers.

  • K-12 school districts are investing in AI tutors for personalized learning at scale.
  • Universities are integrating AI-powered study assistants into LMS platforms.
  • Corporate learning departments are leveraging AI tutors for workforce reskilling.

Growth and Expansion Outlook for AI Tutoring Services Market in the United Kingdom

The AI Tutoring Services Market in the United Kingdom is projected to grow at a CAGR of 11.1% between 2025 and 2035, driven by strong adoption in K-12 schools, higher education, and professional upskilling programs. Government-backed digital education strategies, such as the UK’s EdTech Demonstrator Programme, are fostering early adoption of AI-powered personalized learning tools. Universities are integrating AI tutors into virtual learning environments to enhance accessibility for remote learners. In the corporate sector, AI tutors are gaining traction for continuous workforce training, particularly in finance, healthcare, and technology fields. Collaborations between AI edtech startups and educational publishers are further enriching content quality and delivery.

  • K-12 institutions are using AI tutors to support differentiated learning pathways.
  • Universities are deploying AI assistants to improve student retention and engagement.
  • Corporations are leveraging AI tutoring for targeted skill development and compliance training.

Growth and Expansion Outlook for AI Tutoring Services Market in India

India is witnessing rapid growth in the AI Tutoring Services Market, forecast to expand at a CAGR of 19.2% through 2035. The expansion is fueled by rising digital adoption in tier-2 and tier-3 cities, affordable subscription models, and government-led initiatives like PM eVidya to promote online learning. EdTech startups are increasingly offering AI-powered tutors in regional languages, bridging accessibility gaps for rural learners. Schools and coaching centers are integrating AI tutoring into hybrid learning models to improve test preparation and skill development. Corporate L&D teams are also leveraging AI tutors for continuous workforce training, particularly in IT and BFSI sectors.

  • Regional language AI tutors are expanding access to underserved markets.
  • K-12 and coaching centers are adopting AI for adaptive learning and exam prep.
  • Corporate training programs are integrating AI tutors for targeted upskilling.

Sales Outlook for AI Tutoring Services in China

The AI Tutoring Services Market in China is expected to grow at a CAGR of 17.1%, the highest among leading economies. Growth is propelled by nationwide digital education reforms, rapid EdTech adoption, and strong competition among domestic AI innovators. Public school systems in major provinces are integrating AI tutors to support personalized learning paths and reduce teacher workload. The government’s “Smart Education” initiative is expanding AI-assisted classrooms, while private tutoring platforms are embedding AI into K-12, university prep, and vocational training services. Affordable solutions from local tech companies are boosting penetration into rural and underserved areas, making AI tutoring a mainstream supplement to traditional teaching.
  • National “Smart Education” policies are accelerating AI tutor integration in schools.
  • Private tutoring platforms are embedding AI into diverse subject offerings.
  • Local tech firms are enabling mass adoption with affordable AI-powered solutions.

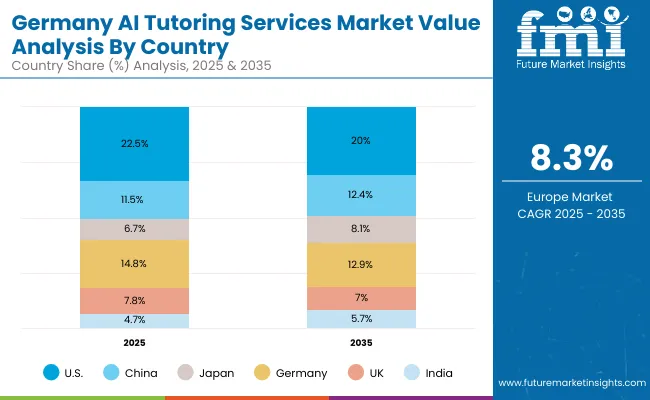
In-depth Analysis of AI Tutoring Services in Germany

Ai Tutoring Services Market Germany

Countries 2025 Share (%)
USA 22.5%
China 11.5%
Japan 6.7%
Germany 14.8%
UK 7.8%
India 4.7%
Countries 2035 Share (%)
USA 20.0%
China 12.4%
Japan 8.1%
Germany 12.9%
UK 7.0%
India 5.7%

The AI Tutoring Services Market in Germany is projected to grow at a CAGR of 8.3%, driven by the country’s strong emphasis on education quality, digital transformation in schools, and compliance with EU education technology standards. Public and private institutions are adopting AI tutoring platforms to support differentiated instruction, cater to multilingual classrooms, and address teacher shortages. Universities and vocational schools are integrating AI tutors into STEM and technical training programs to enhance practical skill development. Corporate training providers are leveraging AI tutoring for upskilling employees in emerging technologies. Germany’s focus on data privacy and GDPR compliance is shaping platform design, ensuring secure and ethical AI usage.

  • AI tutors are supporting multilingual and inclusive classrooms in primary and secondary education.
  • Universities are embedding AI tutoring in STEM-focused digital learning programs.
  • Corporate training centers are using AI tutors for workforce reskilling and compliance training.

Growth Outlook for AI Tutoring Services Market in USA

Ai Tutoring Services Market Usa (2)

USA By Service Type Value Share% 2025
Pure AI tutor 57.7%
Others 42.3%

The AI Tutoring Services Market in the United States is expected to witness steady growth, with pure AI tutors accounting for 57.7% of market value in 2025, reflecting the nation’s early adoption of advanced edtech solutions. The strong preference for AI-driven platforms stems from their ability to deliver personalized learning paths, real-time feedback, and adaptive assessments that align with Common Core and state-specific academic standards.

The USA edtech ecosystem is benefiting from significant venture capital funding and partnerships between technology providers, K-12 districts, and higher education institutions. Growth is also supported by the integration of AI tutors into corporate e-learning modules, particularly in technology, healthcare, and finance sectors. AI tutor adoption is accelerating in test preparation and professional certification programs, where tailored practice modules and performance analytics provide measurable outcomes.
  • Pure AI tutors lead with 57.7% market share in 2025.
  • High adoption in K-12, higher education, and corporate learning ecosystems.
  • Growth supported by VC funding and public-private partnerships.

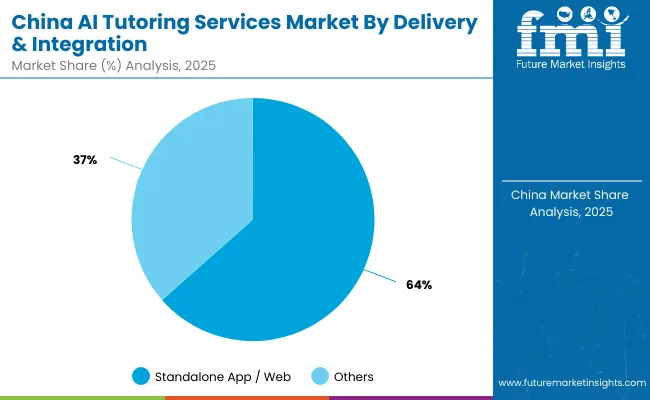
Opportunity Analysis of China AI Tutoring Services Market

Ai Tutoring Services Market China

China By Delivery & Integration Value Share% 2025
Standalone app / web 63.5%
Others 36.5%

The AI Tutoring Services Market in China is expected to see robust expansion, with standalone app/web platforms commanding 63.5% of market value in 2025. This dominance stems from China’s highly mobile-first digital ecosystem, where super apps, online education portals, and integrated payment systems drive rapid adoption. Standalone AI tutoring platforms cater to the nation’s competitive academic culture, offering adaptive learning modules for K-12 students, university entrance preparation, and professional upskilling.

Government policy promoting digital education, coupled with nationwide 5G rollout, has further enabled seamless delivery of AI-powered learning experiences even in rural areas. Local edtech companies are leveraging proprietary AI algorithms, gamified content, and live tutoring integration to boost engagement and retention. The other segmentcomprising embedded AI tutors in learning management systems and hybrid classroom setupsis growing steadily as schools adopt blended learning models.
  • Standalone platforms lead with 63.5% market share in 2025.
  • Growth fueled by mobile-first learning culture and nationwide 5G access.
  • Local edtech innovation and gamification enhance user engagement.

Competitive Landscape of AI Tutoring Services Market

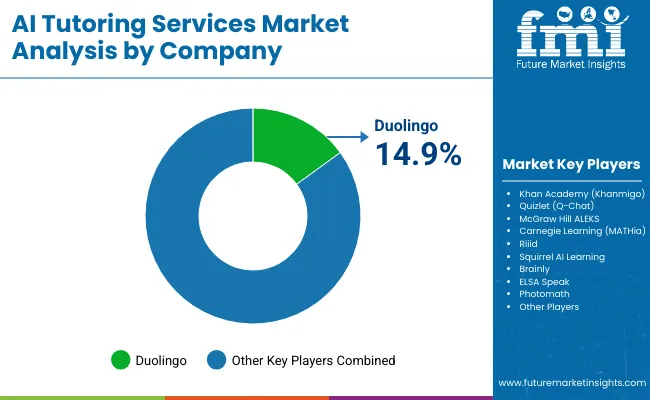
Ai Tutoring Services Market By Company

The AI Tutoring Services Market is moderately fragmented, featuring global edtech giants, emerging AI-driven innovators, and niche content specialists. Leading players like Duolingo, BYJU’S, and Khan Academy hold notable market positions by combining adaptive AI algorithms with large-scale content libraries, multilingual support, and gamified learning experiences. Their strategies increasingly focus on integrating generative AI for real-time feedback, personalized learning pathways, and immersive AR/VR-based modules for enhanced engagement.

Mid-sized innovators such as Squirrel AI, Quizlet, and Lingvist target specific learning outcomesranging from K-12 academic tutoring to professional skill developmentoffering affordable subscription models and mobile-first experiences. These platforms are expanding rapidly in emerging markets through localized content and partnerships with educational institutions.

Specialist providers, including Knowre and Elsa Speak, carve out niches in areas like AI-powered mathematics tutoring and spoken language improvement. Their competitive advantage lies in hyper-focused feature sets and high adaptability to local curricula.

Competitive differentiation in this space is moving beyond core content delivery toward AI ecosystem integration, combining predictive learning analytics, gamified retention strategies, and subscription-based hybrid learning models.

Key Developments in AI Tutoring Services Market

  • In August 2025, Duolingo raised its annual forecast, triggering a nearly 30% surge in its stock pricea clear signal of strong investor confidence in its AI-driven approach. The company’s success is largely attributed to increased adoption of its premium subscription tier, Duolingo Max, which features GPT-4-powered capabilities like AI-driven video calls and personalized lessons. Higher engagement and improved monetization strategies led to a 6% rise in average revenue per user during Q2, effectively offsetting expected drops in gross margins.
  • In August 2025, Google rolled out "Guided Learning" within its Gemini AI chatbotan intelligent tutoring feature designed to help students grasp concepts deeply instead of just providing answers. This free educational tool offers interactive learning experiences across devices, positioning Google as a serious contender in the AI tutoring arena and expanding access to AI-based education.

Scope of the Report

Item Value
Quantitative Units USD 3,716.6 Million
Learning Stage K-12, Higher Education, Adult & Professional Learning, Test Preparation
Subject / Use Case Math & STEM, Language Learning, Coding & Computer Science, Humanities & Social Sciences, Homework Help & Study Skills
Interaction Mode Text chat, Voice, Multimodal (text + images/code), Live co-tutoring
Service Type Pure AI tutor, Human + AI hybrid tutoring, Teacher assistant / co-pilot
Delivery & Integration Standalone app / web, LMS integration, API / SDK embedded
Pricing Model Freemium, Subscription, Usage-based / pay per session, Institutional license
Regions Covered North America, Europe, Asia-Pacific, Latin America, Middle East & Africa
Country Covered United States, Canada, Germany, France, United Kingdom, China, Japan, India, Brazil, South Africa
Key Companies Profiled Khan Academy (Khanmigo), Duolingo, Quizlet (Q-Chat), McGraw Hill ALEKS, Carnegie Learning (MATHia), Riiid, Squirrel AI Learning, Brainly, ELSA Speak, Photomath
Additional Attributes Dollar sales by service type and learning stage, adoption trends in hybrid human-AI tutoring and personalized learning platforms, rising demand for multimodal interaction (text, voice, images, code), sector-specific growth in K-12, higher education, and professional learning, software vs. platform revenue segmentation, integration with AR/VR classrooms and gamified learning systems, regional trends influenced by government digital education initiatives, and innovations in adaptive learning algorithms, natural language processing, and emotion recognition for personalized feedback.

Key Segments

By Learning Stage:

  • K-12
  • Higher Education
  • Adult & Professional Learning
  • Test Preparation

By Subject / Use Case:

  • Math & STEM
  • Language Learning
  • Coding & Computer Science
  • Humanities & Social Sciences
  • Homework Help & Study Skills

By Interaction Mode:

  • Text chat
  • Voice
  • Multimodal (text + images/code)
  • Live co-tutoring

By Service Type:

  • Pure AI tutor
  • Human + AI hybrid tutoring
  • Teacher assistant / co-pilot

By Delivery & Integration:

  • Standalone app / web
  • LMS integration
  • API / SDK embedded

By Pricing Model:

  • Freemium
  • Subscription
  • Usage-based / pay per session
  • Institutional license

By Region:

  • North America
  • Latin America
  • Europe
  • East Asia
  • South Asia & Pacific
  • Middle East and Africa

Table of Content

  1. Executive Summary
    • Global Market Outlook
    • Demand-side Trends
    • Supply-side Trends
    • Technology Roadmap Analysis
    • Analysis and Recommendations
  2. Market Overview
    • Market Coverage / Taxonomy
    • Market Definition / Scope / Limitations
  3. Market Background
    • Market Dynamics
      • Drivers
      • Restraints
      • Opportunity
      • Trends
    • Scenario Forecast
      • Demand in Optimistic Scenario
      • Demand in Likely Scenario
      • Demand in Conservative Scenario
    • Opportunity Map Analysis
    • Product Life Cycle Analysis
    • Supply Chain Analysis
      • Supply Side Participants and their Roles
        • Producers
        • Mid-Level Participants (Traders/ Agents/ Brokers)
        • Wholesalers and Distributors
      • Value Added and Value Created at Node in the Supply Chain
      • List of Raw Material Suppliers
      • List of Existing and Potential Buyer’s
    • Investment Feasibility Matrix
    • Value Chain Analysis
      • Profit Margin Analysis
      • Wholesalers and Distributors
      • Retailers
    • PESTLE and Porter’s Analysis
    • Regulatory Landscape
      • By Key Regions
      • By Key Countries
    • Regional Parent Market Outlook
    • Production and Consumption Statistics
    • Import and Export Statistics
  4. Global Analysis 2020 to 2024 and Forecast, 2025 to 2035
    • Historical Market Size Value (USD Million) & Volume (Units) Analysis, 2020 to 2024
    • Current and Future Market Size Value (USD Million) & Volume (Units) Projections, 2025 to 2035
      • Y-o-Y Growth Trend Analysis
      • Absolute $ Opportunity Analysis
  5. Global Analysis 2020 to 2024 and Forecast 2025 to 2035, By Learning Stage
    • Introduction / Key Findings
    • Historical Market Size Value (USD Million) & Volume (Units) Analysis By Learning Stage, 2020 to 2024
    • Current and Future Market Size Value (USD Million) & Volume (Units) Analysis and Forecast By Learning Stage, 2025 to 2035
      • K-12
      • Higher Education
      • Adult & Professional Learning
      • Test Preparation
    • Y-o-Y Growth Trend Analysis By Learning Stage, 2020 to 2024
    • Absolute $ Opportunity Analysis By Learning Stage, 2025 to 2035
  6. Global Analysis 2020 to 2024 and Forecast 2025 to 2035, By Subject / Use Case
    • Introduction / Key Findings
    • Historical Market Size Value (USD Million) & Volume (Units) Analysis By Subject / Use Case, 2020 to 2024
    • Current and Future Market Size Value (USD Million) & Volume (Units) Analysis and Forecast By Subject / Use Case, 2025 to 2035
      • Math & STEM
      • Language Learning
      • Coding & Computer Science
      • Humanities & Social Sciences
      • Homework Help & Study Skills
    • Y-o-Y Growth Trend Analysis By Subject / Use Case, 2020 to 2024
    • Absolute $ Opportunity Analysis By Subject / Use Case, 2025 to 2035
  7. Global Analysis 2020 to 2024 and Forecast 2025 to 2035, By Interaction Mode
    • Introduction / Key Findings
    • Historical Market Size Value (USD Million) & Volume (Units) Analysis By Interaction Mode, 2020 to 2024
    • Current and Future Market Size Value (USD Million) & Volume (Units) Analysis and Forecast By Interaction Mode, 2025 to 2035
      • Text chat
      • Voice
      • Multimodal (text + images/code)
      • Live co-tutoring
    • Y-o-Y Growth Trend Analysis By Interaction Mode, 2020 to 2024
    • Absolute $ Opportunity Analysis By Interaction Mode, 2025 to 2035
  8. Global Analysis 2020 to 2024 and Forecast 2025 to 2035, By Service Type
    • Introduction / Key Findings
    • Historical Market Size Value (USD Million) & Volume (Units) Analysis By Service Type, 2020 to 2024
    • Current and Future Market Size Value (USD Million) & Volume (Units) Analysis and Forecast By Service Type, 2025 to 2035
      • Pure AI tutor
      • Human + AI hybrid tutoring
      • Teacher assistant / co-pilot
    • Y-o-Y Growth Trend Analysis By Service Type, 2020 to 2024
    • Absolute $ Opportunity Analysis By Service Type, 2025 to 2035
  9. Global Analysis 2020 to 2024 and Forecast 2025 to 2035, By Delivery & Integration
    • Introduction / Key Findings
    • Historical Market Size Value (USD Million) & Volume (Units) Analysis By Delivery & Integration, 2020 to 2024
    • Current and Future Market Size Value (USD Million) & Volume (Units) Analysis and Forecast By Delivery & Integration, 2025 to 2035
      • Standalone app / web
      • LMS integration
      • API / SDK embedded
    • Y-o-Y Growth Trend Analysis By Delivery & Integration, 2020 to 2024
    • Absolute $ Opportunity Analysis By Delivery & Integration, 2025 to 2035
  10. Global Analysis 2020 to 2024 and Forecast 2025 to 2035, By Pricing Model
    • Introduction / Key Findings
    • Historical Market Size Value (USD Million) & Volume (Units) Analysis By Pricing Model, 2020 to 2024
    • Current and Future Market Size Value (USD Million) & Volume (Units) Analysis and Forecast By Pricing Model, 2025 to 2035
      • Freemium
      • Subscription
      • Usage-based / pay per session
      • Institutional license
    • Y-o-Y Growth Trend Analysis By Pricing Model, 2020 to 2024
    • Absolute $ Opportunity Analysis By Pricing Model, 2025 to 2035
  11. Global Analysis 2020 to 2024 and Forecast 2025 to 2035, By Region
    • Introduction
    • Historical Market Size Value (USD Million) & Volume (Units) Analysis By Region, 2020 to 2024
    • Current Market Size Value (USD Million) & Volume (Units) Analysis and Forecast By Region, 2025 to 2035
      • North America
      • Latin America
      • Europe
      • East Asia
      • South Asia & Pacific
      • Middle East and Africa
    • Market Attractiveness Analysis By Region
  12. North America Analysis 2020 to 2024 and Forecast 2025 to 2035, By Country
    • Historical Market Size Value (USD Million) & Volume (Units) Trend Analysis By Market Taxonomy, 2020 to 2024
    • Market Size Value (USD Million) & Volume (Units) Forecast By Market Taxonomy, 2025 to 2035
      • By Country
        • USA
        • Canada
      • By Learning Stage
      • By Subject / Use Case
      • By Interaction Mode
      • By Service Type
      • By Delivery & Integration
      • By Pricing Model
    • Market Attractiveness Analysis
      • By Country
      • By Learning Stage
      • By Subject / Use Case
      • By Interaction Mode
      • By Service Type
      • By Delivery & Integration
      • By Pricing Model
    • Key Takeaways
  13. Latin America Analysis 2020 to 2024 and Forecast 2025 to 2035, By Country
    • Historical Market Size Value (USD Million) & Volume (Units) Trend Analysis By Market Taxonomy, 2020 to 2024
    • Market Size Value (USD Million) & Volume (Units) Forecast By Market Taxonomy, 2025 to 2035
      • By Country
        • Brazil
        • Mexico
        • Colombia
        • Rest of Latin America
      • By Learning Stage
      • By Subject / Use Case
      • By Interaction Mode
      • By Service Type
      • By Delivery & Integration
      • By Pricing Model
    • Market Attractiveness Analysis
      • By Country
      • By Learning Stage
      • By Subject / Use Case
      • By Interaction Mode
      • By Service Type
      • By Delivery & Integration
      • By Pricing Model
    • Key Takeaways
  14. Europe Analysis 2020 to 2024 and Forecast 2025 to 2035, By Country
    • Historical Market Size Value (USD Million) & Volume (Units) Trend Analysis By Market Taxonomy, 2020 to 2024
    • Market Size Value (USD Million) & Volume (Units) Forecast By Market Taxonomy, 2025 to 2035
      • By Country
        • Germany
        • UK
        • France
        • Italy
        • Spain
        • Belgium
        • Netherlands
        • Nordic
        • Switzerland
        • Russia
        • Poland
        • Rest of Europe
      • By Learning Stage
      • By Subject / Use Case
      • By Interaction Mode
      • By Service Type
      • By Delivery & Integration
      • By Pricing Model
    • Market Attractiveness Analysis
      • By Country
      • By Learning Stage
      • By Subject / Use Case
      • By Interaction Mode
      • By Service Type
      • By Delivery & Integration
      • By Pricing Model
    • Key Takeaways
  15. East Asia Analysis 2020 to 2024 and Forecast 2025 to 2035, By Country
    • Historical Market Size Value (USD Million) & Volume (Units) Trend Analysis By Market Taxonomy, 2020 to 2024
    • Market Size Value (USD Million) & Volume (Units) Forecast By Market Taxonomy, 2025 to 2035
      • By Country
        • China
        • Japan
        • South Korea
      • By Learning Stage
      • By Subject / Use Case
      • By Interaction Mode
      • By Service Type
      • By Delivery & Integration
      • By Pricing Model
    • Market Attractiveness Analysis
      • By Country
      • By Learning Stage
      • By Subject / Use Case
      • By Interaction Mode
      • By Service Type
      • By Delivery & Integration
      • By Pricing Model
    • Key Takeaways
  16. South Asia & Pacific Analysis 2020 to 2024 and Forecast 2025 to 2035, By Country
    • Historical Market Size Value (USD Million) & Volume (Units) Trend Analysis By Market Taxonomy, 2020 to 2024
    • Market Size Value (USD Million) & Volume (Units) Forecast By Market Taxonomy, 2025 to 2035
      • By Country
        • India
        • Thailand
        • Malaysia
        • Indonesia
        • Singapore
        • Vietnam
        • Australia
        • New Zealand
        • Rest of South Asia
      • By Learning Stage
      • By Subject / Use Case
      • By Interaction Mode
      • By Service Type
      • By Delivery & Integration
      • By Pricing Model
    • Market Attractiveness Analysis
      • By Country
      • By Learning Stage
      • By Subject / Use Case
      • By Interaction Mode
      • By Service Type
      • By Delivery & Integration
      • By Pricing Model
    • Key Takeaways
  17. Middle East and Africa Analysis 2020 to 2024 and Forecast 2025 to 2035, By Country
    • Historical Market Size Value (USD Million) & Volume (Units) Trend Analysis By Market Taxonomy, 2020 to 2024
    • Market Size Value (USD Million) & Volume (Units) Forecast By Market Taxonomy, 2025 to 2035
      • By Country
        • Turkey
        • UAE
        • Saudi Arabia
        • Israel
        • Other GCC Countries
        • North Africa
        • South Africa
      • By Learning Stage
      • By Subject / Use Case
      • By Interaction Mode
      • By Service Type
      • By Delivery & Integration
      • By Pricing Model
    • Market Attractiveness Analysis
      • By Country
      • By Learning Stage
      • By Subject / Use Case
      • By Interaction Mode
      • By Service Type
      • By Delivery & Integration
      • By Pricing Model
    • Key Takeaways
  18. Key Countries Analysis
    • USA
      • Pricing Analysis
      • Market Share Analysis, 2024
        • By Learning Stage
        • By Subject / Use Case
        • By Interaction Mode
        • By Service Type
        • By Delivery & Integration
        • By Pricing Model
    • Canada
      • Pricing Analysis
      • Market Share Analysis, 2024
        • By Learning Stage
        • By Subject / Use Case
        • By Interaction Mode
        • By Service Type
        • By Delivery & Integration
        • By Pricing Model
    • Brazil
      • Pricing Analysis
      • Market Share Analysis, 2024
        • By Learning Stage
        • By Subject / Use Case
        • By Interaction Mode
        • By Service Type
        • By Delivery & Integration
        • By Pricing Model
    • Mexico
      • Pricing Analysis
      • Market Share Analysis, 2024
        • By Learning Stage
        • By Subject / Use Case
        • By Interaction Mode
        • By Service Type
        • By Delivery & Integration
        • By Pricing Model
    • Colombia
      • Pricing Analysis
      • Market Share Analysis, 2024
        • By Learning Stage
        • By Subject / Use Case
        • By Interaction Mode
        • By Service Type
        • By Delivery & Integration
        • By Pricing Model
    • Germany
      • Pricing Analysis
      • Market Share Analysis, 2024
        • By Learning Stage
        • By Subject / Use Case
        • By Interaction Mode
        • By Service Type
        • By Delivery & Integration
        • By Pricing Model
    • UK
      • Pricing Analysis
      • Market Share Analysis, 2024
        • By Learning Stage
        • By Subject / Use Case
        • By Interaction Mode
        • By Service Type
        • By Delivery & Integration
        • By Pricing Model
    • France
      • Pricing Analysis
      • Market Share Analysis, 2024
        • By Learning Stage
        • By Subject / Use Case
        • By Interaction Mode
        • By Service Type
        • By Delivery & Integration
        • By Pricing Model
    • Italy
      • Pricing Analysis
      • Market Share Analysis, 2024
        • By Learning Stage
        • By Subject / Use Case
        • By Interaction Mode
        • By Service Type
        • By Delivery & Integration
        • By Pricing Model
    • Spain
      • Pricing Analysis
      • Market Share Analysis, 2024
        • By Learning Stage
        • By Subject / Use Case
        • By Interaction Mode
        • By Service Type
        • By Delivery & Integration
        • By Pricing Model
    • Belgium
      • Pricing Analysis
      • Market Share Analysis, 2024
        • By Learning Stage
        • By Subject / Use Case
        • By Interaction Mode
        • By Service Type
        • By Delivery & Integration
        • By Pricing Model
    • Netherlands
      • Pricing Analysis
      • Market Share Analysis, 2024
        • By Learning Stage
        • By Subject / Use Case
        • By Interaction Mode
        • By Service Type
        • By Delivery & Integration
        • By Pricing Model
    • Nordic
      • Pricing Analysis
      • Market Share Analysis, 2024
        • By Learning Stage
        • By Subject / Use Case
        • By Interaction Mode
        • By Service Type
        • By Delivery & Integration
        • By Pricing Model
    • Switzerland
      • Pricing Analysis
      • Market Share Analysis, 2024
        • By Learning Stage
        • By Subject / Use Case
        • By Interaction Mode
        • By Service Type
        • By Delivery & Integration
        • By Pricing Model
    • Russia
      • Pricing Analysis
      • Market Share Analysis, 2024
        • By Learning Stage
        • By Subject / Use Case
        • By Interaction Mode
        • By Service Type
        • By Delivery & Integration
        • By Pricing Model
    • Poland
      • Pricing Analysis
      • Market Share Analysis, 2024
        • By Learning Stage
        • By Subject / Use Case
        • By Interaction Mode
        • By Service Type
        • By Delivery & Integration
        • By Pricing Model
    • China
      • Pricing Analysis
      • Market Share Analysis, 2024
        • By Learning Stage
        • By Subject / Use Case
        • By Interaction Mode
        • By Service Type
        • By Delivery & Integration
        • By Pricing Model
    • Japan
      • Pricing Analysis
      • Market Share Analysis, 2024
        • By Learning Stage
        • By Subject / Use Case
        • By Interaction Mode
        • By Service Type
        • By Delivery & Integration
        • By Pricing Model
    • South Korea
      • Pricing Analysis
      • Market Share Analysis, 2024
        • By Learning Stage
        • By Subject / Use Case
        • By Interaction Mode
        • By Service Type
        • By Delivery & Integration
        • By Pricing Model
    • India
      • Pricing Analysis
      • Market Share Analysis, 2024
        • By Learning Stage
        • By Subject / Use Case
        • By Interaction Mode
        • By Service Type
        • By Delivery & Integration
        • By Pricing Model
    • Thailand
      • Pricing Analysis
      • Market Share Analysis, 2024
        • By Learning Stage
        • By Subject / Use Case
        • By Interaction Mode
        • By Service Type
        • By Delivery & Integration
        • By Pricing Model
    • Indonesia
      • Pricing Analysis
      • Market Share Analysis, 2024
        • By Learning Stage
        • By Subject / Use Case
        • By Interaction Mode
        • By Service Type
        • By Delivery & Integration
        • By Pricing Model
    • Australia
      • Pricing Analysis
      • Market Share Analysis, 2024
        • By Learning Stage
        • By Subject / Use Case
        • By Interaction Mode
        • By Service Type
        • By Delivery & Integration
        • By Pricing Model
    • New Zealand
      • Pricing Analysis
      • Market Share Analysis, 2024
        • By Learning Stage
        • By Subject / Use Case
        • By Interaction Mode
        • By Service Type
        • By Delivery & Integration
        • By Pricing Model
    • Turkey
      • Pricing Analysis
      • Market Share Analysis, 2024
        • By Learning Stage
        • By Subject / Use Case
        • By Interaction Mode
        • By Service Type
        • By Delivery & Integration
        • By Pricing Model
    • UAE
      • Pricing Analysis
      • Market Share Analysis, 2024
        • By Learning Stage
        • By Subject / Use Case
        • By Interaction Mode
        • By Service Type
        • By Delivery & Integration
        • By Pricing Model
    • Saudi Arabia
      • Pricing Analysis
      • Market Share Analysis, 2024
        • By Learning Stage
        • By Subject / Use Case
        • By Interaction Mode
        • By Service Type
        • By Delivery & Integration
        • By Pricing Model
    • Israel
      • Pricing Analysis
      • Market Share Analysis, 2024
        • By Learning Stage
        • By Subject / Use Case
        • By Interaction Mode
        • By Service Type
        • By Delivery & Integration
        • By Pricing Model
    • North Africa
      • Pricing Analysis
      • Market Share Analysis, 2024
        • By Learning Stage
        • By Subject / Use Case
        • By Interaction Mode
        • By Service Type
        • By Delivery & Integration
        • By Pricing Model
    • South Africa
      • Pricing Analysis
      • Market Share Analysis, 2024
        • By Learning Stage
        • By Subject / Use Case
        • By Interaction Mode
        • By Service Type
        • By Delivery & Integration
        • By Pricing Model
  19. Market Structure Analysis
    • Competition Dashboard
    • Competition Benchmarking
    • Market Share Analysis of Top Players
      • By Regional
      • By Learning Stage
      • By Subject / Use Case
      • By Interaction Mode
      • By Service Type
      • By Delivery & Integration
      • By Pricing Model
  20. Competition Analysis
    • Competition Deep Dive
      • Khan Academy (Khanmigo)
        • Overview
        • Product Portfolio
        • Profitability by Market Segments (Product/Age /Sales Channel/Region)
        • Sales Footprint
        • Strategy Overview
          • Marketing Strategy
          • Product Strategy
          • Channel Strategy
      • Duolingo
        • Overview
        • Product Portfolio
        • Profitability by Market Segments (Product/Age /Sales Channel/Region)
        • Sales Footprint
        • Strategy Overview
          • Marketing Strategy
          • Product Strategy
          • Channel Strategy
      • Quizlet (Q-Chat)
        • Overview
        • Product Portfolio
        • Profitability by Market Segments (Product/Age /Sales Channel/Region)
        • Sales Footprint
        • Strategy Overview
          • Marketing Strategy
          • Product Strategy
          • Channel Strategy
      • McGraw Hill ALEKS
        • Overview
        • Product Portfolio
        • Profitability by Market Segments (Product/Age /Sales Channel/Region)
        • Sales Footprint
        • Strategy Overview
          • Marketing Strategy
          • Product Strategy
          • Channel Strategy
      • Carnegie Learning (MATHia)
        • Overview
        • Product Portfolio
        • Profitability by Market Segments (Product/Age /Sales Channel/Region)
        • Sales Footprint
        • Strategy Overview
          • Marketing Strategy
          • Product Strategy
          • Channel Strategy
      • Riiid
        • Overview
        • Product Portfolio
        • Profitability by Market Segments (Product/Age /Sales Channel/Region)
        • Sales Footprint
        • Strategy Overview
          • Marketing Strategy
          • Product Strategy
          • Channel Strategy
      • Squirrel AI Learning
        • Overview
        • Product Portfolio
        • Profitability by Market Segments (Product/Age /Sales Channel/Region)
        • Sales Footprint
        • Strategy Overview
          • Marketing Strategy
          • Product Strategy
          • Channel Strategy
      • Brainly
        • Overview
        • Product Portfolio
        • Profitability by Market Segments (Product/Age /Sales Channel/Region)
        • Sales Footprint
        • Strategy Overview
          • Marketing Strategy
          • Product Strategy
          • Channel Strategy
      • ELSA Speak
        • Overview
        • Product Portfolio
        • Profitability by Market Segments (Product/Age /Sales Channel/Region)
        • Sales Footprint
        • Strategy Overview
          • Marketing Strategy
          • Product Strategy
          • Channel Strategy
      • Photomath
        • Overview
        • Product Portfolio
        • Profitability by Market Segments (Product/Age /Sales Channel/Region)
        • Sales Footprint
        • Strategy Overview
          • Marketing Strategy
          • Product Strategy
          • Channel Strategy
      • Others
        • Overview
        • Product Portfolio
        • Profitability by Market Segments (Product/Age /Sales Channel/Region)
        • Sales Footprint
        • Strategy Overview
          • Marketing Strategy
          • Product Strategy
          • Channel Strategy
  21. Assumptions & Acronyms Used
  22. Research Methodology

List of Tables

  • Table 1: Global Value (USD Million) Forecast by Region, 2020-2035
  • Table 2: Global Volume (Units) Forecast by Region, 2020-2035
  • Table 3: Global Value (USD Million) Forecast by Learning Stage, 2020-2035
  • Table 4: Global Volume (Units) Forecast by Learning Stage, 2020-2035
  • Table 5: Global Value (USD Million) Forecast by Subject / Use Case, 2020-2035
  • Table 6: Global Volume (Units) Forecast by Subject / Use Case, 2020-2035
  • Table 7: Global Value (USD Million) Forecast by Interaction Mode, 2020-2035
  • Table 8: Global Volume (Units) Forecast by Interaction Mode, 2020-2035
  • Table 9: Global Value (USD Million) Forecast by Service Type, 2020-2035
  • Table 10: Global Volume (Units) Forecast by Service Type, 2020-2035
  • Table 11: Global Value (USD Million) Forecast by Delivery & Integration, 2020-2035
  • Table 12: Global Volume (Units) Forecast by Delivery & Integration, 2020-2035
  • Table 13: Global Value (USD Million) Forecast by Pricing Model, 2020-2035
  • Table 14: Global Volume (Units) Forecast by Pricing Model, 2020-2035
  • Table 15: North America Value (USD Million) Forecast by Country, 2020-2035
  • Table 16: North America Volume (Units) Forecast by Country, 2020-2035
  • Table 17: North America Value (USD Million) Forecast by Learning Stage, 2020-2035
  • Table 18: North America Volume (Units) Forecast by Learning Stage, 2020-2035
  • Table 19: North America Value (USD Million) Forecast by Subject / Use Case, 2020-2035
  • Table 20: North America Volume (Units) Forecast by Subject / Use Case, 2020-2035
  • Table 21: North America Value (USD Million) Forecast by Interaction Mode, 2020-2035
  • Table 22: North America Volume (Units) Forecast by Interaction Mode, 2020-2035
  • Table 23: North America Value (USD Million) Forecast by Service Type, 2020-2035
  • Table 24: North America Volume (Units) Forecast by Service Type, 2020-2035
  • Table 25: North America Value (USD Million) Forecast by Delivery & Integration, 2020-2035
  • Table 26: North America Volume (Units) Forecast by Delivery & Integration, 2020-2035
  • Table 27: North America Value (USD Million) Forecast by Pricing Model, 2020-2035
  • Table 28: North America Volume (Units) Forecast by Pricing Model, 2020-2035
  • Table 29: Latin America Value (USD Million) Forecast by Country, 2020-2035
  • Table 30: Latin America Volume (Units) Forecast by Country, 2020-2035
  • Table 31: Latin America Value (USD Million) Forecast by Learning Stage, 2020-2035
  • Table 32: Latin America Volume (Units) Forecast by Learning Stage, 2020-2035
  • Table 33: Latin America Value (USD Million) Forecast by Subject / Use Case, 2020-2035
  • Table 34: Latin America Volume (Units) Forecast by Subject / Use Case, 2020-2035
  • Table 35: Latin America Value (USD Million) Forecast by Interaction Mode, 2020-2035
  • Table 36: Latin America Volume (Units) Forecast by Interaction Mode, 2020-2035
  • Table 37: Latin America Value (USD Million) Forecast by Service Type, 2020-2035
  • Table 38: Latin America Volume (Units) Forecast by Service Type, 2020-2035
  • Table 39: Latin America Value (USD Million) Forecast by Delivery & Integration, 2020-2035
  • Table 40: Latin America Volume (Units) Forecast by Delivery & Integration, 2020-2035
  • Table 41: Latin America Value (USD Million) Forecast by Pricing Model, 2020-2035
  • Table 42: Latin America Volume (Units) Forecast by Pricing Model, 2020-2035
  • Table 43: Europe Value (USD Million) Forecast by Country, 2020-2035
  • Table 44: Europe Volume (Units) Forecast by Country, 2020-2035
  • Table 45: Europe Value (USD Million) Forecast by Learning Stage, 2020-2035
  • Table 46: Europe Volume (Units) Forecast by Learning Stage, 2020-2035
  • Table 47: Europe Value (USD Million) Forecast by Subject / Use Case, 2020-2035
  • Table 48: Europe Volume (Units) Forecast by Subject / Use Case, 2020-2035
  • Table 49: Europe Value (USD Million) Forecast by Interaction Mode, 2020-2035
  • Table 50: Europe Volume (Units) Forecast by Interaction Mode, 2020-2035
  • Table 51: Europe Value (USD Million) Forecast by Service Type, 2020-2035
  • Table 52: Europe Volume (Units) Forecast by Service Type, 2020-2035
  • Table 53: Europe Value (USD Million) Forecast by Delivery & Integration, 2020-2035
  • Table 54: Europe Volume (Units) Forecast by Delivery & Integration, 2020-2035
  • Table 55: Europe Value (USD Million) Forecast by Pricing Model, 2020-2035
  • Table 56: Europe Volume (Units) Forecast by Pricing Model, 2020-2035
  • Table 57: East Asia Value (USD Million) Forecast by Country, 2020-2035
  • Table 58: East Asia Volume (Units) Forecast by Country, 2020-2035
  • Table 59: East Asia Value (USD Million) Forecast by Learning Stage, 2020-2035
  • Table 60: East Asia Volume (Units) Forecast by Learning Stage, 2020-2035
  • Table 61: East Asia Value (USD Million) Forecast by Subject / Use Case, 2020-2035
  • Table 62: East Asia Volume (Units) Forecast by Subject / Use Case, 2020-2035
  • Table 63: East Asia Value (USD Million) Forecast by Interaction Mode, 2020-2035
  • Table 64: East Asia Volume (Units) Forecast by Interaction Mode, 2020-2035
  • Table 65: East Asia Value (USD Million) Forecast by Service Type, 2020-2035
  • Table 66: East Asia Volume (Units) Forecast by Service Type, 2020-2035
  • Table 67: East Asia Value (USD Million) Forecast by Delivery & Integration, 2020-2035
  • Table 68: East Asia Volume (Units) Forecast by Delivery & Integration, 2020-2035
  • Table 69: East Asia Value (USD Million) Forecast by Pricing Model, 2020-2035
  • Table 70: East Asia Volume (Units) Forecast by Pricing Model, 2020-2035
  • Table 71: South Asia & Pacific Value (USD Million) Forecast by Country, 2020-2035
  • Table 72: South Asia & Pacific Volume (Units) Forecast by Country, 2020-2035
  • Table 73: South Asia & Pacific Value (USD Million) Forecast by Learning Stage, 2020-2035
  • Table 74: South Asia & Pacific Volume (Units) Forecast by Learning Stage, 2020-2035
  • Table 75: South Asia & Pacific Value (USD Million) Forecast by Subject / Use Case, 2020-2035
  • Table 76: South Asia & Pacific Volume (Units) Forecast by Subject / Use Case, 2020-2035
  • Table 77: South Asia & Pacific Value (USD Million) Forecast by Interaction Mode, 2020-2035
  • Table 78: South Asia & Pacific Volume (Units) Forecast by Interaction Mode, 2020-2035
  • Table 79: South Asia & Pacific Value (USD Million) Forecast by Service Type, 2020-2035
  • Table 80: South Asia & Pacific Volume (Units) Forecast by Service Type, 2020-2035
  • Table 81: South Asia & Pacific Value (USD Million) Forecast by Delivery & Integration, 2020-2035
  • Table 82: South Asia & Pacific Volume (Units) Forecast by Delivery & Integration, 2020-2035
  • Table 83: South Asia & Pacific Value (USD Million) Forecast by Pricing Model, 2020-2035
  • Table 84: South Asia & Pacific Volume (Units) Forecast by Pricing Model, 2020-2035
  • Table 85: Middle East and Africa Value (USD Million) Forecast by Country, 2020-2035
  • Table 86: Middle East and Africa Volume (Units) Forecast by Country, 2020-2035
  • Table 87: Middle East and Africa Value (USD Million) Forecast by Learning Stage, 2020-2035
  • Table 88: Middle East and Africa Volume (Units) Forecast by Learning Stage, 2020-2035
  • Table 89: Middle East and Africa Value (USD Million) Forecast by Subject / Use Case, 2020-2035
  • Table 90: Middle East and Africa Volume (Units) Forecast by Subject / Use Case, 2020-2035
  • Table 91: Middle East and Africa Value (USD Million) Forecast by Interaction Mode, 2020-2035
  • Table 92: Middle East and Africa Volume (Units) Forecast by Interaction Mode, 2020-2035
  • Table 93: Middle East and Africa Value (USD Million) Forecast by Service Type, 2020-2035
  • Table 94: Middle East and Africa Volume (Units) Forecast by Service Type, 2020-2035
  • Table 95: Middle East and Africa Value (USD Million) Forecast by Delivery & Integration, 2020-2035
  • Table 96: Middle East and Africa Volume (Units) Forecast by Delivery & Integration, 2020-2035
  • Table 97: Middle East and Africa Value (USD Million) Forecast by Pricing Model, 2020-2035
  • Table 98: Middle East and Africa Volume (Units) Forecast by Pricing Model, 2020-2035

List of Figures

  • Figure 1: Global Value (USD Million) by Learning Stage, 2025-2035
  • Figure 2: Global Value (USD Million) by Subject / Use Case, 2025-2035
  • Figure 3: Global Value (USD Million) by Interaction Mode, 2025-2035
  • Figure 4: Global Value (USD Million) by Service Type, 2025-2035
  • Figure 5: Global Value (USD Million) by Delivery & Integration, 2025-2035
  • Figure 6: Global Value (USD Million) by Pricing Model, 2025-2035
  • Figure 7: Global Value (USD Million) by Region, 2025-2035
  • Figure 8: Global Value (USD Million) Analysis by Region, 2020-2035
  • Figure 9: Global Volume (Units) Analysis by Region, 2020-2035
  • Figure 10: Global Value Share (%) and BPS Analysis by Region, 2025-2035
  • Figure 11: Global Y-o-Y Growth (%) Projections by Region, 2025-2035
  • Figure 12: Global Value (USD Million) Analysis by Learning Stage, 2020-2035
  • Figure 13: Global Volume (Units) Analysis by Learning Stage, 2020-2035
  • Figure 14: Global Value Share (%) and BPS Analysis by Learning Stage, 2025-2035
  • Figure 15: Global Y-o-Y Growth (%) Projections by Learning Stage, 2025-2035
  • Figure 16: Global Value (USD Million) Analysis by Subject / Use Case, 2020-2035
  • Figure 17: Global Volume (Units) Analysis by Subject / Use Case, 2020-2035
  • Figure 18: Global Value Share (%) and BPS Analysis by Subject / Use Case, 2025-2035
  • Figure 19: Global Y-o-Y Growth (%) Projections by Subject / Use Case, 2025-2035
  • Figure 20: Global Value (USD Million) Analysis by Interaction Mode, 2020-2035
  • Figure 21: Global Volume (Units) Analysis by Interaction Mode, 2020-2035
  • Figure 22: Global Value Share (%) and BPS Analysis by Interaction Mode, 2025-2035
  • Figure 23: Global Y-o-Y Growth (%) Projections by Interaction Mode, 2025-2035
  • Figure 24: Global Value (USD Million) Analysis by Service Type, 2020-2035
  • Figure 25: Global Volume (Units) Analysis by Service Type, 2020-2035
  • Figure 26: Global Value Share (%) and BPS Analysis by Service Type, 2025-2035
  • Figure 27: Global Y-o-Y Growth (%) Projections by Service Type, 2025-2035
  • Figure 28: Global Value (USD Million) Analysis by Delivery & Integration, 2020-2035
  • Figure 29: Global Volume (Units) Analysis by Delivery & Integration, 2020-2035
  • Figure 30: Global Value Share (%) and BPS Analysis by Delivery & Integration, 2025-2035
  • Figure 31: Global Y-o-Y Growth (%) Projections by Delivery & Integration, 2025-2035
  • Figure 32: Global Value (USD Million) Analysis by Pricing Model, 2020-2035
  • Figure 33: Global Volume (Units) Analysis by Pricing Model, 2020-2035
  • Figure 34: Global Value Share (%) and BPS Analysis by Pricing Model, 2025-2035
  • Figure 35: Global Y-o-Y Growth (%) Projections by Pricing Model, 2025-2035
  • Figure 36: Global Attractiveness by Learning Stage, 2025-2035
  • Figure 37: Global Attractiveness by Subject / Use Case, 2025-2035
  • Figure 38: Global Attractiveness by Interaction Mode, 2025-2035
  • Figure 39: Global Attractiveness by Service Type, 2025-2035
  • Figure 40: Global Attractiveness by Delivery & Integration, 2025-2035
  • Figure 41: Global Attractiveness by Pricing Model, 2025-2035
  • Figure 42: Global Attractiveness by Region, 2025-2035
  • Figure 43: North America Value (USD Million) by Learning Stage, 2025-2035
  • Figure 44: North America Value (USD Million) by Subject / Use Case, 2025-2035
  • Figure 45: North America Value (USD Million) by Interaction Mode, 2025-2035
  • Figure 46: North America Value (USD Million) by Service Type, 2025-2035
  • Figure 47: North America Value (USD Million) by Delivery & Integration, 2025-2035
  • Figure 48: North America Value (USD Million) by Pricing Model, 2025-2035
  • Figure 49: North America Value (USD Million) by Country, 2025-2035
  • Figure 50: North America Value (USD Million) Analysis by Country, 2020-2035
  • Figure 51: North America Volume (Units) Analysis by Country, 2020-2035
  • Figure 52: North America Value Share (%) and BPS Analysis by Country, 2025-2035
  • Figure 53: North America Y-o-Y Growth (%) Projections by Country, 2025-2035
  • Figure 54: North America Value (USD Million) Analysis by Learning Stage, 2020-2035
  • Figure 55: North America Volume (Units) Analysis by Learning Stage, 2020-2035
  • Figure 56: North America Value Share (%) and BPS Analysis by Learning Stage, 2025-2035
  • Figure 57: North America Y-o-Y Growth (%) Projections by Learning Stage, 2025-2035
  • Figure 58: North America Value (USD Million) Analysis by Subject / Use Case, 2020-2035
  • Figure 59: North America Volume (Units) Analysis by Subject / Use Case, 2020-2035
  • Figure 60: North America Value Share (%) and BPS Analysis by Subject / Use Case, 2025-2035
  • Figure 61: North America Y-o-Y Growth (%) Projections by Subject / Use Case, 2025-2035
  • Figure 62: North America Value (USD Million) Analysis by Interaction Mode, 2020-2035
  • Figure 63: North America Volume (Units) Analysis by Interaction Mode, 2020-2035
  • Figure 64: North America Value Share (%) and BPS Analysis by Interaction Mode, 2025-2035
  • Figure 65: North America Y-o-Y Growth (%) Projections by Interaction Mode, 2025-2035
  • Figure 66: North America Value (USD Million) Analysis by Service Type, 2020-2035
  • Figure 67: North America Volume (Units) Analysis by Service Type, 2020-2035
  • Figure 68: North America Value Share (%) and BPS Analysis by Service Type, 2025-2035
  • Figure 69: North America Y-o-Y Growth (%) Projections by Service Type, 2025-2035
  • Figure 70: North America Value (USD Million) Analysis by Delivery & Integration, 2020-2035
  • Figure 71: North America Volume (Units) Analysis by Delivery & Integration, 2020-2035
  • Figure 72: North America Value Share (%) and BPS Analysis by Delivery & Integration, 2025-2035
  • Figure 73: North America Y-o-Y Growth (%) Projections by Delivery & Integration, 2025-2035
  • Figure 74: North America Value (USD Million) Analysis by Pricing Model, 2020-2035
  • Figure 75: North America Volume (Units) Analysis by Pricing Model, 2020-2035
  • Figure 76: North America Value Share (%) and BPS Analysis by Pricing Model, 2025-2035
  • Figure 77: North America Y-o-Y Growth (%) Projections by Pricing Model, 2025-2035
  • Figure 78: North America Attractiveness by Learning Stage, 2025-2035
  • Figure 79: North America Attractiveness by Subject / Use Case, 2025-2035
  • Figure 80: North America Attractiveness by Interaction Mode, 2025-2035
  • Figure 81: North America Attractiveness by Service Type, 2025-2035
  • Figure 82: North America Attractiveness by Delivery & Integration, 2025-2035
  • Figure 83: North America Attractiveness by Pricing Model, 2025-2035
  • Figure 84: North America Attractiveness by Country, 2025-2035
  • Figure 85: Latin America Value (USD Million) by Learning Stage, 2025-2035
  • Figure 86: Latin America Value (USD Million) by Subject / Use Case, 2025-2035
  • Figure 87: Latin America Value (USD Million) by Interaction Mode, 2025-2035
  • Figure 88: Latin America Value (USD Million) by Service Type, 2025-2035
  • Figure 89: Latin America Value (USD Million) by Delivery & Integration, 2025-2035
  • Figure 90: Latin America Value (USD Million) by Pricing Model, 2025-2035
  • Figure 91: Latin America Value (USD Million) by Country, 2025-2035
  • Figure 92: Latin America Value (USD Million) Analysis by Country, 2020-2035
  • Figure 93: Latin America Volume (Units) Analysis by Country, 2020-2035
  • Figure 94: Latin America Value Share (%) and BPS Analysis by Country, 2025-2035
  • Figure 95: Latin America Y-o-Y Growth (%) Projections by Country, 2025-2035
  • Figure 96: Latin America Value (USD Million) Analysis by Learning Stage, 2020-2035
  • Figure 97: Latin America Volume (Units) Analysis by Learning Stage, 2020-2035
  • Figure 98: Latin America Value Share (%) and BPS Analysis by Learning Stage, 2025-2035
  • Figure 99: Latin America Y-o-Y Growth (%) Projections by Learning Stage, 2025-2035
  • Figure 100: Latin America Value (USD Million) Analysis by Subject / Use Case, 2020-2035
  • Figure 101: Latin America Volume (Units) Analysis by Subject / Use Case, 2020-2035
  • Figure 102: Latin America Value Share (%) and BPS Analysis by Subject / Use Case, 2025-2035
  • Figure 103: Latin America Y-o-Y Growth (%) Projections by Subject / Use Case, 2025-2035
  • Figure 104: Latin America Value (USD Million) Analysis by Interaction Mode, 2020-2035
  • Figure 105: Latin America Volume (Units) Analysis by Interaction Mode, 2020-2035
  • Figure 106: Latin America Value Share (%) and BPS Analysis by Interaction Mode, 2025-2035
  • Figure 107: Latin America Y-o-Y Growth (%) Projections by Interaction Mode, 2025-2035
  • Figure 108: Latin America Value (USD Million) Analysis by Service Type, 2020-2035
  • Figure 109: Latin America Volume (Units) Analysis by Service Type, 2020-2035
  • Figure 110: Latin America Value Share (%) and BPS Analysis by Service Type, 2025-2035
  • Figure 111: Latin America Y-o-Y Growth (%) Projections by Service Type, 2025-2035
  • Figure 112: Latin America Value (USD Million) Analysis by Delivery & Integration, 2020-2035
  • Figure 113: Latin America Volume (Units) Analysis by Delivery & Integration, 2020-2035
  • Figure 114: Latin America Value Share (%) and BPS Analysis by Delivery & Integration, 2025-2035
  • Figure 115: Latin America Y-o-Y Growth (%) Projections by Delivery & Integration, 2025-2035
  • Figure 116: Latin America Value (USD Million) Analysis by Pricing Model, 2020-2035
  • Figure 117: Latin America Volume (Units) Analysis by Pricing Model, 2020-2035
  • Figure 118: Latin America Value Share (%) and BPS Analysis by Pricing Model, 2025-2035
  • Figure 119: Latin America Y-o-Y Growth (%) Projections by Pricing Model, 2025-2035
  • Figure 120: Latin America Attractiveness by Learning Stage, 2025-2035
  • Figure 121: Latin America Attractiveness by Subject / Use Case, 2025-2035
  • Figure 122: Latin America Attractiveness by Interaction Mode, 2025-2035
  • Figure 123: Latin America Attractiveness by Service Type, 2025-2035
  • Figure 124: Latin America Attractiveness by Delivery & Integration, 2025-2035
  • Figure 125: Latin America Attractiveness by Pricing Model, 2025-2035
  • Figure 126: Latin America Attractiveness by Country, 2025-2035
  • Figure 127: Europe Value (USD Million) by Learning Stage, 2025-2035
  • Figure 128: Europe Value (USD Million) by Subject / Use Case, 2025-2035
  • Figure 129: Europe Value (USD Million) by Interaction Mode, 2025-2035
  • Figure 130: Europe Value (USD Million) by Service Type, 2025-2035
  • Figure 131: Europe Value (USD Million) by Delivery & Integration, 2025-2035
  • Figure 132: Europe Value (USD Million) by Pricing Model, 2025-2035
  • Figure 133: Europe Value (USD Million) by Country, 2025-2035
  • Figure 134: Europe Value (USD Million) Analysis by Country, 2020-2035
  • Figure 135: Europe Volume (Units) Analysis by Country, 2020-2035
  • Figure 136: Europe Value Share (%) and BPS Analysis by Country, 2025-2035
  • Figure 137: Europe Y-o-Y Growth (%) Projections by Country, 2025-2035
  • Figure 138: Europe Value (USD Million) Analysis by Learning Stage, 2020-2035
  • Figure 139: Europe Volume (Units) Analysis by Learning Stage, 2020-2035
  • Figure 140: Europe Value Share (%) and BPS Analysis by Learning Stage, 2025-2035
  • Figure 141: Europe Y-o-Y Growth (%) Projections by Learning Stage, 2025-2035
  • Figure 142: Europe Value (USD Million) Analysis by Subject / Use Case, 2020-2035
  • Figure 143: Europe Volume (Units) Analysis by Subject / Use Case, 2020-2035
  • Figure 144: Europe Value Share (%) and BPS Analysis by Subject / Use Case, 2025-2035
  • Figure 145: Europe Y-o-Y Growth (%) Projections by Subject / Use Case, 2025-2035
  • Figure 146: Europe Value (USD Million) Analysis by Interaction Mode, 2020-2035
  • Figure 147: Europe Volume (Units) Analysis by Interaction Mode, 2020-2035
  • Figure 148: Europe Value Share (%) and BPS Analysis by Interaction Mode, 2025-2035
  • Figure 149: Europe Y-o-Y Growth (%) Projections by Interaction Mode, 2025-2035
  • Figure 150: Europe Value (USD Million) Analysis by Service Type, 2020-2035
  • Figure 151: Europe Volume (Units) Analysis by Service Type, 2020-2035
  • Figure 152: Europe Value Share (%) and BPS Analysis by Service Type, 2025-2035
  • Figure 153: Europe Y-o-Y Growth (%) Projections by Service Type, 2025-2035
  • Figure 154: Europe Value (USD Million) Analysis by Delivery & Integration, 2020-2035
  • Figure 155: Europe Volume (Units) Analysis by Delivery & Integration, 2020-2035
  • Figure 156: Europe Value Share (%) and BPS Analysis by Delivery & Integration, 2025-2035
  • Figure 157: Europe Y-o-Y Growth (%) Projections by Delivery & Integration, 2025-2035
  • Figure 158: Europe Value (USD Million) Analysis by Pricing Model, 2020-2035
  • Figure 159: Europe Volume (Units) Analysis by Pricing Model, 2020-2035
  • Figure 160: Europe Value Share (%) and BPS Analysis by Pricing Model, 2025-2035
  • Figure 161: Europe Y-o-Y Growth (%) Projections by Pricing Model, 2025-2035
  • Figure 162: Europe Attractiveness by Learning Stage, 2025-2035
  • Figure 163: Europe Attractiveness by Subject / Use Case, 2025-2035
  • Figure 164: Europe Attractiveness by Interaction Mode, 2025-2035
  • Figure 165: Europe Attractiveness by Service Type, 2025-2035
  • Figure 166: Europe Attractiveness by Delivery & Integration, 2025-2035
  • Figure 167: Europe Attractiveness by Pricing Model, 2025-2035
  • Figure 168: Europe Attractiveness by Country, 2025-2035
  • Figure 169: East Asia Value (USD Million) by Learning Stage, 2025-2035
  • Figure 170: East Asia Value (USD Million) by Subject / Use Case, 2025-2035
  • Figure 171: East Asia Value (USD Million) by Interaction Mode, 2025-2035
  • Figure 172: East Asia Value (USD Million) by Service Type, 2025-2035
  • Figure 173: East Asia Value (USD Million) by Delivery & Integration, 2025-2035
  • Figure 174: East Asia Value (USD Million) by Pricing Model, 2025-2035
  • Figure 175: East Asia Value (USD Million) by Country, 2025-2035
  • Figure 176: East Asia Value (USD Million) Analysis by Country, 2020-2035
  • Figure 177: East Asia Volume (Units) Analysis by Country, 2020-2035
  • Figure 178: East Asia Value Share (%) and BPS Analysis by Country, 2025-2035
  • Figure 179: East Asia Y-o-Y Growth (%) Projections by Country, 2025-2035
  • Figure 180: East Asia Value (USD Million) Analysis by Learning Stage, 2020-2035
  • Figure 181: East Asia Volume (Units) Analysis by Learning Stage, 2020-2035
  • Figure 182: East Asia Value Share (%) and BPS Analysis by Learning Stage, 2025-2035
  • Figure 183: East Asia Y-o-Y Growth (%) Projections by Learning Stage, 2025-2035
  • Figure 184: East Asia Value (USD Million) Analysis by Subject / Use Case, 2020-2035
  • Figure 185: East Asia Volume (Units) Analysis by Subject / Use Case, 2020-2035
  • Figure 186: East Asia Value Share (%) and BPS Analysis by Subject / Use Case, 2025-2035
  • Figure 187: East Asia Y-o-Y Growth (%) Projections by Subject / Use Case, 2025-2035
  • Figure 188: East Asia Value (USD Million) Analysis by Interaction Mode, 2020-2035
  • Figure 189: East Asia Volume (Units) Analysis by Interaction Mode, 2020-2035
  • Figure 190: East Asia Value Share (%) and BPS Analysis by Interaction Mode, 2025-2035
  • Figure 191: East Asia Y-o-Y Growth (%) Projections by Interaction Mode, 2025-2035
  • Figure 192: East Asia Value (USD Million) Analysis by Service Type, 2020-2035
  • Figure 193: East Asia Volume (Units) Analysis by Service Type, 2020-2035
  • Figure 194: East Asia Value Share (%) and BPS Analysis by Service Type, 2025-2035
  • Figure 195: East Asia Y-o-Y Growth (%) Projections by Service Type, 2025-2035
  • Figure 196: East Asia Value (USD Million) Analysis by Delivery & Integration, 2020-2035
  • Figure 197: East Asia Volume (Units) Analysis by Delivery & Integration, 2020-2035
  • Figure 198: East Asia Value Share (%) and BPS Analysis by Delivery & Integration, 2025-2035
  • Figure 199: East Asia Y-o-Y Growth (%) Projections by Delivery & Integration, 2025-2035
  • Figure 200: East Asia Value (USD Million) Analysis by Pricing Model, 2020-2035
  • Figure 201: East Asia Volume (Units) Analysis by Pricing Model, 2020-2035
  • Figure 202: East Asia Value Share (%) and BPS Analysis by Pricing Model, 2025-2035
  • Figure 203: East Asia Y-o-Y Growth (%) Projections by Pricing Model, 2025-2035
  • Figure 204: East Asia Attractiveness by Learning Stage, 2025-2035
  • Figure 205: East Asia Attractiveness by Subject / Use Case, 2025-2035
  • Figure 206: East Asia Attractiveness by Interaction Mode, 2025-2035
  • Figure 207: East Asia Attractiveness by Service Type, 2025-2035
  • Figure 208: East Asia Attractiveness by Delivery & Integration, 2025-2035
  • Figure 209: East Asia Attractiveness by Pricing Model, 2025-2035
  • Figure 210: East Asia Attractiveness by Country, 2025-2035
  • Figure 211: South Asia & Pacific Value (USD Million) by Learning Stage, 2025-2035
  • Figure 212: South Asia & Pacific Value (USD Million) by Subject / Use Case, 2025-2035
  • Figure 213: South Asia & Pacific Value (USD Million) by Interaction Mode, 2025-2035
  • Figure 214: South Asia & Pacific Value (USD Million) by Service Type, 2025-2035
  • Figure 215: South Asia & Pacific Value (USD Million) by Delivery & Integration, 2025-2035
  • Figure 216: South Asia & Pacific Value (USD Million) by Pricing Model, 2025-2035
  • Figure 217: South Asia & Pacific Value (USD Million) by Country, 2025-2035
  • Figure 218: South Asia & Pacific Value (USD Million) Analysis by Country, 2020-2035
  • Figure 219: South Asia & Pacific Volume (Units) Analysis by Country, 2020-2035
  • Figure 220: South Asia & Pacific Value Share (%) and BPS Analysis by Country, 2025-2035
  • Figure 221: South Asia & Pacific Y-o-Y Growth (%) Projections by Country, 2025-2035
  • Figure 222: South Asia & Pacific Value (USD Million) Analysis by Learning Stage, 2020-2035
  • Figure 223: South Asia & Pacific Volume (Units) Analysis by Learning Stage, 2020-2035
  • Figure 224: South Asia & Pacific Value Share (%) and BPS Analysis by Learning Stage, 2025-2035
  • Figure 225: South Asia & Pacific Y-o-Y Growth (%) Projections by Learning Stage, 2025-2035
  • Figure 226: South Asia & Pacific Value (USD Million) Analysis by Subject / Use Case, 2020-2035
  • Figure 227: South Asia & Pacific Volume (Units) Analysis by Subject / Use Case, 2020-2035
  • Figure 228: South Asia & Pacific Value Share (%) and BPS Analysis by Subject / Use Case, 2025-2035
  • Figure 229: South Asia & Pacific Y-o-Y Growth (%) Projections by Subject / Use Case, 2025-2035
  • Figure 230: South Asia & Pacific Value (USD Million) Analysis by Interaction Mode, 2020-2035
  • Figure 231: South Asia & Pacific Volume (Units) Analysis by Interaction Mode, 2020-2035
  • Figure 232: South Asia & Pacific Value Share (%) and BPS Analysis by Interaction Mode, 2025-2035
  • Figure 233: South Asia & Pacific Y-o-Y Growth (%) Projections by Interaction Mode, 2025-2035
  • Figure 234: South Asia & Pacific Value (USD Million) Analysis by Service Type, 2020-2035
  • Figure 235: South Asia & Pacific Volume (Units) Analysis by Service Type, 2020-2035
  • Figure 236: South Asia & Pacific Value Share (%) and BPS Analysis by Service Type, 2025-2035
  • Figure 237: South Asia & Pacific Y-o-Y Growth (%) Projections by Service Type, 2025-2035
  • Figure 238: South Asia & Pacific Value (USD Million) Analysis by Delivery & Integration, 2020-2035
  • Figure 239: South Asia & Pacific Volume (Units) Analysis by Delivery & Integration, 2020-2035
  • Figure 240: South Asia & Pacific Value Share (%) and BPS Analysis by Delivery & Integration, 2025-2035
  • Figure 241: South Asia & Pacific Y-o-Y Growth (%) Projections by Delivery & Integration, 2025-2035
  • Figure 242: South Asia & Pacific Value (USD Million) Analysis by Pricing Model, 2020-2035
  • Figure 243: South Asia & Pacific Volume (Units) Analysis by Pricing Model, 2020-2035
  • Figure 244: South Asia & Pacific Value Share (%) and BPS Analysis by Pricing Model, 2025-2035
  • Figure 245: South Asia & Pacific Y-o-Y Growth (%) Projections by Pricing Model, 2025-2035
  • Figure 246: South Asia & Pacific Attractiveness by Learning Stage, 2025-2035
  • Figure 247: South Asia & Pacific Attractiveness by Subject / Use Case, 2025-2035
  • Figure 248: South Asia & Pacific Attractiveness by Interaction Mode, 2025-2035
  • Figure 249: South Asia & Pacific Attractiveness by Service Type, 2025-2035
  • Figure 250: South Asia & Pacific Attractiveness by Delivery & Integration, 2025-2035
  • Figure 251: South Asia & Pacific Attractiveness by Pricing Model, 2025-2035
  • Figure 252: South Asia & Pacific Attractiveness by Country, 2025-2035
  • Figure 253: Middle East and Africa Value (USD Million) by Learning Stage, 2025-2035
  • Figure 254: Middle East and Africa Value (USD Million) by Subject / Use Case, 2025-2035
  • Figure 255: Middle East and Africa Value (USD Million) by Interaction Mode, 2025-2035
  • Figure 256: Middle East and Africa Value (USD Million) by Service Type, 2025-2035
  • Figure 257: Middle East and Africa Value (USD Million) by Delivery & Integration, 2025-2035
  • Figure 258: Middle East and Africa Value (USD Million) by Pricing Model, 2025-2035
  • Figure 259: Middle East and Africa Value (USD Million) by Country, 2025-2035
  • Figure 260: Middle East and Africa Value (USD Million) Analysis by Country, 2020-2035
  • Figure 261: Middle East and Africa Volume (Units) Analysis by Country, 2020-2035
  • Figure 262: Middle East and Africa Value Share (%) and BPS Analysis by Country, 2025-2035
  • Figure 263: Middle East and Africa Y-o-Y Growth (%) Projections by Country, 2025-2035
  • Figure 264: Middle East and Africa Value (USD Million) Analysis by Learning Stage, 2020-2035
  • Figure 265: Middle East and Africa Volume (Units) Analysis by Learning Stage, 2020-2035
  • Figure 266: Middle East and Africa Value Share (%) and BPS Analysis by Learning Stage, 2025-2035
  • Figure 267: Middle East and Africa Y-o-Y Growth (%) Projections by Learning Stage, 2025-2035
  • Figure 268: Middle East and Africa Value (USD Million) Analysis by Subject / Use Case, 2020-2035
  • Figure 269: Middle East and Africa Volume (Units) Analysis by Subject / Use Case, 2020-2035
  • Figure 270: Middle East and Africa Value Share (%) and BPS Analysis by Subject / Use Case, 2025-2035
  • Figure 271: Middle East and Africa Y-o-Y Growth (%) Projections by Subject / Use Case, 2025-2035
  • Figure 272: Middle East and Africa Value (USD Million) Analysis by Interaction Mode, 2020-2035
  • Figure 273: Middle East and Africa Volume (Units) Analysis by Interaction Mode, 2020-2035
  • Figure 274: Middle East and Africa Value Share (%) and BPS Analysis by Interaction Mode, 2025-2035
  • Figure 275: Middle East and Africa Y-o-Y Growth (%) Projections by Interaction Mode, 2025-2035
  • Figure 276: Middle East and Africa Value (USD Million) Analysis by Service Type, 2020-2035
  • Figure 277: Middle East and Africa Volume (Units) Analysis by Service Type, 2020-2035
  • Figure 278: Middle East and Africa Value Share (%) and BPS Analysis by Service Type, 2025-2035
  • Figure 279: Middle East and Africa Y-o-Y Growth (%) Projections by Service Type, 2025-2035
  • Figure 280: Middle East and Africa Value (USD Million) Analysis by Delivery & Integration, 2020-2035
  • Figure 281: Middle East and Africa Volume (Units) Analysis by Delivery & Integration, 2020-2035
  • Figure 282: Middle East and Africa Value Share (%) and BPS Analysis by Delivery & Integration, 2025-2035
  • Figure 283: Middle East and Africa Y-o-Y Growth (%) Projections by Delivery & Integration, 2025-2035
  • Figure 284: Middle East and Africa Value (USD Million) Analysis by Pricing Model, 2020-2035
  • Figure 285: Middle East and Africa Volume (Units) Analysis by Pricing Model, 2020-2035
  • Figure 286: Middle East and Africa Value Share (%) and BPS Analysis by Pricing Model, 2025-2035
  • Figure 287: Middle East and Africa Y-o-Y Growth (%) Projections by Pricing Model, 2025-2035
  • Figure 288: Middle East and Africa Attractiveness by Learning Stage, 2025-2035
  • Figure 289: Middle East and Africa Attractiveness by Subject / Use Case, 2025-2035
  • Figure 290: Middle East and Africa Attractiveness by Interaction Mode, 2025-2035
  • Figure 291: Middle East and Africa Attractiveness by Service Type, 2025-2035
  • Figure 292: Middle East and Africa Attractiveness by Delivery & Integration, 2025-2035
  • Figure 293: Middle East and Africa Attractiveness by Pricing Model, 2025-2035
  • Figure 294: Middle East and Africa Attractiveness by Country, 2025-2035

Frequently Asked Questions

How big is the AI Tutoring Services Market in 2025?

The global AI Tutoring Services Market is estimated to be valued at USD 3,716.6 million in 2025.

What will be the size of AI Tutoring Services Market in 2035?

The market size for the AI Tutoring Services Market is projected to reach USD 21,625.2 million by 2035.

How much will be the AI Tutoring Services Market grow between 2025 and 2035?

The AI Tutoring Services Market is expected to grow at a 19.3% CAGR between 2025 and 2035.

What are the key product types in the AI Tutoring Services Market?

The key product types in the AI Tutoring Services Market are Pure AI Tutor, Human + AI Hybrid Tutoring, and Teacher Assistant / Co-pilot.

Which service type segment to contribute significant share in the AI Tutoring Services Market in 2025?

In terms of service type, the Pure AI Tutor segment is projected to command 57.7% share in the AI Tutoring Services Market in 2025.

Explore Similar Insights

Future Market Insights

AI Tutoring Services Market