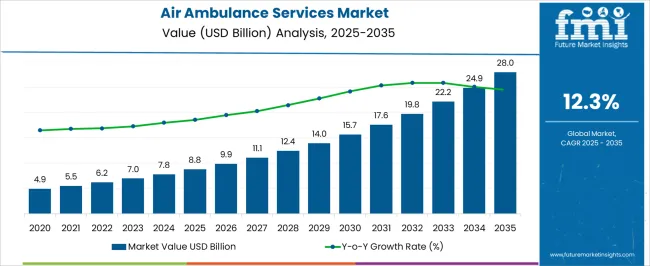
The Air Ambulance Services Market is estimated to be valued at USD 8.8 billion in 2025 and is projected to reach USD 28.0 billion by 2035, registering a compound annual growth rate (CAGR) of 12.3% over the forecast period.
| Metric | Value |
|---|---|
| Air Ambulance Services Market Estimated Value in (2025 E) | USD 8.8 billion |
| Air Ambulance Services Market Forecast Value in (2035 F) | USD 28.0 billion |
| Forecast CAGR (2025 to 2035) | 12.3% |
The Air Ambulance Services market is experiencing accelerated growth due to the increasing demand for rapid emergency medical transportation and critical care support. The rising incidence of trauma cases, cardiovascular events, and chronic illnesses has significantly influenced the market landscape, with healthcare providers seeking faster and more efficient patient transfer options. This demand is being reinforced by the expansion of specialized medical services and the need for timely access to tertiary care facilities, especially in remote and underserved areas.
According to investor briefings and hospital network reports, investments in aviation medical infrastructure and skilled personnel have been prioritized to ensure continuous service availability. Advancements in aircraft medical outfitting and integration with telemedicine capabilities are further shaping the future of this market.
Moreover, press releases from leading operators highlight growing collaborations between hospitals, insurance providers, and government agencies, which are enhancing affordability and accessibility These combined factors are paving the way for sustained and long-term growth in the global air ambulance ecosystem.
The market is segmented by Type and Service Model and region. By Type, the market is divided into Rotary-wing and Fixed-wing. In terms of Service Model, the market is classified into Hospital-based and Community-based. Regionally, the market is classified into North America, Latin America, Western Europe, Eastern Europe, Balkan & Baltic Countries, Russia & Belarus, Central Asia, East Asia, South Asia & Pacific, and the Middle East & Africa.
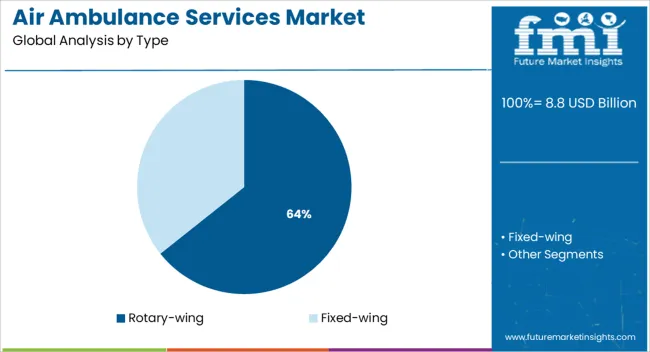
The rotary wing segment is projected to account for 64.3% of the Air Ambulance Services market revenue share in 2025, making it the leading type segment. This dominant position has been attributed to the operational flexibility and rapid deployment capabilities offered by helicopters in emergency medical situations. As reported in hospital transport briefings and aviation health updates, rotary wing aircraft are particularly suitable for short-distance travel and are capable of landing in confined spaces such as urban rooftops, highways, and remote terrains.
This has made them an essential solution for trauma cases and accident response. In addition, the ability of rotary wing aircraft to be equipped with advanced life support systems has contributed to their extensive use across both public and private emergency networks.
The relatively lower infrastructure requirements and quicker turnaround times compared to fixed-wing alternatives have further cemented their leadership These functional and logistical advantages are expected to continue driving the growth of this segment in the coming years.
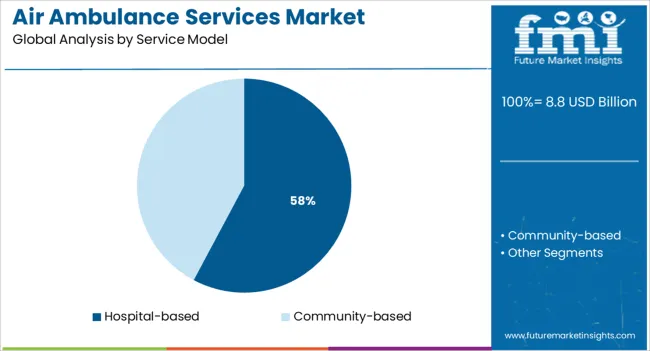
The hospital based service model is estimated to hold 57.8% of the Air Ambulance Services market revenue share in 2025, positioning it as the leading service model segment. This leadership has been shaped by the growing trend of healthcare institutions integrating dedicated air ambulance operations within their emergency and critical care networks. According to public health communications and investor updates from hospital groups, hospital based models provide improved coordination between emergency departments and air medical teams, resulting in enhanced patient outcomes.
These models allow for direct control over medical staffing, aircraft scheduling, and treatment protocols, reducing delays and improving the quality of care during transport. Additionally, the ability to customize aircraft equipment based on specific clinical requirements has increased adoption within tertiary and trauma centers.
Strategic partnerships between hospitals and aviation service providers have also improved operational efficiency and service reach These factors collectively have contributed to the segment's strong presence in the overall market and its continued growth trajectory.
As per the Air Ambulance Services Market research by Future Market Insights - a market research and competitive intelligence provider, historically, from 2020 to 2024, the market value of the Air Ambulance Services Market increased at around 11.4% CAGR.
Patients suffering from a stroke, heart attack, or traumatic incident who require time-sensitive therapy in a critical care center are increasingly using air ambulance services. According to the World Health Organization, 0.8 million Americans and a million Europeans have a stroke each year. Every year, almost 4 million people in the United States are critically injured in traffic accidents. Every year, nearly 18 million people die from cardiovascular disorders around the world.
Cases of stroke, trauma, and heart attacks necessitate time-dependent medical or surgical intervention. For example, in the treatment of ischemic stroke, restoring blood flow to the brain through an emergency IV injection of recombinant tissue plasminogen activator or an endovascular operation is crucial.
Medicare and Medicaid reimburse around 60% and 34% of the estimated cost of air patient transport, respectively, leaving patients with a significant out-of-pocket expense in many circumstances. The high cost of air medical services, along with payment issues, provides a barrier to the market's global expansion.
Trauma, stroke, and heart attack incidences are on the rise, which is driving the demand for air medical services. According to DESA, the number of individuals aged 60 and above in the United Kingdom is expected to more than quadruple by 2050, from 7.8 million in 2024.
Japan and Germany, are already super-aged countries, with people aged 65 and up accounting for 28% and 22% of the population, respectively. One of the key reasons for the rise in chronic illness prevalence is the aging population.
In the United States today, 60% of individuals have at least one chronic ailment, and 40% of adults have two or more chronic conditions. Diabetes affects around 425 million people worldwide, according to estimates.
Air Ambulance Services will witness a surge in demand as the population ages and the prevalence of chronic diseases rises. The rising incidence of chronic diseases would result in a significant increase in the frequency of life-threatening medical situations or patients who do not have immediate access to a healthcare facility, resulting in increased demand for air medical services.
Rapid Technological Advancements in Air Ambulance Services will also drive market growth. The degree of care offered to patients being evacuated with the use of sophisticated and novel medical technology is improving in air ambulances. Furthermore, technologically enhanced communication systems enable the transmission of actual figures on a patient's condition to healthcare experts, enabling physicians to plan ahead for an emergency. To provide critical care to patients, air ambulances are equipped with equipment such as heart monitors, ventilators, and defibrillators.
The Indian Ministry of Health issued a clarification in April 2024, noting that medical evacuation flights should not be conducted without official approval. Air ambulance operators must obtain authorization from district authorities in both the departure and arrival cities, valid documentation from the hospital and doctor regarding the patient's data, COVID-19 test results, and a COVID NOC from the state health department, according to the new regulations. Only a few companies provide air medical services due to the extensive procedures and constraints. As a result, the market's expansion was hampered by strict regulations and lengthy procedures.
Because of the existence of multiple air medical service providers and the availability of superior medical facilities in the region, North America is expected to dominate the market in 2024, with a double-digit CAGR during the forecast period.
During the projection period, the market in Asia-Pacific is expected to develop at the fastest CAGR. Market growth is expected to be fueled by the strengthening economies of emerging countries such as China and India, as well as increased government expenditure in the healthcare sector.
Furthermore, the fast-expanding medical tourism business in these nations can be linked to an increase in demand for air ambulance services in the region. According to the DGCI and Statistics of India's study on the Export Health Service model, India had 60,000 medical tourists on medical visas each year from 2020 to 2024.
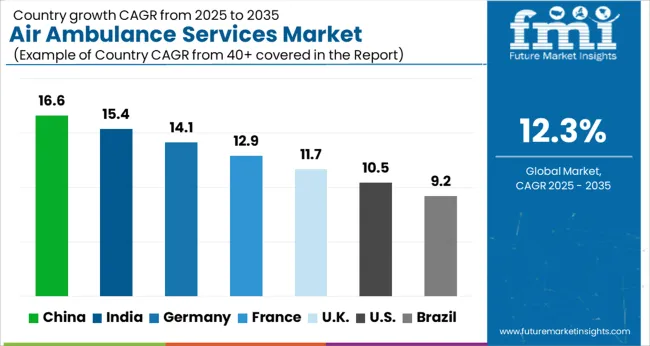
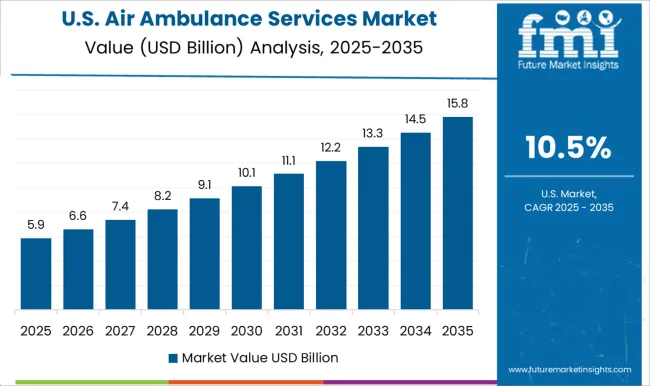
The market in the US is projected to reach a valuation of USD 28 Billion by 2035. Growing at a CAGR of over 13% from 2025 to 2035, the market in the country is expected to gross an absolute dollar opportunity of USD 5.3 Billion.
The market in the UK is expected to garner a market size of USD 809 Million by 2035. From 2025 to 2035, the market in the country is expected to gross USD 553 Million.
In Japan, the market is projected to reach USD 711 Million by 2035. During the forecast period, the market is expected to garner an absolute dollar opportunity of USD 533 Million.
The market is divided into fixed-wing and rotary-wing aircraft types based on aircraft type. Due to the surge in demand for helicopter emergency medical services (HEMS) during the COVID-19 outbreak, the rotary-wing segment is expected to be the largest and fastest-growing segment over the forecast period. Furthermore, the market expansion is expected to be aided by key manufacturers' increased development of helicopters specialized in providing healthcare services.
Airbus added more than 200 helicopters to HCare Smart in January 2024, bringing the total number of helicopters to 2250. Airbus has dedicated 19% of its global fleet to HCare.
The hospital-based service model dominated the air ambulance services market in 2024, with a revenue share of 78%, and is expected to rise at a significant rate throughout the forecast period. In some areas, a shortage of specialty care and medical physicists has resulted in a surge in the utilization of air ambulance services to transport patients to specialty hospitals quickly.
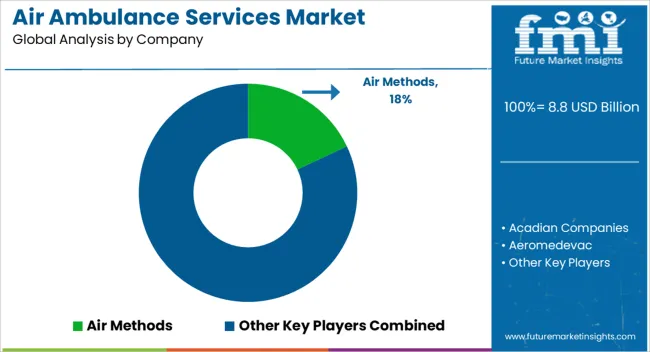
Some of the key players operating in the Air Ambulance Services market include AMR, PHI Air Medical, Babcock Scandinavian Air Ambulance, Express Air Medical Transport, REVA, Inc., Lifeguard Ambulance Service LLC, Acadian Ambulance, IAS Medical, Ltd., and American Air Ambulance.
Some of the recent developments of key Air Ambulance Services providers are as follows:
Similarly, recent developments related to companies Air Ambulance Services have been tracked by the team at Future Market Insights, which are available in the full report.
The global air ambulance services market is estimated to be valued at USD 8.8 billion in 2025.
The market size for the air ambulance services market is projected to reach USD 28.0 billion by 2035.
The air ambulance services market is expected to grow at a 12.3% CAGR between 2025 and 2035.
The key product types in air ambulance services market are rotary-wing and fixed-wing.
In terms of service model, hospital-based segment to command 57.8% share in the air ambulance services market in 2025.


Our Research Products

The "Full Research Suite" delivers actionable market intel, deep dives on markets or technologies, so clients act faster, cut risk, and unlock growth.

The Leaderboard benchmarks and ranks top vendors, classifying them as Established Leaders, Leading Challengers, or Disruptors & Challengers.

Locates where complements amplify value and substitutes erode it, forecasting net impact by horizon

We deliver granular, decision-grade intel: market sizing, 5-year forecasts, pricing, adoption, usage, revenue, and operational KPIs—plus competitor tracking, regulation, and value chains—across 60 countries broadly.

Spot the shifts before they hit your P&L. We track inflection points, adoption curves, pricing moves, and ecosystem plays to show where demand is heading, why it is changing, and what to do next across high-growth markets and disruptive tech

Real-time reads of user behavior. We track shifting priorities, perceptions of today’s and next-gen services, and provider experience, then pace how fast tech moves from trial to adoption, blending buyer, consumer, and channel inputs with social signals (#WhySwitch, #UX).

Partner with our analyst team to build a custom report designed around your business priorities. From analysing market trends to assessing competitors or crafting bespoke datasets, we tailor insights to your needs.
Supplier Intelligence
Discovery & Profiling
Capacity & Footprint
Performance & Risk
Compliance & Governance
Commercial Readiness
Who Supplies Whom
Scorecards & Shortlists
Playbooks & Docs
Category Intelligence
Definition & Scope
Demand & Use Cases
Cost Drivers
Market Structure
Supply Chain Map
Trade & Policy
Operating Norms
Deliverables
Buyer Intelligence
Account Basics
Spend & Scope
Procurement Model
Vendor Requirements
Terms & Policies
Entry Strategy
Pain Points & Triggers
Outputs
Pricing Analysis
Benchmarks
Trends
Should-Cost
Indexation
Landed Cost
Commercial Terms
Deliverables
Brand Analysis
Positioning & Value Prop
Share & Presence
Customer Evidence
Go-to-Market
Digital & Reputation
Compliance & Trust
KPIs & Gaps
Outputs
Full Research Suite comprises of:
Market outlook & trends analysis
Interviews & case studies
Strategic recommendations
Vendor profiles & capabilities analysis
5-year forecasts
8 regions and 60+ country-level data splits
Market segment data splits
12 months of continuous data updates
DELIVERED AS:
PDF EXCEL ONLINE
Ambulance Services Market
Dairy Testing Services Market Analysis - Size, Share, & Forecast Outlook 2025 to 2035
Airline A-la-carte Services Market Analysis by Product Type, Carrier Type and Region from 2025 to 2035
Global On-Demand Repair Services Market Analysis Size and Share Forecast Outlook 2025 to 2035
Foundation Repair Services Market Outlook from 2025 to 2035
Airborne Molecular Contamination Control Services Market Forecast and Outlook 2025 to 2035
Automotive Repair & Maintenance Services Market Growth - Trends & Forecast 2025 to 2035
United States & Canada Hair Salon Services Market Analysis by Growth, Trends and Forecast from 2025 to 2035
United States & Canada Foundation Repair Services Market Analysis by Growth, Trends and Forecast from 2025 to 2035
Air Fryer Paper Liners Market Size and Share Forecast Outlook 2025 to 2035
Air Struts Market Size and Share Forecast Outlook 2025 to 2035
Airless Paint Spray System Market Size and Share Forecast Outlook 2025 to 2035
Air Caster Skids System Market Size and Share Forecast Outlook 2025 to 2035
Airflow Balancer Market Size and Share Forecast Outlook 2025 to 2035
Aircraft Cabin Environment Sensor Market Forecast and Outlook 2025 to 2035
Aircraft Flight Control System Market Size and Share Forecast Outlook 2025 to 2035
Airborne Radar Market Size and Share Forecast Outlook 2025 to 2035
Aircraft Electric Motor Market Forecast Outlook 2025 to 2035
Airport Ground Transportation Market Forecast and Outlook 2025 to 2035
Airless Sprayer Accessories Market Size and Share Forecast Outlook 2025 to 2035

Thank you!
You will receive an email from our Business Development Manager. Please be sure to check your SPAM/JUNK folder too.
Chat With
MaRIA