Air Classifying Mill Market
Air Classifying Mills are the Major Grinds of the Food & Beverage, as well as Pharmaceutical Industries! Know more trends.
Air Classifying Mill Market By Type, Application, Sales Channel & Region | Forecast 2023 to 2033
Air Classifying Mill Market Outlook (2023 to 2033)
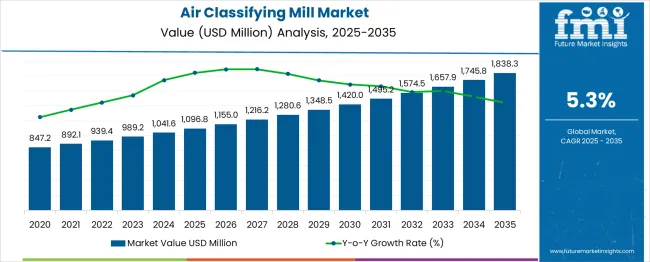
According to Future Market Insights research, during the projected forecast period, the Air Classifying Mill market is anticipated to grow at a CAGR of 5.3%. The market value is expected to increase from USD 989.2 million in 2023 to USD 1,657.9 million by 2033. At the end of 2022, the Air Classifying Mill market had a value of USD 939.4 million, and in 2023, it is anticipated to rise by 3.8% Y-o-Y.
An air-classifying mill is a type of impact mill that uses airflow to separate particles by size and grinds them by collision. The mill consists of a grinding chamber and an airstream classifier. Particles are fed into the chamber and ground by collision with the grinding media. The particles are then transported to the classifier where they are separated by size. The coarse particles are returned to the chamber for further grinding while the fine particles are discharged from the mill.
The air classifying mill is an efficient, versatile tool for fine-grinding applications. It can be used in a wide range of industries, including pharmaceuticals, food processing, and minerals processing.
Key players emphasize the durability, reliability, and precision of air classifying mills. These features make them one of the most popular industrial workhorses, and one of the most versatile types of size-reduction equipment in the market. It is designed to grind and classify a wide range of materials such as chemicals, food, pharmaceutical, and mineral materials - down to D97 < 20 µm. These factors are estimated to drive the demand for air classifying mills. Key players ensure that laboratory (1 HP) to production (600 HP) models are available. These mills are highly in demand as their production capacities range from 0.5 lb/hr to several tons per hour. Moreover, they have excellent top-size control while producing a narrow particle size distribution. Pressure shock-resistant (PSR) models are made available by top market players for their revered end users. In addition, they are also available in steel, stainless steel, and specialty alloys with titanium components. These mills are able to operate with heated air for flash drying which surges the adoption of air classifying mills.
Primarily, the basic design of these mills is the impact size reduction that is merged with an internal dynamic classifier which controls the outlet (product) particle size via recirculating the coarse particles back into the grinding zone. There are seven main aspects that govern particle size distribution for air classifying mills. The rotor type and speed combined with the linear and hammer count affect the production of fines. The separator type and speed affect the top size of the product when varied. Furthermore, the airflow determines the throughput as well as the top size and fines generation. These factors are expected to expand the global air classifying mill market growth. A machine can be configured to process just about any material that is below MOH’s hardness of 5, with endless available options.
Most of these mills are ideal for grinding heat-sensitive and extremely cohesive material efficiently. They are able to grind, classify, and convey in one step. Additionally, the temperature in the grinding chamber is generally lower than that in other types of fine grinding equipment. This condition offers a primary advantage in the processing of materials with low melting points. Prior to the development of air classifying mills, materials had to be dried and de-agglomerated in two separate options. This surged the adoption of air classifying mills since this type of solution is ideal for streamlining both these operations into one continuous process. Moreover, the feed design of these mills introduces products from under the main rotor, ensuring that 100% of the feed material comes in contact with the impact rotor for optimal grinding efficiency. Furthermore, the machine can also be used for grit reduction applications when tight particle top size control is required, such as in the case of Carbon Black, Iron oxide, and Clays. All these factors are estimated to drive product demand and expand the global air classifying mills market size.
Market Size Value in 2023 |
USD 989.2 million |
Market Forecast Value in 2033 |
USD 1,657.9 million |
Global Growth Rate (2023 to 2033) |
5.3% CAGR |
Forecast Period |
2023 to 2033 |
USA market share of Air Classifying Mill |
32.8% |
Let us know your requirement to get
100% FREE customization
Air Classifying Mill Market Historical Outlook vs. Future Projections
Air Classifying Mill Market Historical Outlook shows that the market's value expanded from USD 809.2 million in 2018 to USD 939.4 million in 2022. The observed CAGR (2018 to 2022) is 3.8%.
The Air Classifying Mill market is growing rapidly as the demand for these products increases. The main drivers of this growth are the increasing demand for air classification in industries such as food processing, pharmaceuticals, and cosmetics. Additionally, the Air Classifying Mill market is also driven by the rising awareness of the benefits of these products among consumers.
Air Classifying Mill market value climbed from USD 989.2 million in 2023 to USD 1,657.9 million in 2033 according to future projections. 5.3% CAGR is predicted to occur between 2023 and 2033.
Comparative Analysis of Adjacent Markets
Air Classifying Mill Market:
Attributes |
Air Classifying Mill Market |
CAGR (2023 to 2033) |
5.3% |
Market Value (2033) |
US$ 1,657.9 million |
Growth Factor |
Grinding and processing various materials such as chemicals, food, etc. for different industries. |
Opportunity |
Manufacturers are planning to incorporate advanced technologies such as AI, IoT, robotics, etc. owing to the growing demand from various industries. |
Restraints |
A lack of knowledge regarding the use of these mills may cause major accidents or injuries. |
Variable Air Volume System Market:
Attributes |
Variable Air Volume System Market |
CAGR (2023 to 2033) |
7% |
Market Value (2033) |
US$ 15.5 billion |
Growth Factor |
Growing concerns regarding sustainability and energy consumption in residential and commercial sectors. |
Opportunity |
Surging demand for single-zone variable air volume systems, as they offer high energy efficiency. |
Restraints |
Complexity in the design of high-volume variable air volume systems involves high capital investments, which may decline the demand. |
Membrane Air Dryers Market:
Attributes |
Membrane Air Dryers Market |
CAGR (2023 to 2033) |
6.5% |
Market Value (2033) |
US$ 1,200 million |
Growth Factor |
These filtration systems provide a unique and efficient way to cut various contaminants from compressed air systems. |
Opportunity |
Increasing adoption of these air dryers across industries such as medical, telecommunication, and automotive amongst others. |
Restraints |
The dryers are highly expensive due to their complex processes and the need for thousands of tiny hollow polymer fibers for fabrication. |
Find your sweet spots for generating winning opportunities in this market.
Talk to AnalystCategory Wise Insights
How Air Classifying Mills are segmented by their type?
- Horizontal - By Product Type
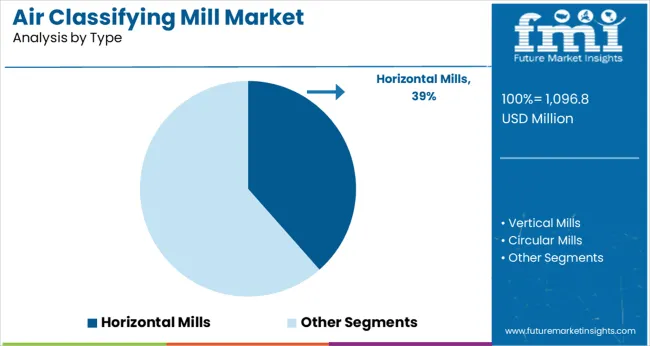
- Horizontal air classifying mills are the most popular type of mill used in the industry. They are able to handle a wide range of particle sizes and can be used for both wet and dry grinding applications. The vertical air classifying mills are less popular but offer some advantages over the horizontal mills. They are better suited for handling very fine particles and can be used for both wet and dry grinding applications.
- The circular air classifying mills are the least popular type of mill but offer some unique advantages. They are best suited for handling very fine particles and can be used for both wet and dry grinding applications.
What is the use of Air Classifying Mills in the food processing industry?
- Food Processing Industry - By End User Industry Type
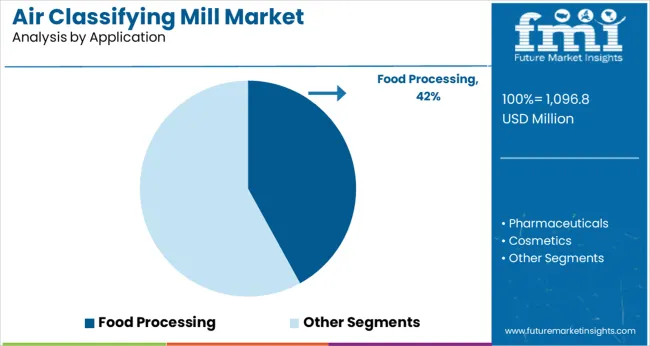
- An Air Classifying Mill is a type of mill that can be used in the food processing industry. It uses air to classify particles by size. This type of mill is usually used to process materials that are difficult to break down, such as spices or grains.
- The Air Classifying Mill can be used to grind down ingredients to a very fine powder. This powder can then be used in various food applications. For example, the powder can be used as a flour substitute in baking recipes. The Air Classifying Mill can also be used to grind spices for use in cooking.
- The Air Classifying Mill is a versatile piece of equipment that can be used in many different industries, not just the food processing industry. It is a valuable tool for any business that needs to process difficult-to-grind materials quickly and efficiently.
Country-Wise Analysis
How are Air Classifying Mills Profitable in the USA?
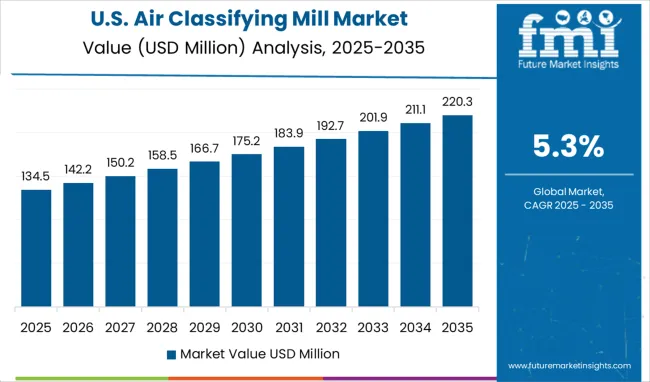
North America is the leading air classifying mill market, growing at a CAGR of 32.8%. This is attributed to the increasing demand for these mills from the manufacturing and processing industries. Moreover, the air classifying mill market is also being driven by the rising number of applications for these mills in various industries.
Key players in the USA provide mills that operate using the combination of two-stage close-circuit grinding/milling with an inter-stage air classifier all in one convenient unit. In addition, the internal air classifier continuously recirculates particles that are larger than desired back into the grinding zone ensuring an optimal final product particle size. This is likely to aid in the strong-paced growth of the air classifying mill market share in the coming years.
There are several features that are offered by the key manufacturers of air classifying mills in this region, that are remarkably favorable for end users. For instance, the mills are capable to grind challenging materials. Moreover, narrow particle size distribution is made easy, which is also highly uniform. These mills are high in demand since they require minimal and quick maintenance.
End users in the USA require an air classifying mill that can be designed for grinding hygroscopic, heat sensitive, and explosive materials in inert gas/closed loop systems with dry chilled air. Therefore, key players strive to offer these features with integrated grinding, classifying, conveying, and collecting operations for achieving ultra-fine grinding (up to 2 microns) depending upon the nature of the product. This is expected to drive the adoption of air classifying mills amongst American customers.
German manufacturers keep the demand of the food & beverage industry in mind!
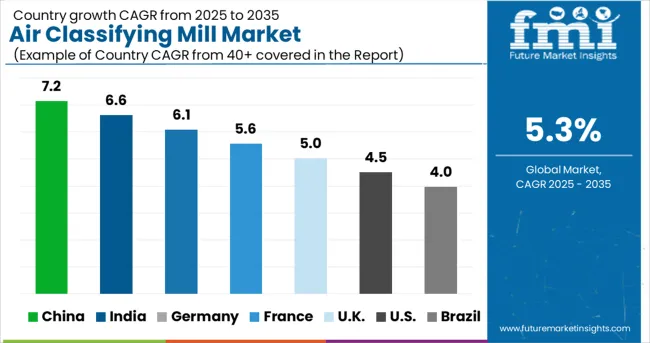
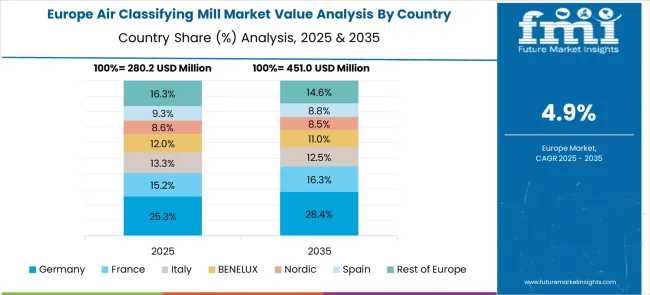
With a notable CAGR of 26.7%, Europe holds the second-largest share of the air classifying mill market, with Germany being the most profitable market. On the other hand, the United Kingdom holds a revenue share of 6% over the projection period. This is attributed to the growing demand for these mills in the food processing industry.
The demand for air classifying mills is rising in Germany, essentially owing to their use to grind various food products, such as spices, coffee beans, and grains. Moreover, they are also used in the pharmaceutical industry for grinding various active ingredients and excipients. This is likely to support the expansion of the global market size.
Increasing industrialization and urbanization in European countries are resulting in the increased demand for air classifying mills from various industries such as chemicals, minerals, and others. Furthermore, key players in Germany offer mills that can be operated with ambient air, hot air as well as dried and cooled air which covers a wide range of mineral applications.
Safety and proper mechanism - the main criteria for market players in China
The Asia Pacific is a lucrative air classifying mill market with China and India as the market leaders with revenue shares of 6.6% and 6.2%, respectively. The rapidly expanding market in this region is owing to the growing demand for these products in the region. It is essentially used in the food processing industry, as well as pharmaceutical and cosmetics industries.
China is primarily responsible for exporting machine components to key market players in developed countries. However, the country also benefits from the adoption of air classifying mills owing to its proliferating food and beverage industry. Additionally, the mills provided by the market players in this country are ideal for difficult-to-grind applications or narrow particle distribution curve requirements and offer simple maintenance, uniform particle distribution, a screen-less frame that prevents screen damage and wear.
Safety is always a first for key companies when it comes to air classifying mills so that they are suitable for beginners and accidents or injuries are reduced. Hence, the mills and fine grinders are equipped with an automatic door-locking device to prevent accidental access to the inside while the rotor is operating. In addition, a secondary inlet to provide additional air for an element of cooling is also equipped within these machines.
In India, one may find air classifying mills of exceptional quality at cost-effective prices!
India has one of the largest food and beverage and pharmaceutical industries in the world and requires the adoption of air classifying mills for grinding food and medicines. The market is growing at a rapid pace and the regional market players sometimes engage in collaborations with key market players in developed countries.
Key players manufacture and supply all types of air classifier mills with food grades of stainless steel material and are designed in accordance with various industrial standards. Moreover, they bring clients air classifying mills of exceptional quality at cost-effective prices. These are likely to contribute to global market growth.
The mills offered by the key players in the country are able to reject coarse material requiring further size reduction which occurs entirely inside the chamber by means of a positive material and air transport system. Furthermore, these mills offer great turbulence and high air volume ensures a minimum temperature increase facilitating the handling of heat-sensitive materials.

A unified Market Research Subscription Platform, built for today's disparate research needs.
Competitive Landscape
The Air Classifying Mill market is characterized by the presence of a large number of small and medium-sized enterprises. The leading players in the market are focused on expanding their product portfolios to cater to the needs of a wide range of customers. The key strategies adopted by the leading players in the Air Classifying Mill market include product innovation, mergers & acquisitions, and expansion into new geographies. The air classifying mill market is highly competitive with a large number of players.
Key players in the market include:
- Hosokawa Alpine - It designs and manufactures size reduction systems and powder processing solutions for the chemical, mineral, pharmaceutical, cosmetic, food, and plastic industries. The company specializes in coarse to ultra-fine grinding, classification, mixing, drying, containment, compaction, and analytical equipment.
- British Rema - It has a long heritage and deep roots in the Sheffield and Chesterfield areas and was originally spun out of the Sheffield steel maker and engineering group, Edgar Allen, in the early 1980s. The company has subsequently developed into a successful group of niche businesses, supplying products and technical services on a global basis to many growing industrial sectors such as aerospace, building products, fine chemicals, and fertilizers.
- NETZSCH - It is one of the world's leading companies in the field of processing dry products and is part of the Grinding & Dispersing division of the NETZSCH Group. Long-term experience, daily contact with customers, and consistent development work with more than 100 patents ensure technical competence and illustrate quality awareness.
These companies hold a significant share of the market owing to their strong brand presence and product offerings.
Air Classifying Mill Market Report Scope
Attribute |
Details |
Forecast Period |
2023 to 2033 |
Historical Data Available for |
2018 to 2022 |
Market Analysis |
USD million for Value and Units for Volume |
Key Regions Covered |
|
Key Countries Covered |
|
Key Segments Covered |
|
Key Companies Profiled |
|
Report Coverage |
Strategic Growth Initiatives, DROT Analysis, Market Forecast, Company Share Analysis, Market Dynamics and Challenges, and Competitive Landscape. |
Customization & Pricing |
Available upon Request |
Segmentation of Air Classifying Mill Market
Segmentation by Type:
- Horizontal Mills
- Vertical Mills
- Circular Mills
Segmentation by Application:
- Food Processing
- Pharmaceuticals
- Cosmetics
- Others
Segmentation by Sales Channel:
- Online
- Offline
Segmentation by Region:
- North America
- Europe
- Asia Pacific
- Latin America
- MEA
- RoW
Frequently Asked Questions
What is the market size of Air Classifying Mill?
The global Air Classifying Mill market will reach a valuation of USD 989.2 Million by the end of 2023.
What is the USA, Air Classifying Mill Market Outlook?
The USA Air Classifying Mill Market is contributing 32.8% of the total market share which is valued at around USD 324.5 million.
Which are the major countries driving demand for Air Classifying Mill Market?
The USA, Canada, Mexico, Argentina, Brazil, Germany, The United Kingdom, France, Italy, Russia, Spain China, Japan, India, Indonesia, South Korea, and Australia are the major countries driving demand for Air Classifying Mill Market.
What is the Germany, Air Classifying Mill Market Outlook?
The Germany Air Classifying Mill Market is contributing 26.7% of the total market share which values at USD 264.1 million.
Who are the top 5 players operating in the market?
• Hosokawa Alpine • British Rema • Hosokawa Micron • NETZSCH • CMS Above are the top 5 market players in the Air Classifying Mill industry.
What is the contribution of Japan in Air Classifying Mill market?
The Japan Air Classifying Mill market contribution is 6.7% of total market share.
At What Rate Will Air Classifying Mill market grow in India?
The India Air Classifying Mill market will grow at 6.2% CAGR between 2023 and 2033.
What is the demand outlook forecast for the Air Classifying Mill market?
The global Air Classifying Mill market is forecasted to surpass USD 1,657.9 Million by the end of 2033.
Table of Content
1. Executive Summary 1.1. Global Market Outlook 1.2. Demand-side Trends 1.3. Supply-side Trends 1.4. Technology Roadmap Analysis 1.5. Analysis and Recommendations 2. Market Overview 2.1. Market Coverage / Taxonomy 2.2. Market Definition / Scope / Limitations 3. Market Background 3.1. Market Dynamics 3.1.1. Drivers 3.1.2. Restraints 3.1.3. Opportunity 3.1.4. Trends 3.2. Scenario Forecast 3.2.1. Demand in Optimistic Scenario 3.2.2. Demand in Likely Scenario 3.2.3. Demand in Conservative Scenario 3.3. Product launches & Recent Developments 3.4. Product Life Cycle Analysis 3.5. Value Chain Analysis 3.5.1. Supply Side Participants and their Roles 3.5.1.1. Producers 3.5.1.2. Mid-Level Participants (Traders/ Agents/ Brokers) 3.5.1.3. Wholesalers and Distributors 3.5.2. % of Operating Margin Analysis 3.5.3. List of Raw Material Suppliers 3.5.4. List of Existing and Potential Buyer’s 3.6. Global Market - Pricing Analysis 3.6.1. Price Point Assessment by Region 3.6.2. Price Point Assessment by Product Type 3.6.3. Price Forecast till 2033 3.6.4. Factors affecting pricing 3.7. Forecast Factors - Relevance & Impact 3.8. PESTLE and Porter’s Analysis 3.9. Regulatory Landscape 3.9.1. Packaging & Labelling Regulations 3.9.2. Certifications and Certifying Agency Overview 3.9.3. Import/Export Policies 3.10. Regional Parent Market Outlook 3.11. Production and Consumption Statistics 3.12. Import and Export Statistics 3.13. Consumers Survey Analysis 3.14. Macro-Economic Factors 3.15. Product Claims & Nutritional Information Scan by Buyers 4. Global Market Analysis 2018 to 2022 and Forecast, 2023 to 2033 4.1. Historical Market Size Value (US$ million) & Volume (MT) Analysis, 2018 to 2022 4.2. Current and Future Market Size Value (US$ million) & Volume (MT) Projections, 2023 to 2033 4.2.1. Y-o-Y Growth Trend Analysis 4.2.2. Absolute $ Opportunity Analysis 5. Global Market Analysis 2018 to 2022 and Forecast 2023 to 2033, By Type 5.1. Introduction / Key Findings 5.2. Historical Market Size Value (US$ million) & Volume (MT) Analysis By Type, 2018 to 2022 5.3. Current and Future Market Size Value (US$ million) & Volume (MT) Analysis and Forecast By Type, 2023 to 2033 5.3.1. Horizontal Mills 5.3.2. Vertical Mills 5.3.3. Circular Mills 5.4. Y-o-Y Growth Trend Analysis By Type, 2018 to 2022 5.5. Absolute $ Opportunity Analysis By Type, 2023 to 2033 6. Global Market Analysis 2018 to 2022 and Forecast 2023 to 2033, By Application 6.1. Introduction / Key Findings 6.2. Historical Market Size Value (US$ million) & Volume (MT) Analysis By Application, 2018 to 2022 6.3. Current and Future Market Size Value (US$ million) & Volume (MT) Analysis and Forecast By Application, 2023 to 2033 6.3.1. Food Processing 6.3.2. Pharmaceuticals 6.3.3. Cosmetics 6.4. Y-o-Y Growth Trend Analysis By Application, 2018 to 2022 6.5. Absolute $ Opportunity Analysis By Application, 2023 to 2033 7. Global Market Analysis 2018 to 2022 and Forecast 2023 to 2033, By Region 7.1. Introduction 7.2. Historical Market Size Value (US$ million) & Volume (MT) Analysis By Region, 2018 to 2022 7.3. Current Market Size Value (US$ million) & Volume (MT) Analysis and Forecast By Region, 2023 to 2033 7.3.1. North America 7.3.2. Latin America 7.3.3. Europe 7.3.4. East Asia 7.3.5. South Asia 7.3.6. Oceania 7.3.7. Middle East and Africa (MEA) 7.4. Market Attractiveness Analysis By Region 8. North America Market Analysis 2018 to 2022 and Forecast 2023 to 2033, By Country 8.1. Historical Market Size Value (US$ million) & Volume (MT) Trend Analysis By Market Taxonomy, 2018 to 2022 8.2. Market Size Value (US$ million) & Volume (MT) Forecast By Market Taxonomy, 2023 to 2033 8.2.1. By Country 8.2.1.1. USA 8.2.1.2. Canada 8.2.2. By Type 8.2.3. By Application 8.3. Market Attractiveness Analysis 8.3.1. By Country 8.3.2. By Type 8.3.3. By Application 8.4. Key Takeaways 9. Latin America Market Analysis 2018 to 2022 and Forecast 2023 to 2033, By Country 9.1. Historical Market Size Value (US$ million) & Volume (MT) Trend Analysis By Market Taxonomy, 2018 to 2022 9.2. Market Size Value (US$ million) & Volume (MT) Forecast By Market Taxonomy, 2023 to 2033 9.2.1. By Country 9.2.1.1. Brazil 9.2.1.2. Mexico 9.2.1.3. Argentina 9.2.1.4. Chile 9.2.1.5. Peru 9.2.1.6. Rest of Latin America 9.2.2. By Type 9.2.3. By Application 9.3. Market Attractiveness Analysis 9.3.1. By Country 9.3.2. By Type 9.3.3. By Application 9.4. Key Takeaways 10. Europe Market Analysis 2018 to 2022 and Forecast 2023 to 2033, By Country 10.1. Historical Market Size Value (US$ million) & Volume (MT) Trend Analysis By Market Taxonomy, 2018 to 2022 10.2. Market Size Value (US$ million) & Volume (MT) Forecast By Market Taxonomy, 2023 to 2033 10.2.1. By Country 10.2.1.1. Germany 10.2.1.2. Italy 10.2.1.3. France 10.2.1.4. The United Kingdom 10.2.1.5. Spain 10.2.1.6. Russia 10.2.1.7. BENELUX 10.2.1.8. Poland 10.2.1.9. Nordic Countries 10.2.1.10. Rest of Europe 10.2.2. By Type 10.2.3. By Application 10.3. Market Attractiveness Analysis 10.3.1. By Country 10.3.2. By Type 10.3.3. By Application 10.4. Key Takeaways 11. East Asia Market Analysis 2018 to 2022 and Forecast 2023 to 2033, By Country 11.1. Historical Market Size Value (US$ million) & Volume (MT) Trend Analysis By Market Taxonomy, 2018 to 2022 11.2. Market Size Value (US$ million) & Volume (MT) Forecast By Market Taxonomy, 2023 to 2033 11.2.1. By Country 11.2.1.1. China 11.2.1.2. Japan 11.2.1.3. South Korea 11.2.2. By Type 11.2.3. By Application 11.3. Market Attractiveness Analysis 11.3.1. By Country 11.3.2. By Type 11.3.3. By Application 11.4. Key Takeaways 12. South Asia Market Analysis 2018 to 2022 and Forecast 2023 to 2033, By Country 12.1. Historical Market Size Value (US$ million) & Volume (MT) Trend Analysis By Market Taxonomy, 2018 to 2022 12.2. Market Size Value (US$ million) & Volume (MT) Forecast By Market Taxonomy, 2023 to 2033 12.2.1. By Country 12.2.1.1. India 12.2.1.2. Thailand 12.2.1.3. Malaysia 12.2.1.4. Indonesia 12.2.1.5. Singapore 12.2.1.6. Rest of South Asia 12.2.2. By Type 12.2.3. By Application 12.3. Market Attractiveness Analysis 12.3.1. By Country 12.3.2. By Type 12.3.3. By Application 12.4. Key Takeaways 13. Oceania Market Analysis 2018 to 2022 and Forecast 2023 to 2033, By Country 13.1. Historical Market Size Value (US$ million) & Volume (MT) Trend Analysis By Market Taxonomy, 2018 to 2022 13.2. Market Size Value (US$ million) & Volume (MT) Forecast By Market Taxonomy, 2023 to 2033 13.2.1. By Country 13.2.1.1. Australia 13.2.1.2. New Zealand 13.2.2. By Type 13.2.3. By Application 13.3. Market Attractiveness Analysis 13.3.1. By Country 13.3.2. By Type 13.3.3. By Application 13.4. Key Takeaways 14. MEA Market Analysis 2018 to 2022 and Forecast 2023 to 2033, By Country 14.1. Historical Market Size Value (US$ million) & Volume (MT) Trend Analysis By Market Taxonomy, 2018 to 2022 14.2. Market Size Value (US$ million) & Volume (MT) Forecast By Market Taxonomy, 2023 to 2033 14.2.1. By Country 14.2.1.1. GCC Countries 14.2.1.2. South Africa 14.2.1.3. Central Africa 14.2.1.4. North Africa 14.2.2. By Type 14.2.3. By Application 14.3. Market Attractiveness Analysis 14.3.1. By Country 14.3.2. By Type 14.3.3. By Application 14.4. Key Takeaways 15. Key Countries Market Analysis 15.1. The USA 15.1.1. Pricing Analysis 15.1.2. Market Share Analysis, 2022 15.1.2.1. By Type 15.1.2.2. By Application 15.2. Canada 15.2.1. Pricing Analysis 15.2.2. Market Share Analysis, 2022 15.2.2.1. By Type 15.2.2.2. By Application 15.3. Brazil 15.3.1. Pricing Analysis 15.3.2. Market Share Analysis, 2022 15.3.2.1. By Type 15.3.2.2. By Application 15.4. Mexico 15.4.1. Pricing Analysis 15.4.2. Market Share Analysis, 2022 15.4.2.1. By Type 15.4.2.2. By Application 15.5. Argentina 15.5.1. Pricing Analysis 15.5.2. Market Share Analysis, 2022 15.5.2.1. By Type 15.5.2.2. By Application 15.6. Chile 15.6.1. Pricing Analysis 15.6.2. Market Share Analysis, 2022 15.6.2.1. By Type 15.6.2.2. By Application 15.7. Peru 15.7.1. Pricing Analysis 15.7.2. Market Share Analysis, 2022 15.7.2.1. By Type 15.7.2.2. By Application 15.8. Germany 15.8.1. Pricing Analysis 15.8.2. Market Share Analysis, 2022 15.8.2.1. By Type 15.8.2.2. By Application 15.9. Italy 15.9.1. Pricing Analysis 15.9.2. Market Share Analysis, 2022 15.9.2.1. By Type 15.9.2.2. By Application 15.10. France 15.10.1. Pricing Analysis 15.10.2. Market Share Analysis, 2022 15.10.2.1. By Type 15.10.2.2. By Application 15.11. Spain 15.11.1. Pricing Analysis 15.11.2. Market Share Analysis, 2022 15.11.2.1. By Type 15.11.2.2. By Application 15.12. The United Kingdom 15.12.1. Pricing Analysis 15.12.2. Market Share Analysis, 2022 15.12.2.1. By Type 15.12.2.2. By Application 15.13. Russia 15.13.1. Pricing Analysis 15.13.2. Market Share Analysis, 2022 15.13.2.1. By Type 15.13.2.2. By Application 15.14. Poland 15.14.1. Pricing Analysis 15.14.2. Market Share Analysis, 2022 15.14.2.1. By Type 15.14.2.2. By Application 15.15. BENELUX 15.15.1. Pricing Analysis 15.15.2. Market Share Analysis, 2022 15.15.2.1. By Type 15.15.2.2. By Application 15.16. Nordic Countries 15.16.1. Pricing Analysis 15.16.2. Market Share Analysis, 2022 15.16.2.1. By Type 15.16.2.2. By Application 15.17. China 15.17.1. Pricing Analysis 15.17.2. Market Share Analysis, 2022 15.17.2.1. By Type 15.17.2.2. By Application 15.18. Japan 15.18.1. Pricing Analysis 15.18.2. Market Share Analysis, 2022 15.18.2.1. By Type 15.18.2.2. By Application 15.19. South Korea 15.19.1. Pricing Analysis 15.19.2. Market Share Analysis, 2022 15.19.2.1. By Type 15.19.2.2. By Application 15.20. India 15.20.1. Pricing Analysis 15.20.2. Market Share Analysis, 2022 15.20.2.1. By Type 15.20.2.2. By Application 15.21. Thailand 15.21.1. Pricing Analysis 15.21.2. Market Share Analysis, 2022 15.21.2.1. By Type 15.21.2.2. By Application 15.22. Indonesia 15.22.1. Pricing Analysis 15.22.2. Market Share Analysis, 2022 15.22.2.1. By Type 15.22.2.2. By Application 15.23. Malaysia 15.23.1. Pricing Analysis 15.23.2. Market Share Analysis, 2022 15.23.2.1. By Type 15.23.2.2. By Application 15.24. Singapore 15.24.1. Pricing Analysis 15.24.2. Market Share Analysis, 2022 15.24.2.1. By Type 15.24.2.2. By Application 15.25. Australia 15.25.1. Pricing Analysis 15.25.2. Market Share Analysis, 2022 15.25.2.1. By Type 15.25.2.2. By Application 15.26. New Zealand 15.26.1. Pricing Analysis 15.26.2. Market Share Analysis, 2022 15.26.2.1. By Type 15.26.2.2. By Application 15.27. GCC Countries 15.27.1. Pricing Analysis 15.27.2. Market Share Analysis, 2022 15.27.2.1. By Type 15.27.2.2. By Application 15.28. South Africa 15.28.1. Pricing Analysis 15.28.2. Market Share Analysis, 2022 15.28.2.1. By Type 15.28.2.2. By Application 15.29. North Africa 15.29.1. Pricing Analysis 15.29.2. Market Share Analysis, 2022 15.29.2.1. By Type 15.29.2.2. By Application 15.30. Central Africa 15.30.1. Pricing Analysis 15.30.2. Market Share Analysis, 2022 15.30.2.1. By Type 15.30.2.2. By Application 16. Market Structure Analysis 16.1. Competition Dashboard 16.2. Competition Benchmarking 16.3. Market Share Analysis of Top Players 16.3.1. By Regional 16.3.2. By Type 16.3.3. By Application 17. Competition Analysis 17.1. Competition Deep Dive 17.1.1. Hosokawa Alpine 17.1.1.1. Overview 17.1.1.2. Product Portfolio 17.1.1.3. Profitability by Market Segments (Type /Application/Region) 17.1.1.4. Sales Footprint 17.1.1.5. Strategy Overview 17.1.1.5.1. Marketing Strategy 17.1.1.5.2. Product Strategy 17.1.1.5.3. Channel Strategy 17.1.2. British Rema 17.1.2.1. Overview 17.1.2.2. Product Portfolio 17.1.2.3. Profitability by Market Segments (Type /Application/Region) 17.1.2.4. Sales Footprint 17.1.2.5. Strategy Overview 17.1.2.5.1. Marketing Strategy 17.1.2.5.2. Product Strategy 17.1.2.5.3. Channel Strategy 17.1.3. Hosokawa Micron 17.1.3.1. Overview 17.1.3.2. Product Portfolio 17.1.3.3. Profitability by Market Segments (Type /Application/Region) 17.1.3.4. Sales Footprint 17.1.3.5. Strategy Overview 17.1.3.5.1. Marketing Strategy 17.1.3.5.2. Product Strategy 17.1.3.5.3. Channel Strategy 17.1.4. NETZSCH 17.1.4.1. Overview 17.1.4.2. Product Portfolio 17.1.4.3. Profitability by Market Segments (Type /Application/Region) 17.1.4.4. Sales Footprint 17.1.4.5. Strategy Overview 17.1.4.5.1. Marketing Strategy 17.1.4.5.2. Product Strategy 17.1.4.5.3. Channel Strategy 17.1.5. CMS 17.1.5.1. Overview 17.1.5.2. Product Portfolio 17.1.5.3. Profitability by Market Segments (Type /Application/Region) 17.1.5.4. Sales Footprint 17.1.5.5. Strategy Overview 17.1.5.5.1. Marketing Strategy 17.1.5.5.2. Product Strategy 17.1.5.5.3. Channel Strategy 17.1.6. RIECO 17.1.6.1. Overview 17.1.6.2. Product Portfolio 17.1.6.3. Profitability by Market Segments (Type /Application/Region) 17.1.6.4. Sales Footprint 17.1.6.5. Strategy Overview 17.1.6.5.1. Marketing Strategy 17.1.6.5.2. Product Strategy 17.1.6.5.3. Channel Strategy 17.1.7. Ultra Febtech 17.1.7.1. Overview 17.1.7.2. Product Portfolio 17.1.7.3. Profitability by Market Segments (Type /Application/Region) 17.1.7.4. Sales Footprint 17.1.7.5. Strategy Overview 17.1.7.5.1. Marketing Strategy 17.1.7.5.2. Product Strategy 17.1.7.5.3. Channel Strategy 17.1.8. Kaps Engineers 17.1.8.1. Overview 17.1.8.2. Product Portfolio 17.1.8.3. Profitability by Market Segments (Type /Application/Region) 17.1.8.4. Sales Footprint 17.1.8.5. Strategy Overview 17.1.8.5.1. Marketing Strategy 17.1.8.5.2. Product Strategy 17.1.8.5.3. Channel Strategy 17.1.9. NSI EQUIPMENTS (P)LTD 17.1.9.1. Overview 17.1.9.2. Product Portfolio 17.1.9.3. Profitability by Market Segments (Type /Application/Region) 17.1.9.4. Sales Footprint 17.1.9.5. Strategy Overview 17.1.9.5.1. Marketing Strategy 17.1.9.5.2. Product Strategy 17.1.9.5.3. Channel Strategy 17.1.10. Kemutec 17.1.10.1. Overview 17.1.10.2. Product Portfolio 17.1.10.3. Profitability by Market Segments (Type /Application/Region) 17.1.10.4. Sales Footprint 17.1.10.5. Strategy Overview 17.1.10.5.1. Marketing Strategy 17.1.10.5.2. Product Strategy 17.1.10.5.3. Channel Strategy 17.1.11. BulkInside 17.1.11.1. Overview 17.1.11.2. Product Portfolio 17.1.11.3. Profitability by Market Segments (Type /Application/Region) 17.1.11.4. Sales Footprint 17.1.11.5. Strategy Overview 17.1.11.5.1. Marketing Strategy 17.1.11.5.2. Product Strategy 17.1.11.5.3. Channel Strategy 17.1.12. Yinda Machinery 17.1.12.1. Overview 17.1.12.2. Product Portfolio 17.1.12.3. Profitability by Market Segments (Type /Application/Region) 17.1.12.4. Sales Footprint 17.1.12.5. Strategy Overview 17.1.12.5.1. Marketing Strategy 17.1.12.5.2. Product Strategy 17.1.12.5.3. Channel Strategy 17.1.13. Clarion Engineers & Tech LLP 17.1.13.1. Overview 17.1.13.2. Product Portfolio 17.1.13.3. Profitability by Market Segments (Type /Application/Region) 17.1.13.4. Sales Footprint 17.1.13.5. Strategy Overview 17.1.13.5.1. Marketing Strategy 17.1.13.5.2. Product Strategy 17.1.13.5.3. Channel Strategy 17.1.14. Innovative Fab 17.1.14.1. Overview 17.1.14.2. Product Portfolio 17.1.14.3. Profitability by Market Segments (Type /Application/Region) 17.1.14.4. Sales Footprint 17.1.14.5. Strategy Overview 17.1.14.5.1. Marketing Strategy 17.1.14.5.2. Product Strategy 17.1.14.5.3. Channel Strategy 18. Assumptions & Acronyms Used 19. Research Methodology
Let us know your requirement to get
100% FREE customization
List of Tables
Table 1: Global Market Value (US$ million) Forecast by Region, 2018 to 2033 Table 2: Global Market Volume (MT) Forecast by Region, 2018 to 2033 Table 3: Global Market Value (US$ million) Forecast by Type, 2018 to 2033 Table 4: Global Market Volume (MT) Forecast by Type, 2018 to 2033 Table 5: Global Market Value (US$ million) Forecast by Application, 2018 to 2033 Table 6: Global Market Volume (MT) Forecast by Application, 2018 to 2033 Table 7: North America Market Value (US$ million) Forecast by Country, 2018 to 2033 Table 8: North America Market Volume (MT) Forecast by Country, 2018 to 2033 Table 9: North America Market Value (US$ million) Forecast by Type, 2018 to 2033 Table 10: North America Market Volume (MT) Forecast by Type, 2018 to 2033 Table 11: North America Market Value (US$ million) Forecast by Application, 2018 to 2033 Table 12: North America Market Volume (MT) Forecast by Application, 2018 to 2033 Table 13: Latin America Market Value (US$ million) Forecast by Country, 2018 to 2033 Table 14: Latin America Market Volume (MT) Forecast by Country, 2018 to 2033 Table 15: Latin America Market Value (US$ million) Forecast by Type, 2018 to 2033 Table 16: Latin America Market Volume (MT) Forecast by Type, 2018 to 2033 Table 17: Latin America Market Value (US$ million) Forecast by Application, 2018 to 2033 Table 18: Latin America Market Volume (MT) Forecast by Application, 2018 to 2033 Table 19: Europe Market Value (US$ million) Forecast by Country, 2018 to 2033 Table 20: Europe Market Volume (MT) Forecast by Country, 2018 to 2033 Table 21: Europe Market Value (US$ million) Forecast by Type, 2018 to 2033 Table 22: Europe Market Volume (MT) Forecast by Type, 2018 to 2033 Table 23: Europe Market Value (US$ million) Forecast by Application, 2018 to 2033 Table 24: Europe Market Volume (MT) Forecast by Application, 2018 to 2033 Table 25: East Asia Market Value (US$ million) Forecast by Country, 2018 to 2033 Table 26: East Asia Market Volume (MT) Forecast by Country, 2018 to 2033 Table 27: East Asia Market Value (US$ million) Forecast by Type, 2018 to 2033 Table 28: East Asia Market Volume (MT) Forecast by Type, 2018 to 2033 Table 29: East Asia Market Value (US$ million) Forecast by Application, 2018 to 2033 Table 30: East Asia Market Volume (MT) Forecast by Application, 2018 to 2033 Table 31: South Asia Market Value (US$ million) Forecast by Country, 2018 to 2033 Table 32: South Asia Market Volume (MT) Forecast by Country, 2018 to 2033 Table 33: South Asia Market Value (US$ million) Forecast by Type, 2018 to 2033 Table 34: South Asia Market Volume (MT) Forecast by Type, 2018 to 2033 Table 35: South Asia Market Value (US$ million) Forecast by Application, 2018 to 2033 Table 36: South Asia Market Volume (MT) Forecast by Application, 2018 to 2033 Table 37: Oceania Market Value (US$ million) Forecast by Country, 2018 to 2033 Table 38: Oceania Market Volume (MT) Forecast by Country, 2018 to 2033 Table 39: Oceania Market Value (US$ million) Forecast by Type, 2018 to 2033 Table 40: Oceania Market Volume (MT) Forecast by Type, 2018 to 2033 Table 41: Oceania Market Value (US$ million) Forecast by Application, 2018 to 2033 Table 42: Oceania Market Volume (MT) Forecast by Application, 2018 to 2033 Table 43: MEA Market Value (US$ million) Forecast by Country, 2018 to 2033 Table 44: MEA Market Volume (MT) Forecast by Country, 2018 to 2033 Table 45: MEA Market Value (US$ million) Forecast by Type, 2018 to 2033 Table 46: MEA Market Volume (MT) Forecast by Type, 2018 to 2033 Table 47: MEA Market Value (US$ million) Forecast by Application, 2018 to 2033 Table 48: MEA Market Volume (MT) Forecast by Application, 2018 to 2033
Find your sweet spots for generating winning opportunities in this market.
Talk to AnalystList of Charts
Figure 1: Global Market Value (US$ million) by Type, 2023 to 2033 Figure 2: Global Market Value (US$ million) by Application, 2023 to 2033 Figure 3: Global Market Value (US$ million) by Region, 2023 to 2033 Figure 4: Global Market Value (US$ million) Analysis by Region, 2018 to 2033 Figure 5: Global Market Volume (MT) Analysis by Region, 2018 to 2033 Figure 6: Global Market Value Share (%) and BPS Analysis by Region, 2023 to 2033 Figure 7: Global Market Y-o-Y Growth (%) Projections by Region, 2023 to 2033 Figure 8: Global Market Value (US$ million) Analysis by Type, 2018 to 2033 Figure 9: Global Market Volume (MT) Analysis by Type, 2018 to 2033 Figure 10: Global Market Value Share (%) and BPS Analysis by Type, 2023 to 2033 Figure 11: Global Market Y-o-Y Growth (%) Projections by Type, 2023 to 2033 Figure 12: Global Market Value (US$ million) Analysis by Application, 2018 to 2033 Figure 13: Global Market Volume (MT) Analysis by Application, 2018 to 2033 Figure 14: Global Market Value Share (%) and BPS Analysis by Application, 2023 to 2033 Figure 15: Global Market Y-o-Y Growth (%) Projections by Application, 2023 to 2033 Figure 16: Global Market Attractiveness by Type, 2023 to 2033 Figure 17: Global Market Attractiveness by Application, 2023 to 2033 Figure 18: Global Market Attractiveness by Region, 2023 to 2033 Figure 19: North America Market Value (US$ million) by Type, 2023 to 2033 Figure 20: North America Market Value (US$ million) by Application, 2023 to 2033 Figure 21: North America Market Value (US$ million) by Country, 2023 to 2033 Figure 22: North America Market Value (US$ million) Analysis by Country, 2018 to 2033 Figure 23: North America Market Volume (MT) Analysis by Country, 2018 to 2033 Figure 24: North America Market Value Share (%) and BPS Analysis by Country, 2023 to 2033 Figure 25: North America Market Y-o-Y Growth (%) Projections by Country, 2023 to 2033 Figure 26: North America Market Value (US$ million) Analysis by Type, 2018 to 2033 Figure 27: North America Market Volume (MT) Analysis by Type, 2018 to 2033 Figure 28: North America Market Value Share (%) and BPS Analysis by Type, 2023 to 2033 Figure 29: North America Market Y-o-Y Growth (%) Projections by Type, 2023 to 2033 Figure 30: North America Market Value (US$ million) Analysis by Application, 2018 to 2033 Figure 31: North America Market Volume (MT) Analysis by Application, 2018 to 2033 Figure 32: North America Market Value Share (%) and BPS Analysis by Application, 2023 to 2033 Figure 33: North America Market Y-o-Y Growth (%) Projections by Application, 2023 to 2033 Figure 34: North America Market Attractiveness by Type, 2023 to 2033 Figure 35: North America Market Attractiveness by Application, 2023 to 2033 Figure 36: North America Market Attractiveness by Country, 2023 to 2033 Figure 37: Latin America Market Value (US$ million) by Type, 2023 to 2033 Figure 38: Latin America Market Value (US$ million) by Application, 2023 to 2033 Figure 39: Latin America Market Value (US$ million) by Country, 2023 to 2033 Figure 40: Latin America Market Value (US$ million) Analysis by Country, 2018 to 2033 Figure 41: Latin America Market Volume (MT) Analysis by Country, 2018 to 2033 Figure 42: Latin America Market Value Share (%) and BPS Analysis by Country, 2023 to 2033 Figure 43: Latin America Market Y-o-Y Growth (%) Projections by Country, 2023 to 2033 Figure 44: Latin America Market Value (US$ million) Analysis by Type, 2018 to 2033 Figure 45: Latin America Market Volume (MT) Analysis by Type, 2018 to 2033 Figure 46: Latin America Market Value Share (%) and BPS Analysis by Type, 2023 to 2033 Figure 47: Latin America Market Y-o-Y Growth (%) Projections by Type, 2023 to 2033 Figure 48: Latin America Market Value (US$ million) Analysis by Application, 2018 to 2033 Figure 49: Latin America Market Volume (MT) Analysis by Application, 2018 to 2033 Figure 50: Latin America Market Value Share (%) and BPS Analysis by Application, 2023 to 2033 Figure 51: Latin America Market Y-o-Y Growth (%) Projections by Application, 2023 to 2033 Figure 52: Latin America Market Attractiveness by Type, 2023 to 2033 Figure 53: Latin America Market Attractiveness by Application, 2023 to 2033 Figure 54: Latin America Market Attractiveness by Country, 2023 to 2033 Figure 55: Europe Market Value (US$ million) by Type, 2023 to 2033 Figure 56: Europe Market Value (US$ million) by Application, 2023 to 2033 Figure 57: Europe Market Value (US$ million) by Country, 2023 to 2033 Figure 58: Europe Market Value (US$ million) Analysis by Country, 2018 to 2033 Figure 59: Europe Market Volume (MT) Analysis by Country, 2018 to 2033 Figure 60: Europe Market Value Share (%) and BPS Analysis by Country, 2023 to 2033 Figure 61: Europe Market Y-o-Y Growth (%) Projections by Country, 2023 to 2033 Figure 62: Europe Market Value (US$ million) Analysis by Type, 2018 to 2033 Figure 63: Europe Market Volume (MT) Analysis by Type, 2018 to 2033 Figure 64: Europe Market Value Share (%) and BPS Analysis by Type, 2023 to 2033 Figure 65: Europe Market Y-o-Y Growth (%) Projections by Type, 2023 to 2033 Figure 66: Europe Market Value (US$ million) Analysis by Application, 2018 to 2033 Figure 67: Europe Market Volume (MT) Analysis by Application, 2018 to 2033 Figure 68: Europe Market Value Share (%) and BPS Analysis by Application, 2023 to 2033 Figure 69: Europe Market Y-o-Y Growth (%) Projections by Application, 2023 to 2033 Figure 70: Europe Market Attractiveness by Type, 2023 to 2033 Figure 71: Europe Market Attractiveness by Application, 2023 to 2033 Figure 72: Europe Market Attractiveness by Country, 2023 to 2033 Figure 73: East Asia Market Value (US$ million) by Type, 2023 to 2033 Figure 74: East Asia Market Value (US$ million) by Application, 2023 to 2033 Figure 75: East Asia Market Value (US$ million) by Country, 2023 to 2033 Figure 76: East Asia Market Value (US$ million) Analysis by Country, 2018 to 2033 Figure 77: East Asia Market Volume (MT) Analysis by Country, 2018 to 2033 Figure 78: East Asia Market Value Share (%) and BPS Analysis by Country, 2023 to 2033 Figure 79: East Asia Market Y-o-Y Growth (%) Projections by Country, 2023 to 2033 Figure 80: East Asia Market Value (US$ million) Analysis by Type, 2018 to 2033 Figure 81: East Asia Market Volume (MT) Analysis by Type, 2018 to 2033 Figure 82: East Asia Market Value Share (%) and BPS Analysis by Type, 2023 to 2033 Figure 83: East Asia Market Y-o-Y Growth (%) Projections by Type, 2023 to 2033 Figure 84: East Asia Market Value (US$ million) Analysis by Application, 2018 to 2033 Figure 85: East Asia Market Volume (MT) Analysis by Application, 2018 to 2033 Figure 86: East Asia Market Value Share (%) and BPS Analysis by Application, 2023 to 2033 Figure 87: East Asia Market Y-o-Y Growth (%) Projections by Application, 2023 to 2033 Figure 88: East Asia Market Attractiveness by Type, 2023 to 2033 Figure 89: East Asia Market Attractiveness by Application, 2023 to 2033 Figure 90: East Asia Market Attractiveness by Country, 2023 to 2033 Figure 91: South Asia Market Value (US$ million) by Type, 2023 to 2033 Figure 92: South Asia Market Value (US$ million) by Application, 2023 to 2033 Figure 93: South Asia Market Value (US$ million) by Country, 2023 to 2033 Figure 94: South Asia Market Value (US$ million) Analysis by Country, 2018 to 2033 Figure 95: South Asia Market Volume (MT) Analysis by Country, 2018 to 2033 Figure 96: South Asia Market Value Share (%) and BPS Analysis by Country, 2023 to 2033 Figure 97: South Asia Market Y-o-Y Growth (%) Projections by Country, 2023 to 2033 Figure 98: South Asia Market Value (US$ million) Analysis by Type, 2018 to 2033 Figure 99: South Asia Market Volume (MT) Analysis by Type, 2018 to 2033 Figure 100: South Asia Market Value Share (%) and BPS Analysis by Type, 2023 to 2033 Figure 101: South Asia Market Y-o-Y Growth (%) Projections by Type, 2023 to 2033 Figure 102: South Asia Market Value (US$ million) Analysis by Application, 2018 to 2033 Figure 103: South Asia Market Volume (MT) Analysis by Application, 2018 to 2033 Figure 104: South Asia Market Value Share (%) and BPS Analysis by Application, 2023 to 2033 Figure 105: South Asia Market Y-o-Y Growth (%) Projections by Application, 2023 to 2033 Figure 106: South Asia Market Attractiveness by Type, 2023 to 2033 Figure 107: South Asia Market Attractiveness by Application, 2023 to 2033 Figure 108: South Asia Market Attractiveness by Country, 2023 to 2033 Figure 109: Oceania Market Value (US$ million) by Type, 2023 to 2033 Figure 110: Oceania Market Value (US$ million) by Application, 2023 to 2033 Figure 111: Oceania Market Value (US$ million) by Country, 2023 to 2033 Figure 112: Oceania Market Value (US$ million) Analysis by Country, 2018 to 2033 Figure 113: Oceania Market Volume (MT) Analysis by Country, 2018 to 2033 Figure 114: Oceania Market Value Share (%) and BPS Analysis by Country, 2023 to 2033 Figure 115: Oceania Market Y-o-Y Growth (%) Projections by Country, 2023 to 2033 Figure 116: Oceania Market Value (US$ million) Analysis by Type, 2018 to 2033 Figure 117: Oceania Market Volume (MT) Analysis by Type, 2018 to 2033 Figure 118: Oceania Market Value Share (%) and BPS Analysis by Type, 2023 to 2033 Figure 119: Oceania Market Y-o-Y Growth (%) Projections by Type, 2023 to 2033 Figure 120: Oceania Market Value (US$ million) Analysis by Application, 2018 to 2033 Figure 121: Oceania Market Volume (MT) Analysis by Application, 2018 to 2033 Figure 122: Oceania Market Value Share (%) and BPS Analysis by Application, 2023 to 2033 Figure 123: Oceania Market Y-o-Y Growth (%) Projections by Application, 2023 to 2033 Figure 124: Oceania Market Attractiveness by Type, 2023 to 2033 Figure 125: Oceania Market Attractiveness by Application, 2023 to 2033 Figure 126: Oceania Market Attractiveness by Country, 2023 to 2033 Figure 127: MEA Market Value (US$ million) by Type, 2023 to 2033 Figure 128: MEA Market Value (US$ million) by Application, 2023 to 2033 Figure 129: MEA Market Value (US$ million) by Country, 2023 to 2033 Figure 130: MEA Market Value (US$ million) Analysis by Country, 2018 to 2033 Figure 131: MEA Market Volume (MT) Analysis by Country, 2018 to 2033 Figure 132: MEA Market Value Share (%) and BPS Analysis by Country, 2023 to 2033 Figure 133: MEA Market Y-o-Y Growth (%) Projections by Country, 2023 to 2033 Figure 134: MEA Market Value (US$ million) Analysis by Type, 2018 to 2033 Figure 135: MEA Market Volume (MT) Analysis by Type, 2018 to 2033 Figure 136: MEA Market Value Share (%) and BPS Analysis by Type, 2023 to 2033 Figure 137: MEA Market Y-o-Y Growth (%) Projections by Type, 2023 to 2033 Figure 138: MEA Market Value (US$ million) Analysis by Application, 2018 to 2033 Figure 139: MEA Market Volume (MT) Analysis by Application, 2018 to 2033 Figure 140: MEA Market Value Share (%) and BPS Analysis by Application, 2023 to 2033 Figure 141: MEA Market Y-o-Y Growth (%) Projections by Application, 2023 to 2033 Figure 142: MEA Market Attractiveness by Type, 2023 to 2033 Figure 143: MEA Market Attractiveness by Application, 2023 to 2033 Figure 144: MEA Market Attractiveness by Country, 2023 to 2033
Need specific information?
Request CustomizationExplore Process Automation Insights
View Reports