Reports

- Global Locations -

Headquarters

Future Market Insights, Inc.

Christiana Corporate, 200
Continental Drive, Suite 401,
Newark, Delaware - 19713,
United States

T: +1-845-579-5705

Americas

Future Market Insights, Inc.

616 Corporate Way, Suite 2-9018,
Valley Cottage, NY 10989, United States

T: +1-347-918-3531

MEA

Future Market Insights

1602-6 Jumeirah Bay X2 Tower, Plot No: JLT-PH2-X2A,
Jumeirah Lakes Towers, Dubai,
United Arab Emirates

Europe

Future Market Insights

3rd Floor, 207 Regent Street,
W1B 3HH London
United Kingdom

T: + 44 (0) 20 8123 9659
D: +44 (0) 20 3287 4268

Asia Pacific

Future Market Insights

IndiaLand Global Tech Park, Unit UG-1, Behind Grand HighStreet, Phase 1, Hinjawadi, MH, Pune – 411057, India

Airway Management Devices Markets Outlook

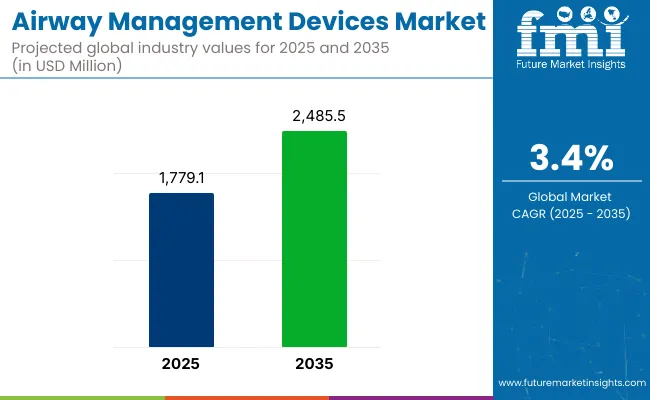
The airway management devices market is expected to be worth US$ 1.6 billion in 2023 and expected to record a 3.6% CAGR from 2023 to 2033, reaching around US$ 2.2 billion.

Report Attribute Details
Airway Management Devices Market Value (2023) US$ 1.6 billion
Airway Management Devices Market Anticipated Value (2033) US$ 2.2 billion
Airway Management Devices Market Growth Rate (2023 to 2033) 3.6% CAGR

Airway management devices are used to keep or restore a patient's ventilation. These devices also include assessing, planning, and implementing various medical methods to treat patients with respiratory failures or acute blockages. Aside from that, it shields the lungs from harm and allows patients to exchange gas. Supraglottic airway devices (SADs), tracheal intubation, trans tracheal access, and airway clearance are a few of the most often utilised airway management devices for keeping the upper airway open and providing unobstructed ventilation

Patients may require airway care for a variety of reasons, ranging from simple choking to complicated airway obstruction. For airway management, several specific clinical signs must be evaluated. Among them are respiratory failure, poor consciousness, rapid changes in mental status, aggressive choking, and penetrating injuries.

Depending on the circumstances, hospitals may employ a variety of airway management procedures. Basic airway care employs non-invasive techniques that do not need the use of specialist medical devices. Techniques to remove foreign bodies from the airway include chest compressions, abdominal thrusts, and back strikes. These factors are expected to drive the growth of the airway management devices market in the approaching years.

Don't pay for what you don't need

Customize your report by selecting specific countries or regions and save 30%!

Demand for Emergency and Intensive Care will drive the market growth

Patients with viral, chronic, or cardiac illnesses frequently experience airway issues, necessitating rapid medical attention. The demand for airway management devices is increasing as a result of a variety of circumstances, including traffic accident victims and people suffering from other traumatic injuries. The global demand for airway management devices is increasing due to critically ill and trauma patients being admitted to emergency rooms and intensive care units. As a result of the pandemic's rapid spread, admissions to emergency rooms and intensive care units have skyrocketed worldwide. These factors are expected to drive future growth in the airway management devices market.

2017 to 2022 Airway Management Devices Market Outlook in Comparison to 2023 to 2033 Growth Forecast

The Airway management devices market was valued at US$ 1.5 billion in 2022 and is estimated to increase at a 3.2% CAGR during the forecast period. Absolute dollar growth in the global market is US$ 668.5 million.

The increase in funds allocated by the federal government to promote the use of airway-management medical devices has also had an impact on the expansion of the airway-management devices market share. The revenue generated by the airway management devices market is additionally boosted by growing healthcare spending, improvements in healthcare infrastructure, and an increase in the need for long-term care delivery. Furthermore, the respiratory system alters geometrically, physiologically, and immunologically as we age. Chest wall and thoracic spine deformities are examples of structural anomalies that influence overall respiratory system compliance, resulting in airway irritation.

The increased incidence of respiratory infections and anaesthesia consumption as a result of more surgeries are expected to fuel the demand for airway management devices and positively impact the global airway management devices market growth. Moreover, as a result of technical advancements, key competitors are forging strategic alliances to boost the airway management device market. This feature is projected to generate several chances for key players to boost the airway management devices market.

Sabyasachi Ghosh
Sabyasachi Ghosh

Principal Consultant

Talk to Analyst

Find your sweet spots for generating winning opportunities in this market.

Comparative Analysis of Adjacent Markets

This section presents a comparative analysis of three closely related markets: the airway management devices market, the airway disease treatment market, and the airway management market. Examining these analogous industries unveils deeper insights that can inform the development of unique and differentiating strategies for achieving sustainable growth and capitalizing on opportunities within the airway management devices market.

Airway Management Devices Market:

Differentiating Aspects Airway Management Devices Market
Anticipated CAGR (2023 to 2033) 3.6%
Market Valuation (2023) US$ 1.6 billion
Growth Factors Increasing prevalence of chronic respiratory disease among the global population is expected to increase the growth of the global airway management devices market.
Future Opportunities Medical equipment resuscitators, tracheostomy tubes, laryngoscope blades, and resuscitators endotracheal tubes are widely used in healthcare facilities.
Market Trends Rising frequency of respiratory disorders.

Airway Disease Treatment Market:

Differentiating Aspects Airway Disease Treatment Market
Anticipated CAGR (2023 to 2033) 5.4%
Market Valuation (2023) US$ 2.2 billion
Growth Factors Rising prevalence of respiratory diseases such as asthma, cystic fibrosis and COPD across the world, the demand for airway disease treatment is expected to skyrocket to a considerable extent.
Future Opportunities Introduction of advanced imaging technologies such as digital radiography and computed radiography as they render high-quality digital images.
Market Trends Digital imaging systems have witnessed a low adoption rate as these are more expensive than analogue imaging systems.

Airway Management Market:

Differentiating Aspects Airway Management Market
Anticipated CAGR (2023 to 2033) 6%
Market Valuation (2023) US$ 2.01 billion
Growth Factors Increasing demand for emergency and intensive care.
Future Opportunities Growing demand for single-use airway management.
Market Trends Increase in patients’ admissions in emergency and intensive care units.

Airway Management Devices Market – Driving Factors

Advancement in airway management technology for the management of paediatric airways is expected to boost the airway management device market growth over the forecast period. Children have different anatomy and physiology structures as compared to adults. Also, the diagnosis and treatment of paediatric airways is difficult. Technological advancements can provide ease in paediatric airway diagnosis and treatment.

Airway management is the priority in any critical patient. Hypoxia can cause irreversible brain injury. So, in this type of state, airway management is the first priority before proceeding to any other treatment. This creates opportunities in the market for new device innovation and market growth. Currently, manufacturers of airway management devices are consistently making changes in their product categories and technologies in order to enhance the capabilities of the devices. This is expected to enhance their sale and increase the market share in the long term.

The global airway management devices market is expected to record a CAGR of 3.2% through the forecast period from 2022 to 2028.

Which Factors are Restraining the Demand for Airway Management Devices Market?

Complications and limitations associated with airway management due to intubation and other factors are expected to hamper the global airway management devices market growth.

Endotracheal intubation is a commonly performed airway management procedure in hospitals, but it also comprises risks and complications. Endotracheal intubation involves the risk of injuries such as dental injury, nasoseptal injury, laryngotracheal stenosis, and tracheoesophageal fistulas, among others. Dental trauma is also associated with laryngeal mask airway and oropharyngeal airway devices. Moreover, limitations & contraindications associated with laryngeal mask airway devices include morbid obesity, non-fasted patients, and airway problems at the glottic level, thoracic trauma, and the necessity for high inspiratory pressure in the presence of pulmonary compliance and COPD.

Product recalls of airways management devices are negatively affecting the growth of the global airways management device market. Due to the product recalls, the company losses their brand image and thus, these recalls negatively impact the revenue of the company.

The rise in Respiratory Disease Prevalence to Drive Airway Management Devices Market Growth

The rise in chronic respiratory disorders such as asthma and chronic obstructive pulmonary disease (COPD) is fueling demand for airway management devices. Chronic obstructive pulmonary disorders, such as bronchitis and emphysema, as well as lung cancer and other respiratory tract neoplasms, have a substantial impact on airways and lung structures. The prevalence of respiratory disorders is rising as a result of environmental and lifestyle factors such as air pollution, smoking, sedentary lifestyles, and stress.

Demand for airway management devices is being driven by increased patients suffering from such diseases, and the quick introduction and availability of portable, cost-contained, and simple-to-use airway equipment for the treatment of such ailments. Airway stenting and airway clearing systems are the two distinct therapies that make use of airway management devices.

According to the World Health Organization (WHO), over 65 million individuals had chronic obstructive pulmonary disease (COPD), and 3 million died from it, making it the third-leading cause of mortality in the world. More than 80% of these fatalities occurred in poor and middle-income nations.

Asthma affects about 262 million individuals worldwide each year, making it the most common chronic paediatric condition, affecting 14% of all children. Tuberculosis (TB) killed around 1.4 million people in 2022, making it the most prevalent deadly infectious illness. Lung cancer is the deadliest type of cancer, killing 1.6 million people each year.

The chronic respiratory disease kills 4 million individuals prematurely worldwide. At least 2 billion individuals are exposed to harmful smoke indoors, 1 billion to outdoor pollutants in the air, and 1 billion to cigarette smoke.

The Elderly Population's High Susceptibility to Chronic Respiratory Diseases will drive demand for Airway Management Devices

The rise in world population can be ascribed to an increase in people's life expectancy over the last decade. A person's immune system diminishes with age. Consequently, the growing older population increases the risk of developing numerous diseases. The amount of adults above the age of 60 is likely to increase in the future years. Additionally, chronic respiratory illnesses have become common as the elderly population has grown. This is expected to drive demand for airway management devices over the projected period.

An increase in the prevalence of chronic respiratory diseases (CRD) in adults is estimated to boost the demand for airway management devices. According to Centres for Disease Control and Prevention (CDC) data, the prevalence of COPD, emphysema, or chronic bronchitis in adults increased in 2023. As a result, individuals suffering from emphysema or chronic bronchitis have raised global demand for airway management equipment.

Increased demand for Single-use Airway Management Devices is likely to create numerous opportunities.

Airway management devices are among the medical devices utilized in a variety of applications within the healthcare business. Single-use medical equipment are resuscitators, tracheostomy tubes, laryngoscope blades, and resuscitators endotracheal tubes. These are widely used in healthcare facilities to provide value-based care services and treat critically ill patients with highly contagious illnesses such as H1N1 influenza or severe pneumonia. Furthermore, single-use devices have several advantages over reusable ones because they are already cleaned and ready to use, safeguarding patients from medical-care-related infections. In the past, it extended the use of single-use airway management devices throughout healthcare facilities to meet infection-control regulations.

Get the data you need at a Fraction of the cost

Personalize your report by choosing insights you need
and save 40%!

Airway Management Devices Market Trends

One of the primary factors driving the market is the rising frequency of respiratory disorders. Furthermore, the use of anaesthesia is increasing due to rising procedures. This, together with the numerous advantages of airway management systems, such as high efficiency in airway clearance, the maintenance of proper ventilation and patient safety during operating procedures, are also contributing to market expansion. Furthermore, a surge in the emergency treatment of extended illness and protracted treatment associated with lung illnesses in children and adults is fuelling demand for airway management devices. Furthermore, the introduction of new procedures for preoperative airway examination is bolstering market growth.

For example, Preoperative Endoscopic Airway Evaluation (PEAE) is a procedure that identifies, predicts, and facilitates an efficient management strategy, which includes the use of sophisticated equipment such as supraglottic airway. These airway devices facilitate tracheal implantation, which improves patient safety, and are then used in a variety of therapeutic applications.

A Glimpse of Country-wise Insights

Country United States
CAGR (2017 to 2022) 3.2%
Valuation (2023 to 2033) US$ 66.5 million
Country China
CAGR (2017 to 2022) 5.0%
Valuation (2023 to 2033) US$ 107.0 million
Country Japan
CAGR (2017 to 2022) 3.4%
Valuation (2023 to 2033) US$ 135.5 million
Country India
CAGR (2017 to 2022) 3.7%
Valuation (2023 to 2033) US$ 46.2 million

North America is likely to dominate the market for airway management devices

Because of the prevalence of asthma and chronic obstructive pulmonary disease, as well as the expanding older population, North America dominates the market for airway management devices. According to the United States Census Bureau, more than 50 million Americans aged 65 and older are at high risk of acquiring chronic diseases that necessitate immediate ventilation as of 2022.

The United States and Canada are two significant countries in North America where such medical gadgets have been widely embraced. The primary causes of the growth in the demand for airway management devices in North America include rising pollution levels and an increase in respiratory disorders, even in newborn care.

Due to advantageous reimbursement policies, an increase in healthcare R&D spending, and a growth in the incidence of chronic diseases such as COPD, the United States market is expected to expand significantly throughout the forecast period. COPD affects 12.7 to 14.7 million persons in the United States, according to the WHO data. The presence of the medical industry in North America will aid in the expansion of the region's airway management device market share.

What Makes the United States Large Market for Airway management devices market?

The United States is estimated to account for 92.7% of the North American airway management devices market in 2022 owing to the high acceptance of technologically advanced products, increase in the prevalence of chronic respiratory diseases, and favourable reimbursement regulations for airway management devices in the region.

Why is Germany Considered a Lucrative in the Airway management devices market?

Germany accounted for 18.3% market share in Europe in 2022 in value terms. Industrial advancement, the geriatric population and the rise in research and development spending are the factor boosting the demand for airway management devices market in Germany.

The risk associated with airways related problems increases with age. The growing geriatric population is considered an important factor bolstering the airway management devices market. According to the available WHO data from 2018, lung disease fatalities in Germany were 48,209, accounting for 6.27% of all deaths. Germany ranks 112 in the world with an age-adjusted death rate of 20.04 per 100,000 of population.

How will the Airway management devices market grow Across China?

Recently demand for airway management devices market in China owing to an increase in the outsourcing of the manufacturing airway management devices led to account over 20% market share in 2022 in the Asia Pacific region.

Government and administrative assortments in China are adopting different cost-control measures to decrease the healthcare burden. This move from a volume- to a value-based framework is fuelled by different measures taken by healthcare providers, medical device companies, governments and insurance payers that incorporate result-based estimating, price control and competitive tendering, profit, and risk sharing. Furthermore, the presence of untapped opportunities in this region, as well as the rising burden of the ageing populations, who are more susceptible to chronic respiratory disorders, rapid industrialization, and an increase in disposable income are the significant factors expected to propel the airway management devices market during the forecasted period. Moreover, increasing awareness and disease prevalence along with a strong foothold of leading industry players generated abundant growth potential in this region.

Demand for Endobronchial Tubes continue gaining traction by product?

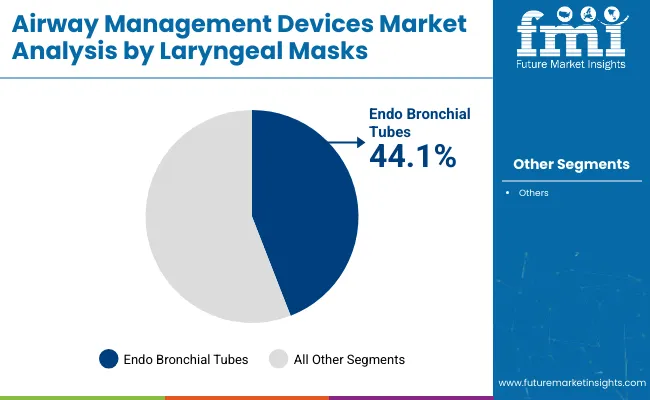
Endobronchial tubes accounted for a significant share of over 43.0% in 2021. The growing demand for these products is due to the benefits they provide. The most important benefit is improved patient safety, which encourages patients and anesthesiologists to choose these devices.

The introduction of a single or double-lumen endobronchial tube with a camera offers a promising solution in thoracoscopic lung surgery, as well as being advantageous in robotic surgery. During installation and single lung ventilation, a single/double-lumen endobronchial tube with a camera offers continuous real-time monitoring. This factor can further propel the airway management devices market.

Which Usage segment is leading the market share?

By usage type, single-use/ disposable accounted for 83.1% of the market share in 2022 due to its safety purpose with infection prevention and reduced chance of cross-infection. Airway management devices are directly used in the human airway lumen for instant relief.

So for such delivery, patient safety and infection prevention are at most priority that is easily achieved by single-use devices. Disposable devices avoid cross-infection risk, are easy to insert and are proven to be a safe method for airway management as compared to tubes. These factors are gaining traction for the market growth at present and in the forecast period.

Which End User will hold the most of the market share?

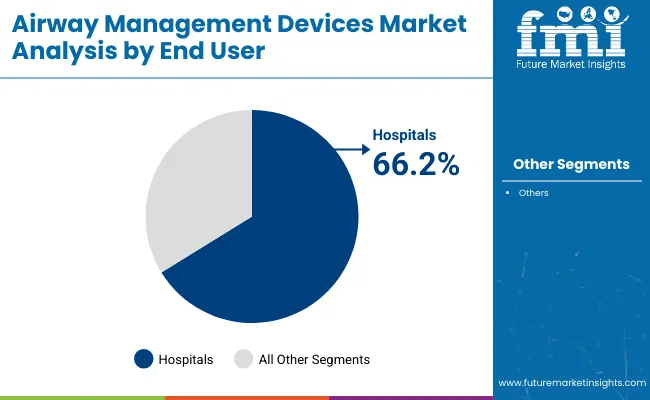
By end user, hospitals dominated the market with a market share of 47.8% in 2022 owing to increasing surgical procedures including the use of airway management equipment for ventilation, oxygenation, and anaesthetic administration. Additionally, airway management devices are easily handled in hospitals. Also, the more walk-in patient is seen in hospitals and growing government efforts targeted at enhancing safety and preventing adverse occurrences are significant contributors to the segment's growth in the forecast period.

Competitive Landscape

The global market for airway management devices is highly concentrated, with a limited amount of large-scale vendors controlling the majority of market share. Key participants in the global market include:

  • Medtronic Plc
  • Teleflex Incorporated
  • Ambu A/S
  • Smith’s Group plc.
  • Intersurgical Ltd.
  • Cook Medical Inc.
  • SunMed
  • Vyaire Medical Inc
  • VBM Medizintechnik GmbH
  • Karl Storz SE & Co. KG
  • Cook Gas LLC
  • Flexicare (Group) Limited
  • BVLM Pty Ltd
  • Boston Medical Products Inc. (BESS GROUP)
  • Salter Labs

Scope of Report

Attribute Details
Market Size Value in 2023 US$ 1.6 billion
Market Size Value in End of Forecast (2033) US$ 2.2 billion
Market Analysis US$ billion for Value
Key Region Covered
  • North America
  • Latin America
  • Europe
  • Asia Pacific
  • The Middle East & Africa
Key Segments
  • By Product Type
  • By Usage Type
  • By End User
  • By Region
Key Companies Profiled
  • Medtronic Plc
  • Teleflex Incorporated
  • Ambu A/S
  • Smith’s Group plc.
  • Intersurgical Ltd.
  • Cook Medical Inc.
  • SunMed
  • Vyaire Medical Inc
  • VBM Medizintechnik GmbH
  • Karl Storz SE & Co. KG
  • Cook Gas LLC
  • Flexicare (Group) Limited
  • BVLM Pty Ltd
  • Boston Medical Products Inc. (BESS GROUP)
  • Salter Labs
Report Coverage Market Forecast, Company Share Analysis, Competition Intelligence, DROT Analysis, Market Dynamics and Challenges, and Strategic Growth Initiatives

Airway Management Devices Market Key Segments

By Product Type:

  • Laryngeal Masks
  • Tracheostomy Tubes
  • Endotravheal Tubes
  • EndoBronhial Tubes
  • Nasal Airway Tubes
  • Oral Airway Tubes.

By Usage Type:

  • Single Use/ Disposable
  • Reusable

By End User:

  • Hospitals
  • Ambulatory Surgical Centers
  • Specialty Clinics

By Region:

  • North America
  • Latin America
  • Europe
  • Asia Pacific
  • The Middle East & Africa

Frequently Asked Questions

What is the market size in 2023?

The market is valued at US$ 1.6 billion in 2023.

What is the CAGR from 2023 to 2033?

The market is projected to reach 3.6% CAGR.

What will the market size be in 2033?

The market will grow by US$ 2.2 billion in 2033.

What is the expected market value in China?

China's market is expected to be worth US$ 135.5 million by 2033.

Who are the key market players?

Medtronic Plc, Teleflex Incorporated, and Ambu A/S are key players.

Table of Content

1. Executive Summary | Airway Management Devices Market

    1.1. Global Market Outlook

    1.2. Demand-side Trends

    1.3. Supply-side Trends

    1.4. Technology Roadmap Analysis

    1.5. Analysis and Recommendations

2. Market Overview

    2.1. Market Coverage / Taxonomy

    2.2. Market Definition / Scope / Limitations

3. Market Background

    3.1. Market Dynamics

        3.1.1. Drivers

        3.1.2. Restraints

        3.1.3. Opportunity

        3.1.4. Trends

    3.2. Scenario Forecast

        3.2.1. Demand in Optimistic Scenario

        3.2.2. Demand in Likely Scenario

        3.2.3. Demand in Conservative Scenario

    3.3. Opportunity Map Analysis

    3.4. Investment Feasibility Matrix

    3.5. PESTLE and Porter’s Analysis

    3.6. Regulatory Landscape

        3.6.1. By Key Regions

        3.6.2. By Key Countries

    3.7. Regional Parent Market Outlook

4. Global Analysis 2017 to 2022 and Forecast, 2023 to 2033

    4.1. Historical Market Size Value (US$ Million) Analysis, 2017 to 2022

    4.2. Current and Future Market Size Value (US$ Million) Projections, 2023 to 2033

        4.2.1. Y-o-Y Growth Trend Analysis

        4.2.2. Absolute $ Opportunity Analysis

5. Global Analysis 2017 to 2022 and Forecast 2023 to 2033, By Product Type

    5.1. Introduction / Key Findings

    5.2. Historical Market Size Value (US$ Million) Analysis By Product Type, 2017 to 2022

    5.3. Current and Future Market Size Value (US$ Million) Analysis and Forecast By Product Type, 2023 to 2033

        5.3.1. Laryngeal Masks

        5.3.2. Tracheostomy Tubes

        5.3.3. Endotravheal Tubes

        5.3.4. EndoBronhial Tubes

        5.3.5. Nasal Airway Tubes

        5.3.6. Oral Airway Tubes

    5.4. Y-o-Y Growth Trend Analysis By Product Type, 2017 to 2022

    5.5. Absolute $ Opportunity Analysis By Product Type, 2023 to 2033

6. Global Analysis 2017 to 2022 and Forecast 2023 to 2033, By Usage Type

    6.1. Introduction / Key Findings

    6.2. Historical Market Size Value (US$ Million) Analysis By Usage Type, 2017 to 2022

    6.3. Current and Future Market Size Value (US$ Million) Analysis and Forecast By Usage Type, 2023 to 2033

        6.3.1. Single Use/ Disposable

        6.3.2. Resuable

    6.4. Y-o-Y Growth Trend Analysis By Usage Type, 2017 to 2022

    6.5. Absolute $ Opportunity Analysis By Usage Type, 2023 to 2033

7. Global Analysis 2017 to 2022 and Forecast 2023 to 2033, By End User

    7.1. Introduction / Key Findings

    7.2. Historical Market Size Value (US$ Million) Analysis By End User , 2017 to 2022

    7.3. Current and Future Market Size Value (US$ Million) Analysis and Forecast By End User , 2023 to 2033

        7.3.1. Hospitals

        7.3.2. Ambulatory Surgical Centers

        7.3.3. Specialty Clinics

    7.4. Y-o-Y Growth Trend Analysis By End User , 2017 to 2022

    7.5. Absolute $ Opportunity Analysis By End User , 2023 to 2033

8. Global Analysis 2017 to 2022 and Forecast 2023 to 2033, By Region

    8.1. Introduction

    8.2. Historical Market Size Value (US$ Million) Analysis By Region, 2017 to 2022

    8.3. Current Market Size Value (US$ Million) Analysis and Forecast By Region, 2023 to 2033

        8.3.1. North America

        8.3.2. Latin America

        8.3.3. Europe

        8.3.4. Asia Pacific

        8.3.5. MEA

    8.4. Market Attractiveness Analysis By Region

9. North America Analysis 2017 to 2022 and Forecast 2023 to 2033, By Country

    9.1. Historical Market Size Value (US$ Million) Trend Analysis By Market Taxonomy, 2017 to 2022

    9.2. Market Size Value (US$ Million) Forecast By Market Taxonomy, 2023 to 2033

        9.2.1. By Country

            9.2.1.1. USA

            9.2.1.2. Canada

        9.2.2. By Product Type

        9.2.3. By Usage Type

        9.2.4. By End User

    9.3. Market Attractiveness Analysis

        9.3.1. By Country

        9.3.2. By Product Type

        9.3.3. By Usage Type

        9.3.4. By End User

    9.4. Key Takeaways

10. Latin America Analysis 2017 to 2022 and Forecast 2023 to 2033, By Country

    10.1. Historical Market Size Value (US$ Million) Trend Analysis By Market Taxonomy, 2017 to 2022

    10.2. Market Size Value (US$ Million) Forecast By Market Taxonomy, 2023 to 2033

        10.2.1. By Country

            10.2.1.1. Brazil

            10.2.1.2. Mexico

            10.2.1.3. Rest of Latin America

        10.2.2. By Product Type

        10.2.3. By Usage Type

        10.2.4. By End User

    10.3. Market Attractiveness Analysis

        10.3.1. By Country

        10.3.2. By Product Type

        10.3.3. By Usage Type

        10.3.4. By End User

    10.4. Key Takeaways

11. Europe Analysis 2017 to 2022 and Forecast 2023 to 2033, By Country

    11.1. Historical Market Size Value (US$ Million) Trend Analysis By Market Taxonomy, 2017 to 2022

    11.2. Market Size Value (US$ Million) Forecast By Market Taxonomy, 2023 to 2033

        11.2.1. By Country

            11.2.1.1. Germany

            11.2.1.2. United kingdom

            11.2.1.3. France

            11.2.1.4. Italy

            11.2.1.5. Spain

            11.2.1.6. Russia

            11.2.1.7. Rest of Europe

        11.2.2. By Product Type

        11.2.3. By Usage Type

        11.2.4. By End User

    11.3. Market Attractiveness Analysis

        11.3.1. By Country

        11.3.2. By Product Type

        11.3.3. By Usage Type

        11.3.4. By End User

    11.4. Key Takeaways

12. Asia Pacific Analysis 2017 to 2022 and Forecast 2023 to 2033, By Country

    12.1. Historical Market Size Value (US$ Million) Trend Analysis By Market Taxonomy, 2017 to 2022

    12.2. Market Size Value (US$ Million) Forecast By Market Taxonomy, 2023 to 2033

        12.2.1. By Country

            12.2.1.1. China

            12.2.1.2. India

            12.2.1.3. Australia

            12.2.1.4. Japan

            12.2.1.5. Rest of Asia Pacific

        12.2.2. By Product Type

        12.2.3. By Usage Type

        12.2.4. By End User

    12.3. Market Attractiveness Analysis

        12.3.1. By Country

        12.3.2. By Product Type

        12.3.3. By Usage Type

        12.3.4. By End User

    12.4. Key Takeaways

13. MEA Analysis 2017 to 2022 and Forecast 2023 to 2033, By Country

    13.1. Historical Market Size Value (US$ Million) Trend Analysis By Market Taxonomy, 2017 to 2022

    13.2. Market Size Value (US$ Million) Forecast By Market Taxonomy, 2023 to 2033

        13.2.1. By Country

            13.2.1.1. Saudi Arabi

            13.2.1.2. South Africa

            13.2.1.3. Israel

            13.2.1.4. Rest of MEA

        13.2.2. By Product Type

        13.2.3. By Usage Type

        13.2.4. By End User

    13.3. Market Attractiveness Analysis

        13.3.1. By Country

        13.3.2. By Product Type

        13.3.3. By Usage Type

        13.3.4. By End User

    13.4. Key Takeaways

14. Key Countries Analysis

    14.1. USA

        14.1.1. Pricing Analysis

        14.1.2. Market Share Analysis, 2022

            14.1.2.1. By Product Type

            14.1.2.2. By Usage Type

            14.1.2.3. By End User

    14.2. Canada

        14.2.1. Pricing Analysis

        14.2.2. Market Share Analysis, 2022

            14.2.2.1. By Product Type

            14.2.2.2. By Usage Type

            14.2.2.3. By End User

    14.3. Brazil

        14.3.1. Pricing Analysis

        14.3.2. Market Share Analysis, 2022

            14.3.2.1. By Product Type

            14.3.2.2. By Usage Type

            14.3.2.3. By End User

    14.4. Mexico

        14.4.1. Pricing Analysis

        14.4.2. Market Share Analysis, 2022

            14.4.2.1. By Product Type

            14.4.2.2. By Usage Type

            14.4.2.3. By End User

    14.5. Germany

        14.5.1. Pricing Analysis

        14.5.2. Market Share Analysis, 2022

            14.5.2.1. By Product Type

            14.5.2.2. By Usage Type

            14.5.2.3. By End User

    14.6. United kingdom

        14.6.1. Pricing Analysis

        14.6.2. Market Share Analysis, 2022

            14.6.2.1. By Product Type

            14.6.2.2. By Usage Type

            14.6.2.3. By End User

    14.7. France

        14.7.1. Pricing Analysis

        14.7.2. Market Share Analysis, 2022

            14.7.2.1. By Product Type

            14.7.2.2. By Usage Type

            14.7.2.3. By End User

    14.8. Italy

        14.8.1. Pricing Analysis

        14.8.2. Market Share Analysis, 2022

            14.8.2.1. By Product Type

            14.8.2.2. By Usage Type

            14.8.2.3. By End User

    14.9. Spain

        14.9.1. Pricing Analysis

        14.9.2. Market Share Analysis, 2022

            14.9.2.1. By Product Type

            14.9.2.2. By Usage Type

            14.9.2.3. By End User

    14.10. Russia

        14.10.1. Pricing Analysis

        14.10.2. Market Share Analysis, 2022

            14.10.2.1. By Product Type

            14.10.2.2. By Usage Type

            14.10.2.3. By End User

    14.11. China

        14.11.1. Pricing Analysis

        14.11.2. Market Share Analysis, 2022

            14.11.2.1. By Product Type

            14.11.2.2. By Usage Type

            14.11.2.3. By End User

    14.12. India

        14.12.1. Pricing Analysis

        14.12.2. Market Share Analysis, 2022

            14.12.2.1. By Product Type

            14.12.2.2. By Usage Type

            14.12.2.3. By End User

    14.13. Australia

        14.13.1. Pricing Analysis

        14.13.2. Market Share Analysis, 2022

            14.13.2.1. By Product Type

            14.13.2.2. By Usage Type

            14.13.2.3. By End User

    14.14. Japan

        14.14.1. Pricing Analysis

        14.14.2. Market Share Analysis, 2022

            14.14.2.1. By Product Type

            14.14.2.2. By Usage Type

            14.14.2.3. By End User

    14.15. Saudi Arabia

        14.15.1. Pricing Analysis

        14.15.2. Market Share Analysis, 2022

            14.15.2.1. By Product Type

            14.15.2.2. By Usage Type

            14.15.2.3. By End User

    14.16. South Africa

        14.16.1. Pricing Analysis

        14.16.2. Market Share Analysis, 2022

            14.16.2.1. By Product Type

            14.16.2.2. By Usage Type

            14.16.2.3. By End User

15. Market Structure Analysis

    15.1. Competition Dashboard

    15.2. Competition Benchmarking

    15.3. Market Share Analysis of Top Players

        15.3.1. By Regional

        15.3.2. By Product Type

        15.3.3. By Usage Type

        15.3.4. By End User

16. Competition Analysis

    16.1. Competition Deep Dive

        16.1.1. Medtronic Plc

            16.1.1.1. Overview

            16.1.1.2. Product Portfolio

            16.1.1.3. Profitability by Market Segments

            16.1.1.4. Sales Footprint

            16.1.1.5. Strategy Overview

                16.1.1.5.1. Marketing Strategy

        16.1.2. Teleflex Incorporated

            16.1.2.1. Overview

            16.1.2.2. Product Portfolio

            16.1.2.3. Profitability by Market Segments

            16.1.2.4. Sales Footprint

            16.1.2.5. Strategy Overview

                16.1.2.5.1. Marketing Strategy

        16.1.3. Ambu A/S

            16.1.3.1. Overview

            16.1.3.2. Product Portfolio

            16.1.3.3. Profitability by Market Segments

            16.1.3.4. Sales Footprint

            16.1.3.5. Strategy Overview

                16.1.3.5.1. Marketing Strategy

        16.1.4. Smiths Group plc.

            16.1.4.1. Overview

            16.1.4.2. Product Portfolio

            16.1.4.3. Profitability by Market Segments

            16.1.4.4. Sales Footprint

            16.1.4.5. Strategy Overview

                16.1.4.5.1. Marketing Strategy

        16.1.5. Intersurgical Ltd.

            16.1.5.1. Overview

            16.1.5.2. Product Portfolio

            16.1.5.3. Profitability by Market Segments

            16.1.5.4. Sales Footprint

            16.1.5.5. Strategy Overview

                16.1.5.5.1. Marketing Strategy

        16.1.6. Cook Medical Inc.

            16.1.6.1. Overview

            16.1.6.2. Product Portfolio

            16.1.6.3. Profitability by Market Segments

            16.1.6.4. Sales Footprint

            16.1.6.5. Strategy Overview

                16.1.6.5.1. Marketing Strategy

        16.1.7. SunMed

            16.1.7.1. Overview

            16.1.7.2. Product Portfolio

            16.1.7.3. Profitability by Market Segments

            16.1.7.4. Sales Footprint

            16.1.7.5. Strategy Overview

                16.1.7.5.1. Marketing Strategy

        16.1.8. Vyaire Medical Inc

            16.1.8.1. Overview

            16.1.8.2. Product Portfolio

            16.1.8.3. Profitability by Market Segments

            16.1.8.4. Sales Footprint

            16.1.8.5. Strategy Overview

                16.1.8.5.1. Marketing Strategy

        16.1.9. VBM Medizintechnik GmbH

            16.1.9.1. Overview

            16.1.9.2. Product Portfolio

            16.1.9.3. Profitability by Market Segments

            16.1.9.4. Sales Footprint

            16.1.9.5. Strategy Overview

                16.1.9.5.1. Marketing Strategy

        16.1.10. Karl Storz SE & Co. KG

            16.1.10.1. Overview

            16.1.10.2. Product Portfolio

            16.1.10.3. Profitability by Market Segments

            16.1.10.4. Sales Footprint

            16.1.10.5. Strategy Overview

                16.1.10.5.1. Marketing Strategy

        16.1.11. Cook Gas LLC

            16.1.11.1. Overview

            16.1.11.2. Product Portfolio

            16.1.11.3. Profitability by Market Segments

            16.1.11.4. Sales Footprint

            16.1.11.5. Strategy Overview

                16.1.11.5.1. Marketing Strategy

        16.1.12. Flexicare (Group) Limited

            16.1.12.1. Overview

            16.1.12.2. Product Portfolio

            16.1.12.3. Profitability by Market Segments

            16.1.12.4. Sales Footprint

            16.1.12.5. Strategy Overview

                16.1.12.5.1. Marketing Strategy

        16.1.13. BVLM Pty Ltd

            16.1.13.1. Overview

            16.1.13.2. Product Portfolio

            16.1.13.3. Profitability by Market Segments

            16.1.13.4. Sales Footprint

            16.1.13.5. Strategy Overview

                16.1.13.5.1. Marketing Strategy

        16.1.14. Boston Medical Products Inc.

            16.1.14.1. Overview

            16.1.14.2. Product Portfolio

            16.1.14.3. Profitability by Market Segments

            16.1.14.4. Sales Footprint

            16.1.14.5. Strategy Overview

                16.1.14.5.1. Marketing Strategy

17. Assumptions & Acronyms Used

18. Research Methodology

Don't pay for what you don't need

Customize your report by selecting specific countries or regions and save 30%!

List of Tables

Table 1: Global Value (US$ Million) Forecast by Region, 2017 to 2033

Table 2: Global Value (US$ Million) Forecast by Product Type, 2017 to 2033

Table 3: Global Value (US$ Million) Forecast by Usage Type, 2017 to 2033

Table 4: Global Value (US$ Million) Forecast by End User , 2017 to 2033

Table 5: North America Value (US$ Million) Forecast by Country, 2017 to 2033

Table 6: North America Value (US$ Million) Forecast by Product Type, 2017 to 2033

Table 7: North America Value (US$ Million) Forecast by Usage Type, 2017 to 2033

Table 8: North America Value (US$ Million) Forecast by End User , 2017 to 2033

Table 9: Latin America Value (US$ Million) Forecast by Country, 2017 to 2033

Table 10: Latin America Value (US$ Million) Forecast by Product Type, 2017 to 2033

Table 11: Latin America Value (US$ Million) Forecast by Usage Type, 2017 to 2033

Table 12: Latin America Value (US$ Million) Forecast by End User , 2017 to 2033

Table 13: Europe Value (US$ Million) Forecast by Country, 2017 to 2033

Table 14: Europe Value (US$ Million) Forecast by Product Type, 2017 to 2033

Table 15: Europe Value (US$ Million) Forecast by Usage Type, 2017 to 2033

Table 16: Europe Value (US$ Million) Forecast by End User , 2017 to 2033

Table 17: Asia Pacific Value (US$ Million) Forecast by Country, 2017 to 2033

Table 18: Asia Pacific Value (US$ Million) Forecast by Product Type, 2017 to 2033

Table 19: Asia Pacific Value (US$ Million) Forecast by Usage Type, 2017 to 2033

Table 20: Asia Pacific Value (US$ Million) Forecast by End User , 2017 to 2033

Table 21: MEA Value (US$ Million) Forecast by Country, 2017 to 2033

Table 22: MEA Value (US$ Million) Forecast by Product Type, 2017 to 2033

Table 23: MEA Value (US$ Million) Forecast by Usage Type, 2017 to 2033

Table 24: MEA Value (US$ Million) Forecast by End User , 2017 to 2033
Sabyasachi Ghosh
Sabyasachi Ghosh

Principal Consultant

Talk to Analyst

Find your sweet spots for generating winning opportunities in this market.

List of Charts

Figure 1: Global Value (US$ Million) by Product Type, 2023 to 2033

Figure 2: Global Value (US$ Million) by Usage Type, 2023 to 2033

Figure 3: Global Value (US$ Million) by End User , 2023 to 2033

Figure 4: Global Value (US$ Million) by Region, 2023 to 2033

Figure 5: Global Value (US$ Million) Analysis by Region, 2017 to 2033

Figure 6: Global Value Share (%) and BPS Analysis by Region, 2023 to 2033

Figure 7: Global Y-o-Y Growth (%) Projections by Region, 2023 to 2033

Figure 8: Global Value (US$ Million) Analysis by Product Type, 2017 to 2033

Figure 9: Global Value Share (%) and BPS Analysis by Product Type, 2023 to 2033

Figure 10: Global Y-o-Y Growth (%) Projections by Product Type, 2023 to 2033

Figure 11: Global Value (US$ Million) Analysis by Usage Type, 2017 to 2033

Figure 12: Global Value Share (%) and BPS Analysis by Usage Type, 2023 to 2033

Figure 13: Global Y-o-Y Growth (%) Projections by Usage Type, 2023 to 2033

Figure 14: Global Value (US$ Million) Analysis by End User , 2017 to 2033

Figure 15: Global Value Share (%) and BPS Analysis by End User , 2023 to 2033

Figure 16: Global Y-o-Y Growth (%) Projections by End User , 2023 to 2033

Figure 17: Global Attractiveness by Product Type, 2023 to 2033

Figure 18: Global Attractiveness by Usage Type, 2023 to 2033

Figure 19: Global Attractiveness by End User , 2023 to 2033

Figure 20: Global Attractiveness by Region, 2023 to 2033

Figure 21: North America Value (US$ Million) by Product Type, 2023 to 2033

Figure 22: North America Value (US$ Million) by Usage Type, 2023 to 2033

Figure 23: North America Value (US$ Million) by End User , 2023 to 2033

Figure 24: North America Value (US$ Million) by Country, 2023 to 2033

Figure 25: North America Value (US$ Million) Analysis by Country, 2017 to 2033

Figure 26: North America Value Share (%) and BPS Analysis by Country, 2023 to 2033

Figure 27: North America Y-o-Y Growth (%) Projections by Country, 2023 to 2033

Figure 28: North America Value (US$ Million) Analysis by Product Type, 2017 to 2033

Figure 29: North America Value Share (%) and BPS Analysis by Product Type, 2023 to 2033

Figure 30: North America Y-o-Y Growth (%) Projections by Product Type, 2023 to 2033

Figure 31: North America Value (US$ Million) Analysis by Usage Type, 2017 to 2033

Figure 32: North America Value Share (%) and BPS Analysis by Usage Type, 2023 to 2033

Figure 33: North America Y-o-Y Growth (%) Projections by Usage Type, 2023 to 2033

Figure 34: North America Value (US$ Million) Analysis by End User , 2017 to 2033

Figure 35: North America Value Share (%) and BPS Analysis by End User , 2023 to 2033

Figure 36: North America Y-o-Y Growth (%) Projections by End User , 2023 to 2033

Figure 37: North America Attractiveness by Product Type, 2023 to 2033

Figure 38: North America Attractiveness by Usage Type, 2023 to 2033

Figure 39: North America Attractiveness by End User , 2023 to 2033

Figure 40: North America Attractiveness by Country, 2023 to 2033

Figure 41: Latin America Value (US$ Million) by Product Type, 2023 to 2033

Figure 42: Latin America Value (US$ Million) by Usage Type, 2023 to 2033

Figure 43: Latin America Value (US$ Million) by End User , 2023 to 2033

Figure 44: Latin America Value (US$ Million) by Country, 2023 to 2033

Figure 45: Latin America Value (US$ Million) Analysis by Country, 2017 to 2033

Figure 46: Latin America Value Share (%) and BPS Analysis by Country, 2023 to 2033

Figure 47: Latin America Y-o-Y Growth (%) Projections by Country, 2023 to 2033

Figure 48: Latin America Value (US$ Million) Analysis by Product Type, 2017 to 2033

Figure 49: Latin America Value Share (%) and BPS Analysis by Product Type, 2023 to 2033

Figure 50: Latin America Y-o-Y Growth (%) Projections by Product Type, 2023 to 2033

Figure 51: Latin America Value (US$ Million) Analysis by Usage Type, 2017 to 2033

Figure 52: Latin America Value Share (%) and BPS Analysis by Usage Type, 2023 to 2033

Figure 53: Latin America Y-o-Y Growth (%) Projections by Usage Type, 2023 to 2033

Figure 54: Latin America Value (US$ Million) Analysis by End User , 2017 to 2033

Figure 55: Latin America Value Share (%) and BPS Analysis by End User , 2023 to 2033

Figure 56: Latin America Y-o-Y Growth (%) Projections by End User , 2023 to 2033

Figure 57: Latin America Attractiveness by Product Type, 2023 to 2033

Figure 58: Latin America Attractiveness by Usage Type, 2023 to 2033

Figure 59: Latin America Attractiveness by End User , 2023 to 2033

Figure 60: Latin America Attractiveness by Country, 2023 to 2033

Figure 61: Europe Value (US$ Million) by Product Type, 2023 to 2033

Figure 62: Europe Value (US$ Million) by Usage Type, 2023 to 2033

Figure 63: Europe Value (US$ Million) by End User , 2023 to 2033

Figure 64: Europe Value (US$ Million) by Country, 2023 to 2033

Figure 65: Europe Value (US$ Million) Analysis by Country, 2017 to 2033

Figure 66: Europe Value Share (%) and BPS Analysis by Country, 2023 to 2033

Figure 67: Europe Y-o-Y Growth (%) Projections by Country, 2023 to 2033

Figure 68: Europe Value (US$ Million) Analysis by Product Type, 2017 to 2033

Figure 69: Europe Value Share (%) and BPS Analysis by Product Type, 2023 to 2033

Figure 70: Europe Y-o-Y Growth (%) Projections by Product Type, 2023 to 2033

Figure 71: Europe Value (US$ Million) Analysis by Usage Type, 2017 to 2033

Figure 72: Europe Value Share (%) and BPS Analysis by Usage Type, 2023 to 2033

Figure 73: Europe Y-o-Y Growth (%) Projections by Usage Type, 2023 to 2033

Figure 74: Europe Value (US$ Million) Analysis by End User , 2017 to 2033

Figure 75: Europe Value Share (%) and BPS Analysis by End User , 2023 to 2033

Figure 76: Europe Y-o-Y Growth (%) Projections by End User , 2023 to 2033

Figure 77: Europe Attractiveness by Product Type, 2023 to 2033

Figure 78: Europe Attractiveness by Usage Type, 2023 to 2033

Figure 79: Europe Attractiveness by End User , 2023 to 2033

Figure 80: Europe Attractiveness by Country, 2023 to 2033

Figure 81: Asia Pacific Value (US$ Million) by Product Type, 2023 to 2033

Figure 82: Asia Pacific Value (US$ Million) by Usage Type, 2023 to 2033

Figure 83: Asia Pacific Value (US$ Million) by End User , 2023 to 2033

Figure 84: Asia Pacific Value (US$ Million) by Country, 2023 to 2033

Figure 85: Asia Pacific Value (US$ Million) Analysis by Country, 2017 to 2033

Figure 86: Asia Pacific Value Share (%) and BPS Analysis by Country, 2023 to 2033

Figure 87: Asia Pacific Y-o-Y Growth (%) Projections by Country, 2023 to 2033

Figure 88: Asia Pacific Value (US$ Million) Analysis by Product Type, 2017 to 2033

Figure 89: Asia Pacific Value Share (%) and BPS Analysis by Product Type, 2023 to 2033

Figure 90: Asia Pacific Y-o-Y Growth (%) Projections by Product Type, 2023 to 2033

Figure 91: Asia Pacific Value (US$ Million) Analysis by Usage Type, 2017 to 2033

Figure 92: Asia Pacific Value Share (%) and BPS Analysis by Usage Type, 2023 to 2033

Figure 93: Asia Pacific Y-o-Y Growth (%) Projections by Usage Type, 2023 to 2033

Figure 94: Asia Pacific Value (US$ Million) Analysis by End User , 2017 to 2033

Figure 95: Asia Pacific Value Share (%) and BPS Analysis by End User , 2023 to 2033

Figure 96: Asia Pacific Y-o-Y Growth (%) Projections by End User , 2023 to 2033

Figure 97: Asia Pacific Attractiveness by Product Type, 2023 to 2033

Figure 98: Asia Pacific Attractiveness by Usage Type, 2023 to 2033

Figure 99: Asia Pacific Attractiveness by End User , 2023 to 2033

Figure 100: Asia Pacific Attractiveness by Country, 2023 to 2033

Figure 101: MEA Value (US$ Million) by Product Type, 2023 to 2033

Figure 102: MEA Value (US$ Million) by Usage Type, 2023 to 2033

Figure 103: MEA Value (US$ Million) by End User , 2023 to 2033

Figure 104: MEA Value (US$ Million) by Country, 2023 to 2033

Figure 105: MEA Value (US$ Million) Analysis by Country, 2017 to 2033

Figure 106: MEA Value Share (%) and BPS Analysis by Country, 2023 to 2033

Figure 107: MEA Y-o-Y Growth (%) Projections by Country, 2023 to 2033

Figure 108: MEA Value (US$ Million) Analysis by Product Type, 2017 to 2033

Figure 109: MEA Value Share (%) and BPS Analysis by Product Type, 2023 to 2033

Figure 110: MEA Y-o-Y Growth (%) Projections by Product Type, 2023 to 2033

Figure 111: MEA Value (US$ Million) Analysis by Usage Type, 2017 to 2033

Figure 112: MEA Value Share (%) and BPS Analysis by Usage Type, 2023 to 2033

Figure 113: MEA Y-o-Y Growth (%) Projections by Usage Type, 2023 to 2033

Figure 114: MEA Value (US$ Million) Analysis by End User , 2017 to 2033

Figure 115: MEA Value Share (%) and BPS Analysis by End User , 2023 to 2033

Figure 116: MEA Y-o-Y Growth (%) Projections by End User , 2023 to 2033

Figure 117: MEA Attractiveness by Product Type, 2023 to 2033

Figure 118: MEA Attractiveness by Usage Type, 2023 to 2033

Figure 119: MEA Attractiveness by End User , 2023 to 2033

Figure 120: MEA Attractiveness by Country, 2023 to 2033

Recommendations

Healthcare

Airway Clearance Devices System Market

Published : July 2023

Healthcare

Airway Disease Treatment Market

Published : October 2022

Explore Healthcare Insights

View Reports

Airway Management Devices Market