Reports

- Global Locations -

Headquarters

Future Market Insights, Inc.

Christiana Corporate, 200
Continental Drive, Suite 401,
Newark, Delaware - 19713,
United States

T: +1-845-579-5705

Americas

Future Market Insights, Inc.

616 Corporate Way, Suite 2-9018,
Valley Cottage, NY 10989, United States

T: +1-347-918-3531

MEA

Future Market Insights

1602-6 Jumeirah Bay X2 Tower, Plot No: JLT-PH2-X2A,
Jumeirah Lakes Towers, Dubai,
United Arab Emirates

Europe

Future Market Insights

3rd Floor, 207 Regent Street,
W1B 3HH London
United Kingdom

T: + 44 (0) 20 8123 9659
D: +44 (0) 20 3287 4268

Asia Pacific

Future Market Insights

IndiaLand Global Tech Park, Unit UG-1, Behind Grand HighStreet, Phase 1, Hinjawadi, MH, Pune – 411057, India

Tax Management Market Outlook (2022-2032)

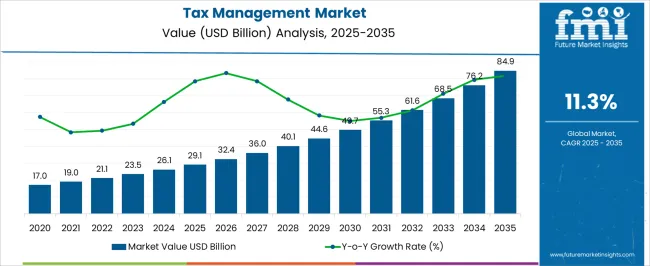
[250 Pages Report] The global demand for tax management is expected to rise at a healthy CAGR of 11.3% per year to US$ 21.1 billion in 2022, supported by the following:

  • Companies need to stay on top of the latest and most current tax filings and compliance procedures across the globe, increasing the demand for tax management software.
  • In the tax management process, automation minimizes human effort since all of the taxation procedures, including tax computation and tax filing, are handled automatically.
  • As the tax management software market expands over the projected period, it will be expected to boost because of the fastening up of the tax filing process and the decrease in the possibility of errors and flaws. As a result, the tax management market is expected to grow.
  • The increase in the use of tax software by the BFSI sector on a global scale is contributing to the growth of the global tax software market.
  • It is expected that the global tax management market is likely to experience increased revenue growth in the coming years due to increasing demand for more cost-effective tax filing solutions.
Attributes Details
Global Tax Management Market Size (2022) US$ 21.1 Billion
Global Tax Management Market Size (2032) US$ 61.4 Billion
Global Tax Management Market CAGR (2022 to 2032) 11.3%
USA Tax Management Market Size (2032) US$ 20 Billion
USA Tax Management Market CAGR (2022 to 2032) 10.6%
Key Companies Covered
  • Avalara
  • Automatic Data Processing
  • Intuit
  • SAP
  • Thomson Reuters
  • Outright
  • Shoeboxed
  • SAXTAX
  • H&R Block
  • CrowdReason
  • Blucora
  • Wolters Kluwer

Don't pay for what you don't need

Customize your report by selecting specific countries or regions and save 30%!

Tax Laws are Frequently Amended, Posing several Challenges

A law amendment is an act of adding, altering or omitting a particular part of a law in an attempt to make it more effective. It is expected that the amendment of tax laws will pose a challenge to solution providers because they will need to consult tax experts and update their existing users'/subscribers' software as well. This will increase the price of the solution and decrease the company's revenue. In such cases, the solution providers had to make certain changes in their offerings to be able to serve these customers. Consequently, solution providers face several challenges after every amendment made by governments all over the world.

Blockchain technology Remains a Potential Opportunity

Several industries use blockchain technology, which stores information about health and property, bank transactions, and supply chain. It is used in aviation, automotive, agriculture, manufacturing, and banking. Blockchain technology has several major advantages such as improved accuracy, decentralization, security, and transparency. The application of blockchain technology for tax compliance will add a shared blockchain technology between taxpayers and tax administrators. As a result, the current method of exchanging tax information occasionally will be replaced by a real-time method.

Sudip Saha
Sudip Saha

Principal Consultant

Talk to Analyst

Find your sweet spots for generating winning opportunities in this market.

A Significant Growth Outlook for the Asia Pacific Tax Management Market

Due to the increasing level of tax enforcement in the region, as well as the increasing use of tax management software, Asia Pacific is predicted to record significant growth in terms of revenue during the forecast period. It is expected that the growth in the BFSI sector and the frequent regulatory changes in developing countries like India and China in the region will drive the growth in the tax management market in the region.

As an example, the Indian government began charging Goods and Services Tax in July 2017 at five different rates: 0%, 5%, 12%, 18%, and 28%. The GST tax calculation is quite complex, so there has been an increase in the adoption of tax management software to automate tax calculations, which is expected to augment the growth of the tax management market in the Asia Pacific since GST tax calculation is quite complicated.

Strategy Development Remains Regular Episodes in the Market

With the acquisition of Transaction Tax Resources, Inc. in October 2020, Avalara, Inc. will be able to integrate the leading technology behind tax returns with trustworthy tax data, thus enabling Avalara to expand its existing product line, introduce new capabilities, and expand its reach to new markets.

Get the data you need at a Fraction of the cost

Personalize your report by choosing insights you need
and save 40%!

Revenue Of Tax Management Market From 2015 To 2021 Compared To Demand Outlook For 2022 To 2032

As per the Tax Management Market research by Future Market Insights - a market research and competitive intelligence provider, historically, from 2015 to 2021, the market value of the Tax Management Market increased at around 13% CAGR.

The rising amount of financial transactions over different verticals due to digitization, the complexity of the existing tax system, and heightened surveillance of tax administrators are the key factors driving the expansion of the tax management industry. Furthermore, the usage of blockchain technology is projected to generate several prospects for tax management companies.

Which Factors Are Propelling The Tax Management Demand?

Technological advancements have boosted information interchange and cut transaction costs, which has increased transaction volume. Due to the increased usage of mobile phones and tablets, it has become feasible for everyone to conduct financial transactions using their smartphones or tablets.

Furthermore, the increased usage of web-based e-commerce and banking services and solutions increases the volume of online transactions internationally. This rise in web-based transactions is expected to fuel demand for different tax administration systems for sales tax, GST, and service tax, which will drive market expansion globally.

Market growth for even more cost-effective tax filing solutions is also predicted to boost the global tax management industry's revenue growth in the coming years. According to Income Tax Department guidelines, a taxpayer, whether an individual or a corporation, must use the stated format when providing data of uncontested accounts.

Income-tax return submitting software may handle the pre-defined procedures by assessing the tax number. This strategy eliminates the need for taxpayers to consider mistakes or discrepancies.

Additionally, growing demands for solutions for easier tax record keeping is likely to fuel revenue growth of the tax management market. When it relates to preserving important tax documents, most firms rely on record keeping, which may be simplified by adopting tax software.

Businesses may also utilize cloud-based tax software to securely save tax data from prior years on the cloud. Using such services, businesses may also have fast access to critical tax information for any fiscal year. Growing demands for tax computation software with high precision and fewer mistakes are likely to drive revenue growth in the global tax management market in the upcoming years.

Region-Wise Analysis

Which Region is projected to Offer the Largest Opportunity for Tax Management Market?

During the projected period, North America held the largest share in the global Tax Management Market with a market size of around US$ 25 Bn. Due to the constant changes and restrictions in the local taxation system, the North American market has seen remarkable development in the use of tax software.

The region's taxation system's complexity, along with disparities in tax and employment legislation, is offering significant potential for software application developers and key suppliers to participate in the tax management software industry.

Regional software suppliers have begun collaborating with third-party developers to create API-based products to improve the taxes system. As a result, firms in North America are adopting innovative technology and channels to stay competitive and update at an exponential rate.
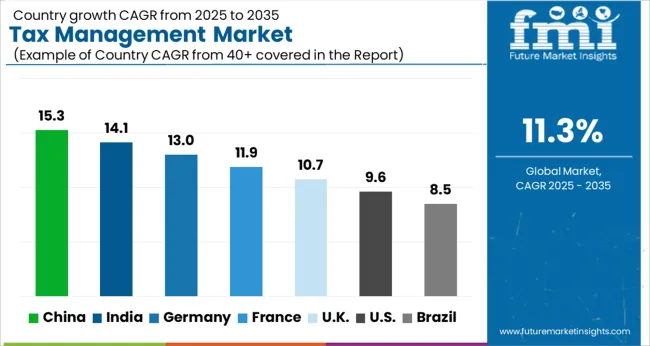
Country-Wise Analysis

Which Country Lies at the CenterStage for Tax Management Market Revenue?

The United States is expected to account for the largest market share of US$ 20 Bn by the end of 2032 with an expected CAGR of 10.6% by the end of 2032.

The constantly changing taxation climate has also made it critical for tax authorities and taxpayers in the U.S. to remain updated on variables impacting the company's tax responsibilities. The United States Tax Forum has evolved into the ideal platform for tax software suppliers to develop their user base in the area.

Many countries' development in this region has slowed, making it more important for tax proposals to appeal to businesses. However, tax administrations are projected to conduct more frequent and aggressive fiscal audits to generate more substantial revenues; hence, the need for different technologies is predicted to rise in the region throughout the projection period.
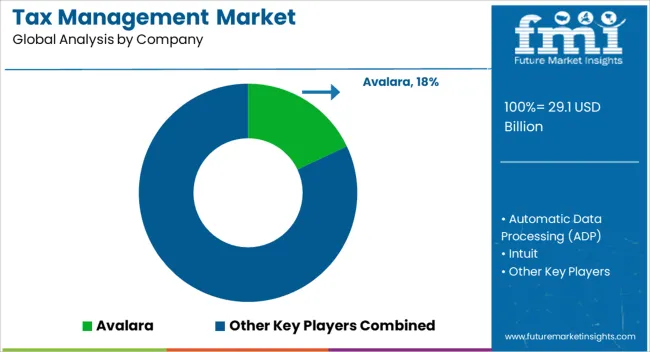
Category-Wise Insights

Which Tax Management Segment is projected to Witness the Fastest Growth?

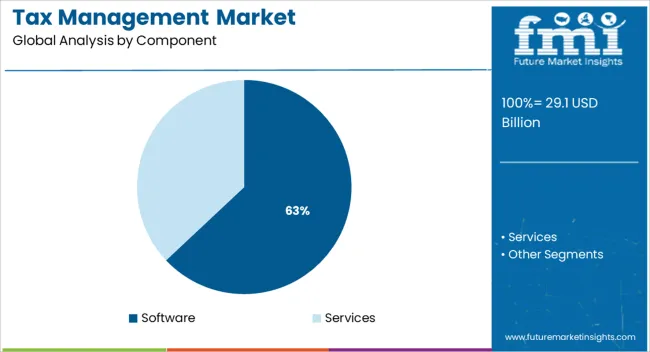
Tax management market revenue through the software segment is forecasted to grow at the highest CAGR of around 10.6% during 2022-2032. Tax management software makes it easier for businesses of all sizes to complete corporate tax filings. Furthermore, the intricacy of the current taxation system, as well as the expansion of electronic payments on a larger scale, has opened new possibilities for key industry players to expand their offers.

Tax Management Software assists financial institutions and enterprises in analyzing the huge quantity of data generated by financial transactions and assisting firms in making decisions. Tax and customs agencies acquire data concerning Goods and Services Tax (GST) and Value Added Tax (VAT) payers through financial transactions.

Moreover, tax administrations are digitally processing and analyzing financial data derived from indirect taxation. This program includes tax administrators conducting VAT/GST audits using data pulled from taxpayer systems. As a result, the use of data analytics techniques to enhance eVAT/GST compliance is viewed as an emerging driver of tax management software market growth.

For example, in July 2017, Spain implemented the Immediate Requirement of Information Act, which permitted all taxpayers to transmit data connected to VAT bills in real-time.

Which Deployment Mode of Tax Management is expected to Score Highest Growth in the Coming Years?

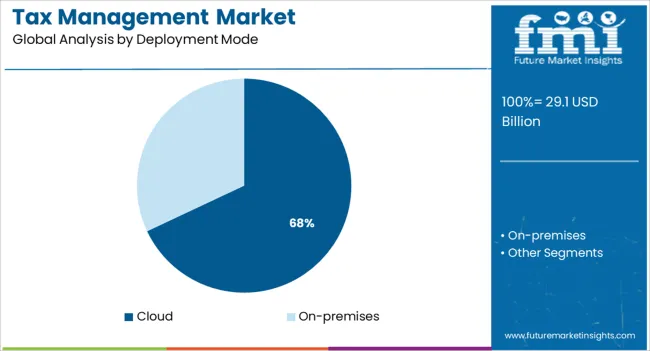
The Cloud segment is forecasted to grow at the highest CAGR of around 9.9% during 2022-2032. To make storage and computation more mobile and decentralized and facilitate data backup and recovery, companies prefer to use cloud-based tax management systems.

However, security and privacy issues deter businesses from obtaining cloud-based services. However, the effectiveness of the services' security is being reported by third parties as the best and most complete.

Rapid advancements in cloud computing, with encryption as a chief focal point, and memory maintenance and support costs growing with the increase of on-premises techniques, will fuel the global market for cloud-based tax administration software.

Competitive Analysis

Businesses are focusing on organic growth strategies such as product approvals and non-disclosure agreements. Acquisitions, partnerships, and collaborations are among the inorganic growth procedures seen in the company.

With increased demand in the worldwide industry, market players in the Tax Management industry are expected to benefit from growth prospects in the future. Some of the recent developments in the Tax Management market include:

  • In November 2021, Thomson Reuters joined forces with Deloitte Tax, a prominent provider of audit, consultancy, tax, and advisory services. The collaboration would aid company tax as well as legal departments throughout the world in their operations. Furthermore, the collaboration would offer solutions for legal departments and in-house tax to deal with the growing issues posed by global compliance and regulatory obligations, and the pressing urge to become more efficient, agile, and digital.
  • In September 2021, Automatic Data Processing (ADP) announced 'Run by ADP,' a program designed to help small businesses expand. This payroll software is user-friendly, with interactive search options, a simplified user interface, and a customized dashboard, saving small companies’ time and effort. In addition, the business introduced the 'Roll by ADP' mobile application, which transforms static spreadsheets into interactive chat help.
  • In November 2021, Avalara, Inc., a leading supplier of cloud-based taxpayer compliance management for businesses of all kinds, announced that its cross-border compliance capabilities will enable the new duty and import tax capabilities of Shopify Markets, the company's global commerce centre. The added duty and import tax capability, which is part of Shopify Markets, combines Avalara technology and information to provide landed cost pricing to assess duty and import tax obligations for above 180 countries. Avalara recently announced the purchase of 3CE Technologies, a firm that supplies commercial enterprises and government organizations with Harmonized System (HS) commodities categorization codes and verification solutions.

Similarly, recent developments related to companies in Tax Management Market have been tracked by the team at Future Market Insights, which are available in the full report.

Market Segments Covered In Tax Management Market Analysis

By Component:

  • Software
  • Services

Deployment Mode:

  • Cloud
  • On-premises

By Organization Size:

  • Small and Medium-sized Enterprises (SMEs)
  • Large Enterprises

By Tax Type:

  • Indirect Tax
  • Direct Tax

By Vertical:

  • Banking, Financial Services and Insurance (BFSI)
  • Information Technology (IT) and Telecom
  • Manufacturing
  • Energy and Utilities
  • Retail
  • Healthcare and Life Sciences
  • Media and Entertainment
  • Others

By Region:

  • North America
  • Europe
  • Asia Pacific
  • Middle East and Africa
  • Latin America

Frequently Asked Questions

How much is the current worth of the Tax Management Market?

The global Tax Management Market is worth more than US$ 18.9 Bn at present.

What is the sales forecast for Tax Management Market?

The value of the Tax Management Market is projected to increase at a CAGR of around 11.3% during 2022 – 2032.

What was the last 6 year’s market CAGR?

The value of the Tax Management Market increased at a CAGR of around 13% during 2015 – 2021.

What is a key trend shaping the growth of Tax Management Market?

The increased quantity of digital transactions, the complexity of tax rules, and tax management providers' incorporation of blockchain technology are projected to affect the industry in the next years.

At what CAGR is sales of Tax Management Market going to register growth in the US?

The market for Tax Management Market in the US is projected to expand at a CAGR of around 10.6% during 2022 – 2032.

Table of Content

1. Executive Summary

    1.1. Global Market Outlook

    1.2. Summary of Statistics

    1.3. Key Market Characteristics & Attributes

    1.4. Analysis and Recommendations

2. Market Overview

    2.1. Market Coverage / Taxonomy

    2.2. Market Definition / Scope / Limitations

3. Market Risks and Trends Assessment

    3.1. Risk Assessment

        3.1.1. COVID-19 Crisis and Impact on Demand

        3.1.2. COVID-19 Impact Benchmark with Previous Crisis

        3.1.3. Impact on Market Value (US$ Mn)

        3.1.4. Assessment by Key Countries

        3.1.5. Assessment by Key Market Segments

        3.1.6. Action Points and Recommendation for Suppliers

    3.2. Key Trends Impacting the Market

    3.3. Formulation and Product Development Trends

4. Market Background

    4.1. Market By Country, US$ Mn

    4.2. Market Opportunity Assessment (US$ Mn)

        4.2.1. Total Available Market

        4.2.2. Serviceable Addressable Market

        4.2.3. Serviceable Obtainable Market

    4.3. Market Scenario Forecast

        4.3.1. Demand in optimistic Scenario

        4.3.2. Demand in Likely Scenario

        4.3.3. Demand in Conservative Scenario

    4.4. Investment Feasibility Analysis

        4.4.1. Investment in Established Markets

            4.4.1.1. In Short Term

            4.4.1.2. In Long Term

        4.4.2. Investment in Emerging Markets

            4.4.2.1. In Short Term

            4.4.2.2. In Long Term

    4.5. Forecast Factors - Relevance & Impact

        4.5.1. Top Companies Historical Growth

        4.5.2. Global Market Growth

        4.5.3. Adoption Rate, By Country

    4.6. Market Dynamics

        4.6.1. Market Driving Factors and Impact Assessment

        4.6.2. Prominent Market Challenges and Impact Assessment

        4.6.3. Market Opportunities

        4.6.4. Prominent Trends in the Global Market & Their Impact Assessment

5. Key Success Factors

    5.1. Manufacturers’ Focus on Low Penetration High Growth Markets

    5.2. Banking on with Segments High Incremental Opportunity

    5.3. Peer Benchmarking

6. Global Market Demand Analysis 2015-2021 and Forecast, 2022-2032

    6.1. Historical Market Analysis, 2015-2021

    6.2. Current and Future Market Projections, 2022-2032

    6.3. Y-o-Y Growth Trend Analysis

7. Global Market Value Analysis 2015-2021 and Forecast, 2022-2032

    7.1. Historical Market Value (US$ Mn) Analysis, 2015-2021

    7.2. Current and Future Market Value (US$ Mn) Projections, 2022-2032

        7.2.1. Y-o-Y Growth Trend Analysis

        7.2.2. Absolute $ Opportunity Analysis

8. Global Market Analysis 2015-2021 and Forecast 2022-2032, By Component

    8.1. Introduction / Key Findings

    8.2. Historical Market Value (US$ Mn) and Analysis By Component, 2015-2021

    8.3. Current and Future Market Value (US$ Mn) and Analysis and Forecast By Component, 2022-2032

        8.3.1. Software

        8.3.2. Services

    8.4. Market Attractiveness Analysis By Component

9. Global Market Analysis 2015-2021 and Forecast 2022-2032, By Organization Size

    9.1. Introduction / Key Findings

    9.2. Historical Market Value (US$ Mn) and Analysis By Organization Size, 2015-2021

    9.3. Current and Future Market Value (US$ Mn) and Analysis and Forecast By Organization Size, 2022-2032

        9.3.1. Large Enterprises

        9.3.2. Small and Medium-Sized Enterprises(SMEs)

    9.4. Market Attractiveness Analysis By Organization Size

10. Global Market Analysis 2015-2021 and Forecast 2022-2032, By Deployment Mode

    10.1. Introduction / Key Findings

    10.2. Historical Market Value (US$ Mn) and Analysis By Deployment Mode, 2015-2021

    10.3. Current and Future Market Value (US$ Mn) and Analysis and Forecast By Deployment Mode, 2022-2032

        10.3.1. Cloud

        10.3.2. On-premises

    10.4. Market Attractiveness Analysis By Deployment Mode

11. Global Market Analysis 2015-2021 and Forecast 2022-2032, By Vertical

    11.1. Introduction / Key Findings

    11.2. Historical Market Value (US$ Mn) and Analysis By Vertical, 2015-2021

    11.3. Current and Future Market Value (US$ Mn) and Analysis and Forecast By Vertical, 2022-2032

        11.3.1. Banking, Financial Services and Insurance (BFSI)

        11.3.2. Information Technology (IT) and Telecom

        11.3.3. Manufacturing

        11.3.4. Energy and Utilities

        11.3.5. Retail

        11.3.6. Healthcare and Life Sciences

        11.3.7. Media and Entertainment

        11.3.8. Others (Real Estate and Construction, and Transportation and Logistics)

    11.4. Market Attractiveness Analysis By Vertical

12. Global Market Analysis 2015-2021 and Forecast 2022-2032, By Tax Type

    12.1. Introduction / Key Findings

    12.2. Historical Market Value (US$ Mn) and Analysis By Tax Type, 2015-2021

    12.3. Current and Future Market Value (US$ Mn) and Analysis and Forecast By Tax Type, 2022-2032

        12.3.1. Indirect Tax

        12.3.2. Direct Tax

    12.4. Market Attractiveness Analysis By Tax Type

13. Global Market Analysis 2015-2021 and Forecast 2022-2032, By Region

    13.1. Introduction

    13.2. Historical Market Value (US$ Mn) and Analysis By Region, 2015-2021

    13.3. Current Market Size (US$ Mn) & Analysis and Forecast By Region, 2022-2032

        13.3.1. North America

        13.3.2. Latin America

        13.3.3. Europe

        13.3.4. Asia Pacific

        13.3.5. Middle East and Africa (MEA)

    13.4. Market Attractiveness Analysis By Region

14. North America Market Analysis 2015-2021 and Forecast 2022-2032

    14.1. Introduction

    14.2. Pricing Analysis

    14.3. Historical Market Value (US$ Mn) and Trend Analysis By Market Taxonomy, 2015-2021

    14.4. Market Value (US$ Mn) & Forecast By Market Taxonomy, 2022-2032

        14.4.1. By Country

            14.4.1.1. U.S.

            14.4.1.2. Canada

        14.4.2. By Deployment Mode

        14.4.3. By Component

        14.4.4. By Organization Size

        14.4.5. By Vertical

        14.4.6. By Tax Type

    14.5. Market Attractiveness Analysis

        14.5.1. By Country

        14.5.2. By Deployment Mode

        14.5.3. By Component

        14.5.4. By Organization Size

        14.5.5. By Vertical

        14.5.6. By Tax Type

15. Latin America Market Analysis 2015-2021 and Forecast 2022-2032

    15.1. Introduction

    15.2. Pricing Analysis

    15.3. Historical Market Value (US$ Mn) and Trend Analysis By Market Taxonomy, 2015-2021

    15.4. Market Value (US$ Mn) & Forecast By Market Taxonomy, 2022-2032

        15.4.1. By Country

            15.4.1.1. Brazil

            15.4.1.2. Mexico

            15.4.1.3. Rest of Latin America

        15.4.2. By Deployment Mode

        15.4.3. By Component

        15.4.4. By Organization Size

        15.4.5. By Vertical

        15.4.6. By Tax Type

    15.5. Market Attractiveness Analysis

        15.5.1. By Country

        15.5.2. By Deployment Mode

        15.5.3. By Component

        15.5.4. By Organization Size

        15.5.5. By Vertical

        15.5.6. By Tax Type

16. Europe Market Analysis 2015-2021 and Forecast 2022-2032

    16.1. Introduction

    16.2. Pricing Analysis

    16.3. Historical Market Value (US$ Mn) and Trend Analysis By Market Taxonomy, 2015-2021

    16.4. Market Value (US$ Mn) & Forecast By Market Taxonomy, 2022-2032

        16.4.1. By Country

            16.4.1.1. Germany

            16.4.1.2. France

            16.4.1.3. U.K.

            16.4.1.4. Italy

            16.4.1.5. Russia

            16.4.1.6. Rest of Europe

        16.4.2. By Deployment Mode

        16.4.3. By Component

        16.4.4. By Organization Size

        16.4.5. By Vertical

        16.4.6. By Tax Type

    16.5. Market Attractiveness Analysis

        16.5.1. By Country

        16.5.2. By Deployment Mode

        16.5.3. By Component

        16.5.4. By Organization Size

        16.5.5. By Vertical

        16.5.6. By Tax Type

17. Asia Pacific Market Analysis 2015-2021 and Forecast 2022-2032

    17.1. Introduction

    17.2. Pricing Analysis

    17.3. Historical Market Value (US$ Mn) and Trend Analysis By Market Taxonomy, 2015-2021

    17.4. Market Value (US$ Mn) & Forecast By Market Taxonomy, 2022-2032

        17.4.1. By Country

            17.4.1.1. China

            17.4.1.2. Japan

            17.4.1.3. South Korea

            17.4.1.4. Rest of Asia Pacific

        17.4.2. By Deployment Mode

        17.4.3. By Component

        17.4.4. By Organization Size

        17.4.5. By Vertical

        17.4.6. By Tax Type

    17.5. Market Attractiveness Analysis

        17.5.1. By Country

        17.5.2. By Deployment Mode

        17.5.3. By Component

        17.5.4. By Organization Size

        17.5.5. By Vertical

        17.5.6. By Tax Type

18. Middle East and Africa Market Analysis 2015-2021 and Forecast 2022-2032

    18.1. Introduction

    18.2. Pricing Analysis

    18.3. Historical Market Value (US$ Mn) and Trend Analysis By Market Taxonomy, 2015-2021

    18.4. Market Value (US$ Mn) & Forecast By Market Taxonomy, 2022-2032

        18.4.1. By Country

            18.4.1.1. GCC Countries

            18.4.1.2. South Africa

            18.4.1.3. Turkey

            18.4.1.4. Rest of Middle East and Africa

        18.4.2. By Deployment Mode

        18.4.3. By Component

        18.4.4. By Organization Size

        18.4.5. By Vertical

        18.4.6. By Tax Type

    18.5. Market Attractiveness Analysis

        18.5.1. By Country

        18.5.2. By Deployment Mode

        18.5.3. By Component

        18.5.4. By Organization Size

        18.5.5. By Vertical

        18.5.6. By Tax Type

19. Key Countries Market Analysis 2015-2021 and Forecast 2022-2032

    19.1. Introduction

        19.1.1. Market Value Proportion Analysis, By Key Countries

        19.1.2. Global Vs. Country Growth Comparison

    19.2. US Market Analysis

        19.2.1. Value Proportion Analysis by Market Taxonomy

        19.2.2. Value & Analysis and Forecast by Market Taxonomy, 2015-2032

            19.2.2.1. By Deployment Mode

            19.2.2.2. By Component

            19.2.2.3. By Organization Size

            19.2.2.4. By Vertical

            19.2.2.5. By Tax Type

    19.3. Canada Market Analysis

        19.3.1. Value Proportion Analysis by Market Taxonomy

        19.3.2. Value & Analysis and Forecast by Market Taxonomy, 2015-2032

            19.3.2.1. By Deployment Mode

            19.3.2.2. By Component

            19.3.2.3. By Organization Size

            19.3.2.4. By Vertical

            19.3.2.5. By Tax Type

    19.4. Mexico Market Analysis

        19.4.1. Value Proportion Analysis by Market Taxonomy

        19.4.2. Value & Analysis and Forecast by Market Taxonomy, 2015-2032

            19.4.2.1. By Deployment Mode

            19.4.2.2. By Component

            19.4.2.3. By Organization Size

            19.4.2.4. By Vertical

            19.4.2.5. By Tax Type

    19.5. Brazil Market Analysis

        19.5.1. Value Proportion Analysis by Market Taxonomy

        19.5.2. Value & Analysis and Forecast by Market Taxonomy, 2015-2032

            19.5.2.1. By Deployment Mode

            19.5.2.2. By Component

            19.5.2.3. By Organization Size

            19.5.2.4. By Vertical

            19.5.2.5. By Tax Type

    19.6. Germany Market Analysis

        19.6.1. Value Proportion Analysis by Market Taxonomy

        19.6.2. Value & Analysis and Forecast by Market Taxonomy, 2015-2032

            19.6.2.1. By Deployment Mode

            19.6.2.2. By Component

            19.6.2.3. By Organization Size

            19.6.2.4. By Vertical

            19.6.2.5. By Tax Type

    19.7. France Market Analysis

        19.7.1. Value Proportion Analysis by Market Taxonomy

        19.7.2. Value & Analysis and Forecast by Market Taxonomy, 2015-2032

            19.7.2.1. By Deployment Mode

            19.7.2.2. By Component

            19.7.2.3. By Organization Size

            19.7.2.4. By Vertical

            19.7.2.5. By Tax Type

    19.8. Italy Market Analysis

        19.8.1. Value Proportion Analysis by Market Taxonomy

        19.8.2. Value & Analysis and Forecast by Market Taxonomy, 2015-2032

            19.8.2.1. By Deployment Mode

            19.8.2.2. By Component

            19.8.2.3. By Organization Size

            19.8.2.4. By Vertical

            19.8.2.5. By Tax Type

    19.9. Russia Market Analysis

        19.9.1. Value Proportion Analysis by Market Taxonomy

        19.9.2. Value & Analysis and Forecast by Market Taxonomy, 2015-2032

            19.9.2.1. By Deployment Mode

            19.9.2.2. By Component

            19.9.2.3. By Organization Size

            19.9.2.4. By Vertical

            19.9.2.5. By Tax Type

    19.10. UK Market Analysis

        19.10.1. Value Proportion Analysis by Market Taxonomy

        19.10.2. Value & Analysis and Forecast by Market Taxonomy, 2015-2032

            19.10.2.1. By Deployment Mode

            19.10.2.2. By Component

            19.10.2.3. By Organization Size

            19.10.2.4. By Vertical

            19.10.2.5. By Tax Type

    19.11. China Market Analysis

        19.11.1. Value Proportion Analysis by Market Taxonomy

        19.11.2. Value & Analysis and Forecast by Market Taxonomy, 2015-2032

            19.11.2.1. By Deployment Mode

            19.11.2.2. By Component

            19.11.2.3. By Organization Size

            19.11.2.4. By Vertical

            19.11.2.5. By Tax Type

    19.12. Japan Market Analysis

        19.12.1. Value Proportion Analysis by Market Taxonomy

        19.12.2. Value & Analysis and Forecast by Market Taxonomy, 2015-2032

            19.12.2.1. By Deployment Mode

            19.12.2.2. By Component

            19.12.2.3. By Organization Size

            19.12.2.4. By Vertical

            19.12.2.5. By Tax Type

    19.13. South Korea Market Analysis

        19.13.1. Value Proportion Analysis by Market Taxonomy

        19.13.2. Value & Analysis and Forecast by Market Taxonomy, 2015-2032

            19.13.2.1. By Deployment Mode

            19.13.2.2. By Component

            19.13.2.3. By Organization Size

            19.13.2.4. By Vertical

            19.13.2.5. By Tax Type

    19.14. GCC Countries Market Analysis

        19.14.1. Value Proportion Analysis by Market Taxonomy

        19.14.2. Value & Analysis and Forecast by Market Taxonomy, 2015-2032

            19.14.2.1. By Deployment Mode

            19.14.2.2. By Component

            19.14.2.3. By Organization Size

            19.14.2.4. By Vertical

            19.14.2.5. By Tax Type

    19.15. South Africa Market Analysis

        19.15.1. Value Proportion Analysis by Market Taxonomy

        19.15.2. Value & Analysis and Forecast by Market Taxonomy, 2015-2032

            19.15.2.1. By Deployment Mode

            19.15.2.2. By Component

            19.15.2.3. By Organization Size

            19.15.2.4. By Vertical

            19.15.2.5. By Tax Type

    19.16. Turkey Market Analysis

        19.16.1. Value Proportion Analysis by Market Taxonomy

        19.16.2. Value & Analysis and Forecast by Market Taxonomy, 2015-2032

            19.16.2.1. By Deployment Mode

            19.16.2.2. By Component

            19.16.2.3. By Organization Size

            19.16.2.4. By Vertical

            19.16.2.5. By Tax Type

        19.16.3. Competition Landscape and Player Concentration in the Country

20. Market Structure Analysis

    20.1. Market Analysis by Tier of Companies

    20.2. Market Concentration

    20.3. Market Share Analysis of Top Players

    20.4. Market Presence Analysis

        20.4.1. By Regional footprint of Players

        20.4.2. Product footprint by Players

21. Competition Analysis

    21.1. Competition Dashboard

    21.2. Competition Benchmarking

    21.3. Competition Deep Dive

        21.3.1. Avalara

            21.3.1.1. Overview

            21.3.1.2. Product Portfolio

            21.3.1.3. Sales Footprint

            21.3.1.4. Strategy Overview

        21.3.2. Automatic Data Processing(ADP)

            21.3.2.1. Overview

            21.3.2.2. Product Portfolio

            21.3.2.3. Sales Footprint

            21.3.2.4. Strategy Overview

        21.3.3. Intuit

            21.3.3.1. Overview

            21.3.3.2. Product Portfolio

            21.3.3.3. Sales Footprint

            21.3.3.4. Strategy Overview

        21.3.4. SAP

            21.3.4.1. Overview

            21.3.4.2. Product Portfolio

            21.3.4.3. Sales Footprint

            21.3.4.4. Strategy Overview

        21.3.5. Thomson Reuters

            21.3.5.1. Overview

            21.3.5.2. Product Portfolio

            21.3.5.3. Sales Footprint

            21.3.5.4. Strategy Overview

        21.3.6. Wolters Kluwer N.V.

            21.3.6.1. Overview

            21.3.6.2. Product Portfolio

            21.3.6.3. Sales Footprint

            21.3.6.4. Strategy Overview

        21.3.7. Blucora

            21.3.7.1. Overview

            21.3.7.2. Product Portfolio

            21.3.7.3. Sales Footprint

            21.3.7.4. Strategy Overview

        21.3.8. Sovos ShipCompliant

            21.3.8.1. Overview

            21.3.8.2. Product Portfolio

            21.3.8.3. Sales Footprint

            21.3.8.4. Strategy Overview

        21.3.9. DAVO Technologies

            21.3.9.1. Overview

            21.3.9.2. Product Portfolio

            21.3.9.3. Sales Footprint

            21.3.9.4. Strategy Overview

        21.3.10. Drake Software

            21.3.10.1. Overview

            21.3.10.2. Product Portfolio

            21.3.10.3. Sales Footprint

            21.3.10.4. Strategy Overview

22. Assumptions and Acronyms Used

23. Research Methodology

Don't pay for what you don't need

Customize your report by selecting specific countries or regions and save 30%!

List of Tables

Table 01: Global Market Value (US$ Mn), By Deployment Mode, 2015 – 2021

Table 02: Global Market Value (US$ Mn), By Deployment Mode, 2022 – 2032

Table 03: Global Market Value (US$ Mn), By Component, 2015 – 2021

Table 04: Global Market Value (US$ Mn), By Component, 2022 – 2032

Table 05: Global Market Value (US$ Mn), By Organization Size, 2015 – 2021

Table 06: Global Market Value (US$ Mn), By Organization Size, 2022 – 2032

Table 07: Global Market Value (US$ Mn), By Tax Type, 2015 – 2021

Table 08: Global Market Value (US$ Mn), By Tax Type, 2022 – 2032

Table 09: Global Market Value (US$ Mn), By Vertical, 2015 – 2021

Table 10: Global Market Value (US$ Mn), By Vertical, 2022 – 2032

Table 11: Global Market, By Region, 2015 – 2021

Table 12: Global Market, By Region, 2022 – 2032

Table 13: North America Market Value (US$ Mn), By Deployment Mode, 2015 – 2021

Table 14: North America Market Value (US$ Mn), By Deployment Mode, 2022 – 2032

Table 15: North America Market Value (US$ Mn), By Component, 2015 – 2021

Table 16: North America Market Value (US$ Mn), By Component, 2022 – 2032

Table 17: North America Market Value (US$ Mn), By Organization Size, 2015 – 2021

Table 18: North America Market Value (US$ Mn), By Organization Size, 2022 – 2032

Table 19: North America Market Value (US$ Mn), By Tax Type, 2015 – 2021

Table 20: North America Market Value (US$ Mn), By Tax Type, 2022 – 2032

Table 21: North America Market Value (US$ Mn), By Vertical, 2015 – 2021

Table 22: North America Market Value (US$ Mn), By Vertical, 2022 – 2032

Table 23: North America Market, By Country, 2015 – 2021

Table 24: North America Market, By Country, 2022 – 2032

Table 25: Latin America Market Value (US$ Mn), By Deployment Mode, 2015 – 2021

Table 26: Latin America Market Value (US$ Mn), By Deployment Mode, 2022 – 2032

Table 27: Latin America Market Value (US$ Mn), By Component, 2015 – 2021

Table 28: Latin America Market Value (US$ Mn), By Component, 2022 – 2032

Table 29: Latin America Market Value (US$ Mn), By Organization Size, 2015 – 2021

Table 30: Latin America Market Value (US$ Mn), By Organization Size, 2022 – 2032

Table 31: Latin America Market Value (US$ Mn), By Tax Type, 2015 – 2021

Table 32: Latin America Market Value (US$ Mn), By Tax Type, 2022 – 2032

Table 33: Latin America Market Value (US$ Mn), By Vertical, 2015 – 2021

Table 34: Latin America Market Value (US$ Mn), By Vertical, 2022 – 2032

Table 35: Latin America Market, By Country, 2015 – 2021

Table 36: Latin America Market, By Country, 2022 – 2032

Table 37: Europe Market Value (US$ Mn), By Deployment Mode, 2015 – 2021

Table 38: Europe Market Value (US$ Mn), By Deployment Mode, 2022 – 2032

Table 39: Europe Market Value (US$ Mn), By Component, 2015 – 2021

Table 40: Europe Market Value (US$ Mn), By Component, 2022 – 2032

Table 41: Europe Market Value (US$ Mn), By Organization Size, 2015 – 2021

Table 42: Europe Market Value (US$ Mn), By Organization Size, 2022 – 2032

Table 43: Europe Market Value (US$ Mn), By Tax Type, 2015 – 2021

Table 44: Europe Market Value (US$ Mn), By Tax Type, 2022 – 2032

Table 45: Europe Market Value (US$ Mn), By Vertical, 2015 – 2021

Table 46: Europe Market Value (US$ Mn), By Vertical, 2022 – 2032

Table 47: Europe Market, By Country, 2015 – 2021

Table 48: Europe Market, By Country, 2022 – 2032

Table 49: Asia Pacific Market Value (US$ Mn), By Deployment Mode, 2015 – 2021

Table 50: Asia Pacific Market Value (US$ Mn), By Deployment Mode, 2022 – 2032

Table 51: Asia Pacific Market Value (US$ Mn), By Component, 2015 – 2021

Table 52: Asia Pacific Market Value (US$ Mn), By Component, 2022 – 2032

Table 53: Asia Pacific Market Value (US$ Mn), By Organization Size, 2015 – 2021

Table 54: Asia Pacific Market Value (US$ Mn), By Organization Size, 2022 – 2032

Table 55: Asia Pacific Market Value (US$ Mn), By Tax Type, 2015 – 2021

Table 56: Asia Pacific Market Value (US$ Mn), By Tax Type, 2022 – 2032

Table 57: Asia Pacific Market Value (US$ Mn), By Vertical, 2015 – 2021

Table 58: Asia Pacific Market Value (US$ Mn), By Vertical, 2022 – 2032

Table 59: Asia Pacific Market, By Country, 2015 – 2021

Table 60: Asia Pacific Market, By Country, 2022 – 2032

Table 61: MEA Market Value (US$ Mn), By Deployment Mode, 2015 – 2021

Table 62: MEA Market Value (US$ Mn), By Deployment Mode, 2022 – 2032

Table 63: MEA Market Value (US$ Mn), By Component, 2015 – 2021

Table 64: MEA Market Value (US$ Mn), By Component, 2022 – 2032

Table 65: MEA Market Value (US$ Mn), By Organization Size, 2015 – 2021

Table 66: MEA Market Value (US$ Mn), By Organization Size, 2022 – 2032

Table 67: MEA Market Value (US$ Mn), By Tax Type, 2015 – 2021

Table 68: MEA Market Value (US$ Mn), By Tax Type, 2022 – 2032

Table 69: MEA Market Value (US$ Mn), By Vertical, 2015 – 2021

Table 70: MEA Market Value (US$ Mn), By Vertical, 2022 – 2032

Table 71: MEA Market, By Country, 2015 – 2021

Table 72: MEA Market, By Country, 2022 – 2032
Sudip Saha
Sudip Saha

Principal Consultant

Talk to Analyst

Find your sweet spots for generating winning opportunities in this market.

List of Charts

Figure 01: Global Market Value (US$ Mn) and Year-on-Year Growth, 2015-2032

Figure 02: Global Market Absolute $ Historical Gain (2015 - 2021) and Opportunity (2022 – 2032), US$ Mn

Figure 03: Global Market Share, By Deployment Mode, 2022 & 2032

Figure 04: Global Market Y-o-Y Growth Projections, By Deployment Mode – 2022-2032

Figure 05: Global Market Attractiveness Index, By Deployment Mode – 2022-2032

Figure 06: Global Market Share, By Component, 2022 & 2032

Figure 07: Global Market Y-o-Y Growth Projections, By Component – 2022-2032

Figure 08: Global Market Attractiveness Index, By Component – 2022-2032

Figure 09: Global Market Share, By Tax Type, 2022 & 2032

Figure 10: Global Market Y-o-Y Growth Projections, By Tax Type – 2022-2032

Figure 11: Global Market Attractiveness Index, By Tax Type – 2022-2032

Figure 12: Global Market Share, By Organization Size, 2022 & 2032

Figure 13: Global Market Y-o-Y Growth Projections, By Organization Size – 2022-2032

Figure 14: Global Market Attractiveness Index, By Organization Size – 2022-2032

Figure 15: Global Market Share, By Vertical, 2022 & 2032

Figure 16: Global Market Y-o-Y Growth Projections, By Vertical – 2022-2032

Figure 17: Global Market Attractiveness Index, By Vertical – 2022-2032

Figure 18: Global Market Share, By Region, 2022 & 2032

Figure 19: Global Market Y-o-Y Growth Projections, By Region – 2022-2032

Figure 20: Global Market Attractiveness Index, By Region – 2022-2032

Figure 21: North America Market Value (US$ Mn) and Year-on-Year Growth, 2015-2032

Figure 22: North America Market Absolute $ Historical Gain (2015 - 2021) and Opportunity (2022 – 2032), US$ Mn

Figure 23: North America Market Share, By Deployment Mode, 2022 & 2032

Figure 24: North America Market Y-o-Y Growth Projections, By Deployment Mode – 2022-2032

Figure 25: North America Market Attractiveness Index, By Deployment Mode – 2022-2032

Figure 26: North America Market Share, By Component, 2022 & 2032

Figure 27: North America Market Y-o-Y Growth Projections, By Component – 2022-2032

Figure 28: North America Market Attractiveness Index, By Component – 2022-2032

Figure 29: North America Market Share, By Tax Type, 2022 & 2032

Figure 30: North America Market Y-o-Y Growth Projections, By Tax Type – 2022-2032

Figure 31: North America Market Attractiveness Index, By Tax Type – 2022-2032

Figure 32: North America Market Share, By Organization Size, 2022 & 2032

Figure 33: North America Market Y-o-Y Growth Projections, By Organization Size – 2022-2032

Figure 34: North America Market Attractiveness Index, By Organization Size – 2022-2032

Figure 35: North America Market Share, By Vertical, 2022 & 2032

Figure 36: North America Market Y-o-Y Growth Projections, By Vertical – 2022-2032

Figure 37: North America Market Attractiveness Index, By Vertical – 2022-2032

Figure 38: North America Market Share, By Country, 2022 & 2032

Figure 39: North America Market Y-o-Y Growth Projections, By Country – 2022-2032

Figure 40: North America Market Attractiveness Index, By Country – 2022-2032

Figure 41: Latin America Market Value (US$ Mn) and Year-on-Year Growth, 2015-2032

Figure 42: Latin America Market Absolute $ Historical Gain (2015 - 2021) and Opportunity (2022 – 2032), US$ Mn

Figure 43: Latin America Market Share, By Deployment Mode, 2022 & 2032

Figure 44: Latin America Market Y-o-Y Growth Projections, By Deployment Mode – 2022-2032

Figure 45: Latin America Market Attractiveness Index, By Deployment Mode – 2022-2032

Figure 46: Latin America Market Share, By Component, 2022 & 2032

Figure 47: Latin America Market Y-o-Y Growth Projections, By Component – 2022-2032

Figure 48: Latin America Market Attractiveness Index, By Component – 2022-2032

Figure 49: Latin America Market Share, By Tax Type, 2022 & 2032

Figure 50: Latin America Market Y-o-Y Growth Projections, By Tax Type – 2022-2032

Figure 51: Latin America Market Attractiveness Index, By Tax Type – 2022-2032

Figure 52: Latin America Market Share, By Organization Size, 2022 & 2032

Figure 53: Latin America Market Y-o-Y Growth Projections, By Organization Size – 2022-2032

Figure 54: Latin America Market Attractiveness Index, By Organization Size – 2022-2032

Figure 55: Latin America Market Share, By Vertical, 2022 & 2032

Figure 56: Latin America Market Y-o-Y Growth Projections, By Vertical – 2022-2032

Figure 57: Latin America Market Attractiveness Index, By Vertical – 2022-2032

Figure 58: Latin America Market Share, By Country, 2022 & 2032

Figure 59: Latin America Market Y-o-Y Growth Projections, By Country – 2022-2032

Figure 60: Latin America Market Attractiveness Index, By Country – 2022-2032

Figure 61: Europe Market Value (US$ Mn) and Year-on-Year Growth, 2015-2032

Figure 62: Europe Market Absolute $ Historical Gain (2015 - 2021) and Opportunity (2022 – 2032), US$ Mn

Figure 63: Europe Market Share, By Deployment Mode, 2022 & 2032

Figure 64: Europe Market Y-o-Y Growth Projections, By Deployment Mode – 2022-2032

Figure 65: Europe Market Attractiveness Index, By Deployment Mode – 2022-2032

Figure 66: Europe Market Share, By Component, 2022 & 2032

Figure 67: Europe Market Y-o-Y Growth Projections, By Component – 2022-2032

Figure 68: Europe Market Attractiveness Index, By Component – 2022-2032

Figure 69: Europe Market Share, By Tax Type, 2022 & 2032

Figure 70: Europe Market Y-o-Y Growth Projections, By Tax Type – 2022-2032

Figure 71: Europe Market Attractiveness Index, By Tax Type – 2022-2032

Figure 72: Europe Market Share, By Organization Size, 2022 & 2032

Figure 73: Europe Market Y-o-Y Growth Projections, By Organization Size – 2022-2032

Figure 74: Europe Market Attractiveness Index, By Organization Size – 2022-2032

Figure 75: Europe Market Share, By Vertical, 2022 & 2032

Figure 76: Europe Market Y-o-Y Growth Projections, By Vertical – 2022-2032

Figure 77: Europe Market Attractiveness Index, By Vertical – 2022-2032

Figure 78: Europe Market Share, By Country, 2022 & 2032

Figure 79: Europe Market Y-o-Y Growth Projections, By Country – 2022-2032

Figure 80: Europe Market Attractiveness Index, By Country – 2022-2032

Figure 81: Asia Pacific Market Value (US$ Mn) and Year-on-Year Growth, 2015-2032

Figure 82: Asia Pacific Market Absolute $ Historical Gain (2015 - 2021) and Opportunity (2022 – 2032), US$ Mn

Figure 83: Asia Pacific Market Share, By Deployment Mode, 2022 & 2032

Figure 84: Asia Pacific Market Y-o-Y Growth Projections, By Deployment Mode – 2022-2032

Figure 85: Asia Pacific Market Attractiveness Index, By Deployment Mode – 2022-2032

Figure 86: Asia Pacific Market Share, By Component, 2022 & 2032

Figure 87: Asia Pacific Market Y-o-Y Growth Projections, By Component – 2022-2032

Figure 88: Asia Pacific Market Attractiveness Index, By Component – 2022-2032

Figure 89: Asia Pacific Market Share, By Tax Type, 2022 & 2032

Figure 90: Asia Pacific Market Y-o-Y Growth Projections, By Tax Type – 2022-2032

Figure 91: Asia Pacific Market Attractiveness Index, By Tax Type – 2022-2032

Figure 92: Asia Pacific Market Share, By Organization Size, 2022 & 2032

Figure 93: Asia Pacific Market Y-o-Y Growth Projections, By Organization Size – 2022-2032

Figure 94: Asia Pacific Market Attractiveness Index, By Organization Size – 2022-2032

Figure 95: Asia Pacific Market Share, By Vertical, 2022 & 2032

Figure 96: Asia Pacific Market Y-o-Y Growth Projections, By Vertical – 2022-2032

Figure 97: Asia Pacific Market Attractiveness Index, By Vertical – 2022-2032

Figure 98: Asia Pacific Market Share, By Country, 2022 & 2032

Figure 99: Asia Pacific Market Y-o-Y Growth Projections, By Country – 2022-2032

Figure 100: Asia Pacific Market Attractiveness Index, By Country – 2022-2032

Figure 101: MEA Market Value (US$ Mn) and Year-on-Year Growth, 2015-2032

Figure 102: MEA Market Absolute $ Historical Gain (2015 - 2021) and Opportunity (2022 – 2032), US$ Mn

Figure 103: MEA Market Share, By Deployment Mode, 2022 & 2032

Figure 104: MEA Market Y-o-Y Growth Projections, By Deployment Mode – 2022-2032

Figure 105: MEA Market Attractiveness Index, By Deployment Mode – 2022-2032

Figure 106: MEA Market Share, By Component, 2022 & 2032

Figure 107: MEA Market Y-o-Y Growth Projections, By Component – 2022-2032

Figure 108: MEA Market Attractiveness Index, By Component – 2022-2032

Figure 109: MEA Market Share, By Tax Type, 2022 & 2032

Figure 110: MEA Market Y-o-Y Growth Projections, By Tax Type – 2022-2032

Figure 111: MEA Market Attractiveness Index, By Tax Type – 2022-2032

Figure 112: MEA Market Share, By Organization Size, 2022 & 2032

Figure 113: MEA Market Y-o-Y Growth Projections, By Organization Size – 2022-2032

Figure 114: MEA Market Attractiveness Index, By Organization Size – 2022-2032

Figure 115: MEA Market Share, By Vertical, 2022 & 2032

Figure 116: MEA Market Y-o-Y Growth Projections, By Vertical – 2022-2032

Figure 117: MEA Market Attractiveness Index, By Vertical – 2022-2032

Figure 118: MEA Market Share, By Country, 2022 & 2032

Figure 119: MEA Market Y-o-Y Growth Projections, By Country – 2022-2032

Figure 120: MEA Market Attractiveness Index, By Country – 2022-2032

Explore Technology Insights

View Reports