The power management system market is estimated to generate a market size of USD 6.96 billion in 2025 and is expected to reach USD 13.94 billion by 2035, reflecting a compound annual growth rate (CAGR) of 7.2% during the forecast period.
Power management systems are critical in ensuring the efficient distribution and consumption of energy across industries such as manufacturing, automotive, and telecommunications. These systems integrate hardware and software to monitor, control, and optimize the use of energy, making them essential for industries seeking to reduce energy costs, improve operational efficiency, and comply with stringent environmental regulations.
One of the key drivers of the market’s growth is the increasing emphasis on energy efficiency across both industrial and commercial sectors. With the growing focus on sustainability and the rising costs of energy, businesses are turning to power management systems to minimize waste and optimize energy consumption.
Additionally, governments worldwide are implementing stricter energy regulations and offering incentives for energy-saving initiatives, further propelling the adoption of power management systems. These systems help companies reduce their carbon footprints and achieve sustainability goals, making them an essential component of modern infrastructure.
Recent developments in the power management system market include the integration of advanced analytics, artificial intelligence (AI), and the Internet of Things (IoT) into power management solutions. These technologies enable real-time monitoring and predictive maintenance, improving the reliability and efficiency of energy systems. By collecting and analyzing data from various sources, businesses can gain actionable insights into their energy usage, helping them make informed decisions and reduce costs. Moreover, the rise of smart grid technology, which uses power management systems to enhance grid stability and manage renewable energy sources, is further driving market growth.

| Attribute | Value |
|---|---|
| Market Size in 2025 | USD 6.96 billion |
| Market Size in 2035 | USD 13.94 billion |
| CAGR (2025 to 2035) | 7.2% |
On May 21, 2025, ABB introduced its Battery Energy Storage Systems-as-a-Service (BESS-as-a-Service), a flexible, zero-CapEx solution designed to accelerate the shift to clean, resilient, and affordable energy. This service model removes financial and operational hurdles, helping companies diversify their energy mix without upfront investment and guaranteeing day-one returns. This was officially announced in the company's press release.
As the power management system market continues to expand, ongoing advancements in AI, IoT, and smart grid technologies are expected to play a significant role in shaping the future of energy management, driving further market growth and providing businesses with more efficient, sustainable energy solutions.
The global trade of power management systems is driven by rising demand for energy-efficient solutions across industrial, commercial, and residential sectors. Growth in renewable energy integration, smart grids, and electric vehicles further fuels international trade. The market features a mix of technology providers and system integrators exporting advanced solutions to meet regional energy management needs.
Major Exporting Countries:
Leading exporters include United States, Germany, China, Japan, and South Korea.
The United States and Germany are known for cutting-edge power management technologies and smart grid solutions. China dominates in volume with large-scale manufacturing capabilities and exports a broad range of systems catering to emerging markets. Japan and South Korea specialize in sophisticated control systems and energy storage integration.
Major Importing Countries:
Key importers include India, Brazil, United Kingdom, France, and Canada.
These countries import power management systems to support growing infrastructure upgrades, renewable energy projects, and smart city initiatives. India and Brazil are rapidly expanding their energy grids, creating significant demand for advanced power management solutions. Europe and North America import for modernization of existing grids and integration of distributed energy resources.
Power management systems are subject to comprehensive government regulations designed to ensure energy efficiency, safety, interoperability, and environmental sustainability. Regulatory frameworks promote the adoption of smart grid technologies, renewable energy integration, and reliable power distribution.
Energy Efficiency Standards
Governments enforce energy efficiency standards such as the U.S. Department of Energy (DOE) regulations, the European Union’s Energy Efficiency Directive, and similar national codes. These standards mandate power management systems to optimize energy consumption, reduce losses, and support demand response programs.
Grid Integration and Interoperability
Regulatory bodies require power management systems to comply with interoperability standards like IEEE 1547, IEC 61850, and NERC CIP to ensure seamless integration with existing grids, distributed energy resources, and smart devices. These standards facilitate secure communication and reliable grid operation.
Environmental Compliance
Power management solutions must adhere to environmental regulations such as the Restriction of Hazardous Substances (RoHS) Directive and REACH regulations to minimize the use of harmful materials. Compliance ensures eco-friendly manufacturing and disposal processes.
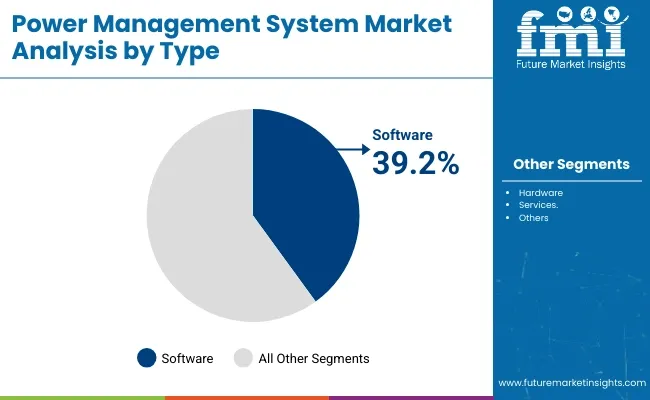
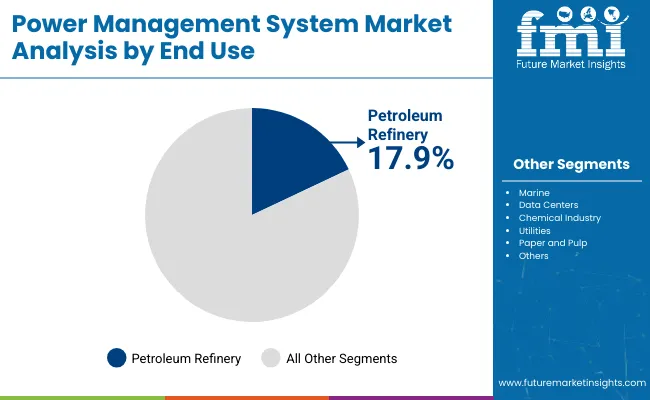
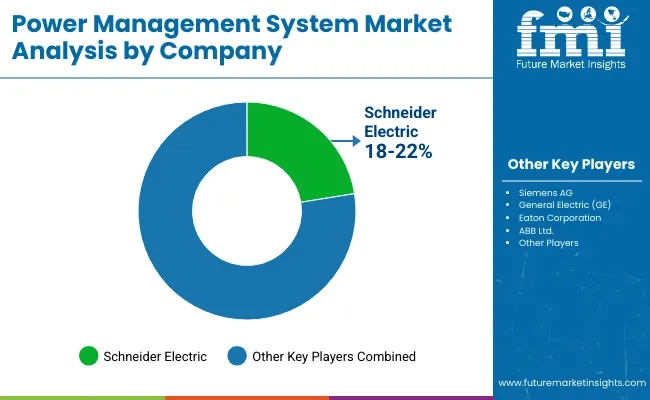
The global power management system market is set for consistent growth from 2025 to 2035, driven by the rising need for real-time energy monitoring and intelligent grid management. In 2025, software is projected to account for 39.2% of the type segment, while petroleum refineries are expected to hold 17.9% of the end-use segment. Key players include ABB, Schneider Electric, and Siemens.

The software segment is expected to capture 39.2% of the type segment market share in 2025. As industries increasingly prioritize operational efficiency, remote monitoring, and predictive maintenance, power management software is becoming essential to achieving real-time control over complex energy systems. These platforms allow seamless integration of multiple energy sources, enhance visibility, and help reduce both consumption and downtime.
Companies such as ABB and Schneider Electric are offering AI-driven energy management suites with features like load forecasting, real-time analytics, and fault detection. These platforms are being rapidly adopted across manufacturing, data centers, marine, and utility sectors.
Additionally, the shift toward renewable energy and distributed generation requires more intelligent control systems, further propelling demand for software-based solutions. Cloud-based deployment models and integration with IoT-enabled devices are also boosting adoption among small to medium enterprises. With sustainability targets tightening and energy prices fluctuating globally, the software segment is expected to remain central to future-proofing industrial and commercial energy infrastructures.

The petroleum refinery segment is projected to hold 17.9% of the end-use segment market share in 2025. Energy-intensive operations and the need for uninterrupted power supply make refineries key adopters of advanced power management systems. These systems help optimize power distribution, ensure backup supply, and minimize energy waste in highly sensitive and hazardous environments.
Siemens and GE are leading providers in this space, offering power management solutions designed specifically for the complexities of oil refining. These include integration with SCADA systems, real-time load shedding, and advanced control of generator synchronization. Moreover, as petroleum refineries move toward automation and digital transformation, intelligent power systems are being deployed to enhance safety, reduce emissions, and improve asset lifecycle performance.
The segment is also benefiting from investments in refinery modernization across regions like the Middle East and Asia Pacific. As global energy markets evolve, power reliability and efficiency will remain mission-critical for refineries, making this a resilient and strategically important end-use segment.
The industry is seeing robust growth due to the growing demand for energy efficiency, grid resilience, and real-time monitoring. In commercial and industrial applications, companies focus on high reliability, automation, and scalability and embed IoT-based smart power systems for efficient energy consumption.
Residential customers emphasize affordable, easy-to-use solutions, frequently utilizing renewable energy resources such as solar and battery backup. Marine and offshore applications require heavy-duty, fail-safe equipment with rigorous safety and compliance requirements, providing unbroken power to the operations.
Utilities and smart grids are also investing in artificial intelligence-based power management solutions that enhance energy delivery, minimize grid downtime, and facilitate the integration of renewable sources of power. Drivers like cloud-based power management, remote diagnostics, and AI-based predictive maintenance, which promote enhanced efficiency and sustainability in industries' consumption of energy, fuel the trends.
| Company | Contract/Development Details |
|---|---|
| ABB Ltd. | Awarded a contract to implement a comprehensive power management system for a new offshore oil and gas platform, enhancing energy efficiency and operational reliability. |
| Siemens AG | Partnered with a major data center operator to install advanced power management solutions, aiming to reduce energy consumption and ensure uninterrupted operations. |
| Schneider Electric | Secured a deal to upgrade the power management infrastructure of a large manufacturing plant, focusing on automation and real-time monitoring capabilities. |
The industry is experiencing technological evolution, regulatory problems, and cybersecurity threats are at play. Such technologies like the smart grid, AI-based power monitoring, and autonomously generated energy are game changers for the company to invent all the time. The absence of automation and IoT-based solutions can lead to a loss in competitiveness.
Regulatory issues significantly contribute to risk management as the government asserts stringent energy efficiency, carbon emission, and safety measures. Firms across multiple locations need to adjust to different market rules, which increases their costs and complications of compliance. Any breach caused by the company in terms of pollution regulations can harden its reputation and cost it environmental fines.
The establishment of cybersecurity as a threat comes with the increased connections between digital PMS systems. The use of cloud and IoT-integrated PMS gives rise to vulnerability to attacks by hacking, ransomware, and data breaches in power grids, industrial facilities, and smart buildings. Companies are supposed to set aside funds for security plans aimed at warding off the threat of cyberattacks.

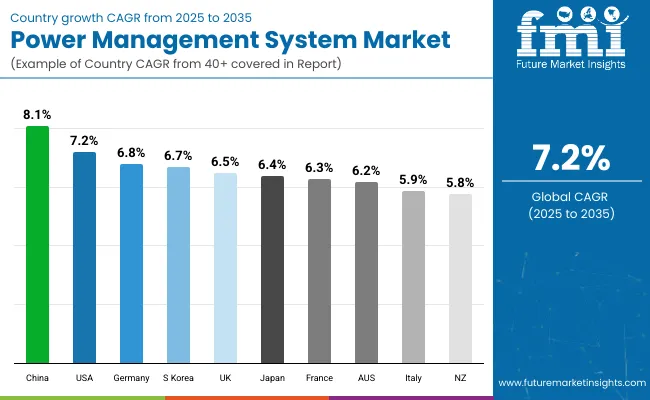
| Countries | CAGR (2025 to 2035) |
|---|---|
| The USA | 7.2% |
| The UK | 6.5% |
| France | 6.3% |
| Germany | 6.8% |
| Italy | 5.9% |
| South Korea | 6.7% |
| Japan | 6.4% |
| China | 8.1% |
| Australia | 6.2% |
| New Zealand | 5.8% |
The USA industry is likely to register a CAGR of 7.2% from 2025 to 2035. Increased adoption of renewable energy sources, smart grid technology, and rising demand for energy-efficient technology drive the market growth.
Government policies and energy-saving incentives drive the adoption of advanced power management solutions in industrial, commercial, and residential applications. High market share of large players in the market and continued investment in the development of power infrastructure also fuels market growth.
Digitalization and the introduction of IoT-based systems are efficiency- and cost-gain drivers. Smart meters and real-time monitoring systems are on the rise, allowing companies to optimize energy use. Electric vehicle expansion is causing demand for safe charging infrastructure to rise, spurring demand. With escalating energy security and carbon emissions on the agenda, the USA remains an affluent market for cutting-edge power management technologies.
The UK industry is projected to register a CAGR of 6.5% between 2025 and 2035. The country's intention to become net-zero by reducing emissions and adopting renewable energy resources fuels the growth of the market. Grid infrastructure replacement and rising energy efficiency need to support the need for these systems. High energy regulations and government subsidies drive industries to adopt advanced energy management systems.
Smart energy solutions and automation adoption fuel growth. Commercial and residential participants spend more on demand response programs, smart meters, and energy storage systems to optimize electricity consumption. The proliferation of electric vehicles and the need for highly efficient charging networks also underpin the growth. With technology improvements and government incentives, the UK remains a large market for power management solutions.
The industry is likely to register a CAGR of 6.3% through the forecast period. The nation prefers clean energy and power-efficient consumption, thus fueling market demand. France's monopoly over nuclear power and rising integration of renewable energy requires sophisticated systems to achieve maximum transmission of energy with minimum wastage.
Smart grid implementation and digitalization of energy fuel the growth of the market. Companies and industries make investments in smart power management solutions to boost their efficiency and reduce their operational costs. Electrification of transport and the government's drive to be sustainable create new growth prospects for the market. Increased focus on decarbonization and grid modernization in France boosts its power management system market.
The industry in Germany is likely to expand at a CAGR of 6.8% during 2025 to 2035. The nation's strong emphasis on renewable energy and smart grid growth is driving the market. Germany's Energiewende policy targets energy efficiency and sustainability, thus enhancing the usage of power management solutions in industries.
Industrial digitalization and automation propel the demand for smart systems. Increased penetration of electric vehicles and more reliance on decentralized power generation boost the demand for energy monitoring and control solutions. With a mature regulatory framework and high uptake of technology, Germany is a pioneering industry.
The industry is likely to grow at a CAGR of 5.9% during the forecast period. The government-supported energy transition in the country creates a demand for effective power management systems. Rising investments in smart grids and renewable energy infrastructure facilitate market growth.
Firms seek advanced energy management systems to optimize operations and reduce energy costs. The growth in electric mobility and energy storage technologies offers further growth opportunities. The focus on digitalization and sustainability in Italy fuels the adoption of new power management technologies in industries.
The industry in South Korea is likely to grow at 6.7% CAGR in the period 2025 to 2035. South Korea's industrialization and increasing electricity demand are driving market growth. South Korea's smart city program investments and renewable energy integration investment have led to a high demand for power management systems.
The growing use of power management systems based on AI offers greater efficiency and dependability. Higher technology power monitoring and power control are utilized by companies and households in hopes of reducing expenses and saving consumption. The South Korean industry keeps moving forward through technological innovation and energy security.
The industry in Japan is expected to register a CAGR of 6.4% during the forecast period. Japan's energy-saving regulations and emphasis on reducing carbon emissions are the fuel demand for power management systems. Japan's shift towards the development of smart grids and increased use of renewable energy sources propel market growth.
Firms invest in automated energy management systems for greater sustainability and operational efficiency. Expanded electric mobility and hydrogen energy initiatives further enhance the size of the market. Supported government policies and improved technology, Japan is a competitive industry.
The industry in China is expected to expand at an 8.1% CAGR from 2025 to 2035. Urbanization, industrialization, and clean energy focus are propelling market growth in the country. Government backing for smart grid deployments and energy efficiency programs is fueling market growth.
The advancements in AI and IoT-powered power management solutions enhance grid stability and operating efficiency. Increased investments in electric vehicles and battery storage systems are on the rise, and they offer excellent demand for premium energy management technology. With China dominating renewable energy uptake and smart infrastructure development, the industry increases with zeal.
The industry in Australia is expected to grow at a CAGR of 6.2% from 2025 to 2035. Increased reliance on renewable power sources and distributed generation in Australia drives the market. Smart grid technology and energy storage enhance the efficiency and reliability of the grid.
Firms adopt smart power management solutions to increase efficiency and conserve energy bills. Rising electrification of vehicle mobility and intelligent energy solutions needs to create additional business expansion for the fuels market. The transition towards sustainable energy for Australia in the future ensures the continued growth of power management technologies.
The industry in New Zealand is anticipated to grow at a CAGR of 5.8% during the forecast period. New Zealand's strong renewable energy sector and emphasis on sustainability drive demand. Investment in smart grid and energy efficiency schemes in New Zealand helps market growth.
Firms and residences are increasingly implementing energy management solutions to optimize power consumption. High-tech monitoring and control systems improve grid stability and efficiency. New Zealand, which is concentrating on clean energy and smart infrastructure, remains a good market for power management systems.

The PMS market develops dynamically due to the demand for energy efficiency, power grid modernization, and smart automation systems. Such markets involve heavy competition in advanced monitoring, control, and optimization technologies aimed primarily at industrial, commercial, and utility application needs.
Schneider Electric, Siemens AG, General Electric (GE), Eaton Corporation, and ABB Ltd. are some of the global leaders in power automation and energy management solutions. In contrast, midsized companies like Mitsubishi Electric, Rockwell Automation, and Honeywell International focus more on general sector-specific power applications in manufacturing- or process industries- as well as smart buildings.
Others like Emerson Electric and Larsen & Toubro (L&T) are also growing their respective footprints through regional partnerships and infrastructure-based solutions.
Thus far, the market evolution of IoT and AI, as well as cloud-driven PMS as real-time energy and predictive maintenance, further improved competition. Competing factors are sustainable roles and newer technologies like smart grids and decentralized energy systems.
Concerning strategy mergers, acquisitions, and alliances in achieving market consolidation and technological advancement in digital power management, as industries are shifting toward net-zero objectives and intelligent power distribution, companies investing in the so-called edge intelligence, cybersecurity, and highly scalable PMS solutions have a more promising competitive edge.
| Report Attributes | Details |
|---|---|
| Current Total Market Size (2025) | USD 6.96 billion |
| Projected Market Size (2035) | USD 13.94 billion |
| CAGR (2025 to 2035) | 7.2% |
| Base Year for Estimation | 2024 |
| Historical Period | 2020 to 2024 |
| Projections Period | 2025 to 2035 |
| Quantitative Units | USD billion for dollar sales |
| Types Analyzed (Segment 1) | Software, Hardware, Services |
| Modules Analyzed (Segment 2) | Power Monitoring and Control, Load Shedding and Management, Power Simulator, Generator Control, Energy Cost Accounting, Switching and Safety Management, Others |
| End-uses Analyzed (Segment 3) | Marine, Petroleum Refinery, Data Centers, Chemical Industry, Utilities, Paper and Pulp, Others |
| Regions Covered | North America, Latin America, Western Europe, Eastern Europe, East Asia, South Asia & Pacific, Middle East and Africa (MEA) |
| Countries Covered | United States, Canada, Mexico, Brazil, Argentina, Germany, France, United Kingdom, Italy, Spain, Netherlands, China, India, Japan, South Korea, ANZ, GCC Countries, South Africa |
| Key Players influencing the Power Management System Market | Schneider Electric, Siemens AG, General Electric (GE), Eaton Corporation, ABB Ltd., Mitsubishi Electric Corporation, Rockwell Automation, Honeywell International Inc., Emerson Electric Co., Larsen & Toubro (L&T) |
| Additional Attributes | dollar sales, CAGR trends, type segmentation, module-specific demand, end-user distribution, competitor dollar sales & market share, regional growth patterns |
In terms of Type, the segment is categorized into Software, Hardware, and Services.
In terms of Module, the segment is classified into Power Monitoring and Control, Load Shedding and Management, Power Simulator, Generator Control, Energy Cost Accounting, Switching and Safety Management, and Others.
In terms of End Use, the segment is distributed into Marine, Petroleum Refinery, Data Centers, Chemical Industry, Utilities, Paper and Pulp, and Others.
Key countries of North America, Latin America, Western Europe, Eastern Europe, East Asia, South Asia & pacific, Middle East and Africa (MEA) have been covered in the report.
The global Power Management System industry is projected to witness CAGR of 7.2% between 2025 and 2035.
The global Power Management System industry stood at USD 6.96 billion in 2025.
The global Power Management System industry is anticipated to reach USD 13.94 billion by 2035 end.
South Asia & Pacific is set to record the highest CAGR of 7.9% in the assessment period.
The key players operating in the global Power Management System industry include Schneider Electric, Siemens AG, General Electric (GE), Eaton Corporation, ABB Ltd. and others.


Our Research Products

The "Full Research Suite" delivers actionable market intel, deep dives on markets or technologies, so clients act faster, cut risk, and unlock growth.

The Leaderboard benchmarks and ranks top vendors, classifying them as Established Leaders, Leading Challengers, or Disruptors & Challengers.

Locates where complements amplify value and substitutes erode it, forecasting net impact by horizon

We deliver granular, decision-grade intel: market sizing, 5-year forecasts, pricing, adoption, usage, revenue, and operational KPIs—plus competitor tracking, regulation, and value chains—across 60 countries broadly.

Spot the shifts before they hit your P&L. We track inflection points, adoption curves, pricing moves, and ecosystem plays to show where demand is heading, why it is changing, and what to do next across high-growth markets and disruptive tech

Real-time reads of user behavior. We track shifting priorities, perceptions of today’s and next-gen services, and provider experience, then pace how fast tech moves from trial to adoption, blending buyer, consumer, and channel inputs with social signals (#WhySwitch, #UX).

Partner with our analyst team to build a custom report designed around your business priorities. From analysing market trends to assessing competitors or crafting bespoke datasets, we tailor insights to your needs.
Supplier Intelligence
Discovery & Profiling
Capacity & Footprint
Performance & Risk
Compliance & Governance
Commercial Readiness
Who Supplies Whom
Scorecards & Shortlists
Playbooks & Docs
Category Intelligence
Definition & Scope
Demand & Use Cases
Cost Drivers
Market Structure
Supply Chain Map
Trade & Policy
Operating Norms
Deliverables
Buyer Intelligence
Account Basics
Spend & Scope
Procurement Model
Vendor Requirements
Terms & Policies
Entry Strategy
Pain Points & Triggers
Outputs
Pricing Analysis
Benchmarks
Trends
Should-Cost
Indexation
Landed Cost
Commercial Terms
Deliverables
Brand Analysis
Positioning & Value Prop
Share & Presence
Customer Evidence
Go-to-Market
Digital & Reputation
Compliance & Trust
KPIs & Gaps
Outputs
Full Research Suite comprises of:
Market outlook & trends analysis
Interviews & case studies
Strategic recommendations
Vendor profiles & capabilities analysis
5-year forecasts
8 regions and 60+ country-level data splits
Market segment data splits
12 months of continuous data updates
DELIVERED AS:
PDF EXCEL ONLINE
Power System Simulator Market Growth - Trends & Forecast 2025 to 2035
Smart Power Management – AI-Optimized PMIC Solutions
DC Power Systems Market Trends - Growth, Demand & Forecast 2025 to 2035
Cloud Systems Management Software Market Size and Share Forecast Outlook 2025 to 2035
AI-powered Wealth Management Solution Market Size and Share Forecast Outlook 2025 to 2035
Telecom Power Systems Market Size and Share Forecast Outlook 2025 to 2035
Light Management System Market Size and Share Forecast Outlook 2025 to 2035
Labor Management System In Retail Market Size and Share Forecast Outlook 2025 to 2035
Stool Management System Market Analysis - Size, Share, and Forecast Outlook 2025 to 2035
Systems Administration Management Tools Market Size and Share Forecast Outlook 2025 to 2035
Alarm Management System Market Analysis by Component, Industry and Region - Trends, Growth & Forecast 2025 to 2035
Crowd Management System Market
Asset Management System Market
PV Power Forecasting System Market Size and Share Forecast Outlook 2025 to 2035
Dealer Management System Market Size and Share Forecast Outlook 2025 to 2035
Subsea Power Grid Systems Market Analysis - Size, Growth, and Forecast 2025 to 2035
Outage Management System Market Insights – Forecast 2025-2035
Power Line Communication System Market
Energy Management System Market Analysis – Growth & Forecast 2017-2025
Catalog Management System Market Size and Share Forecast Outlook 2025 to 2035

Thank you!
You will receive an email from our Business Development Manager. Please be sure to check your SPAM/JUNK folder too.
Chat With
MaRIA