Power Swivels Market Size and Share Forecast Outlook 2025 to 2035

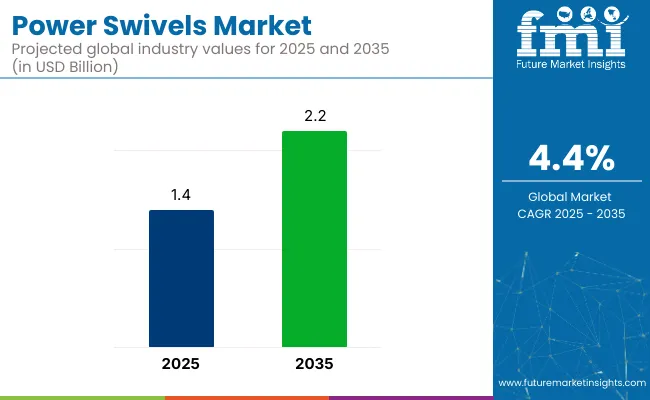
The global power swivels market is valued at USD 1.4 billion in 2025 and is poised to reach USD 2.2 billion by 2035, which shows a CAGR of 4.4%. The growth of the market is being driven by rising investments in offshore and deep water drilling projects, increasing demand for advanced drilling equipment, and the adoption of automation and AI technologies to improve drilling efficiency.
Quick Stats of Power Swivels Market

  • Market Value (2025): USD 1.4 billion
  • Forecast Value (2035): USD 2.2 billion
  • Forecast CAGR: 4.4%
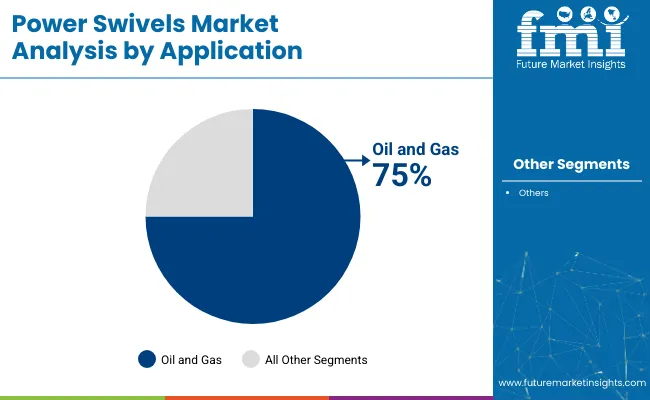
  • Application Segment Leader in 2025:Oil and Gas (75% Market Share)
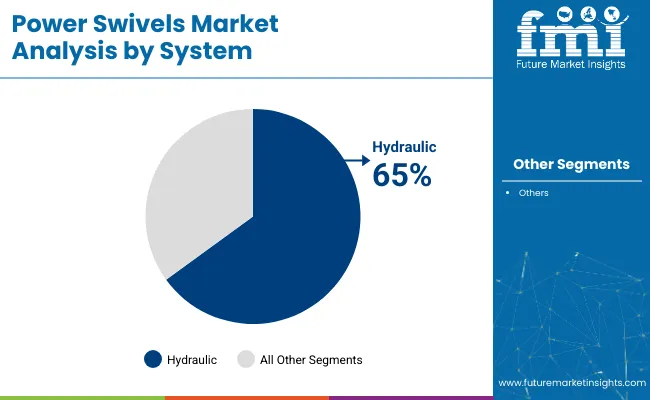
  • Top System Segment:Hydraulic (65% Market Share in 2025)
  • Key Growth Region:North America (USA is the fastest-growing market with 4.8% CAGR)

Power Swivels Market

Metric Value
2025 Market Value USD 1.4 billion
2035 Market Value USD 2.2 billion
Forecast CAGR (2025 to 2035) 4.4%

Additionally, strict environmental regulations in regions such as Europe and North America are encouraging companies to adopt energy-efficient and low-emission drilling solutions, thereby supporting market expansion.

The USA is projected to remain the country with the highest CAGR of 4.8% during 2025 to 2035, driven by advanced offshore drilling projects and technological innovations. Germany is expected to emerge as the rapid growth market, registering a CAGR of 4.3% due to rapid domestic manufacturing expansion and rising offshore exploration.

The UK is projected to grow at a CAGR of 4.2% during the forecast period. The oil and gas segment is projected to lead the application category with over 75% market share, while the hydraulic systems segment is forecasted to dominate the system category with a projected 65% share in 2025.

Power swivels hold approximately 25% to 30% share in the rotary equipment market, due to their essential role in drilling and well intervention operations. Within the rig components market, they account for around 15% to 18%, supporting rotation and torque transmission functions. In the broader drilling equipment market, their share is about 10% to 12%, reflecting their specialized utility in specific drilling systems.

In the oilfield equipment market, power swivels represent roughly 6% to 8%, while in the well intervention equipment segment, they contribute about 12%, especially in coiled tubing and workover rigs where mobility and rotation are critical.

Governments worldwide are implementing strict regulations to ensure safety, efficiency, and environmental compliance in drilling operations. In the United States, OSHA and EPA enforce safety standards and emission controls for diesel-powered equipment, encouraging electric alternatives.

The European Union requires CE certification under the Machinery and ATEX Directives, pushing companies toward low-emission designs. China mandates CCC certification and strict emission controls to promote sustainable equipment. India enforces BIS certification for safety and performance compliance, while Japan offers incentives for adopting low-emission technologies.

Analyzing Power Swivels Market by Top Investment Segments

The power swivels market is segmented into system, design, application, and region. By system, it includes hydraulic, electric, and mechanical. By design, it covers gear, plate, and chain types. The market spans applications such as oil and gas, geothermal exploration, environmental monitoring, and others (infrastructure drilling, mining operations, and heavy industrial boring).

The market spans regions including North America, Latin America, Western Europe, Eastern Europe, Central Asia, Russia and Belarus, the Balkan and Baltic countries, the Middle East and Africa, East Asia, South Asia, and the Pacific.

Hydraulic to Lead the System Segment with Over 65% Market Share in 2025

The hydraulic system segment is expected to remain the most lucrative in the power swivels market, likely to hold 65% share in 2025.
  • This is driven by their ability to deliver high torque output and superior operational efficiency, which are critical in both offshore and onshore drilling operations.
  • Hydraulic systems provide precise rotational control, improve well intervention processes, and ensure reliability under high-pressure drilling environments.
  • Their robust design and adaptability to automated drilling technologies further enhance their adoption.

Power Swivels Market Analysis By System

Gear to Lead the Design Segment with Over 60% Market Share in 2025

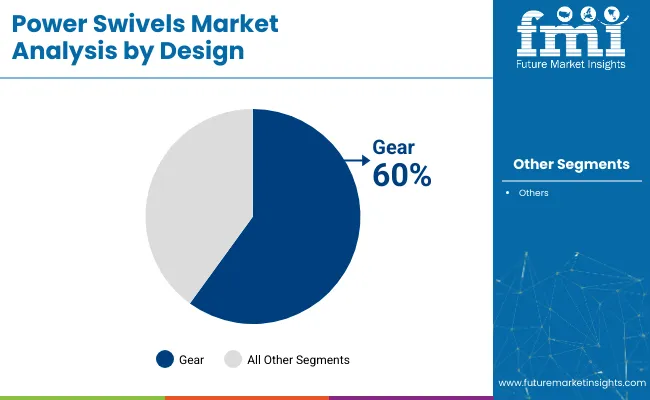
The gear-based design segment is expected to remain the most lucrative in the power swivels market, accounting for an expected 60% share in 2025.
  • The exceptional durability and ability to withstand high-pressure and high-torque drilling environments make them ideal for deep water and ultra-deep water projects.
  • Gear-based designs provide stable rotational control, reduce maintenance needs, and extend equipment lifespan, enhancing operational efficiency.
  • Their superior corrosion resistance and compatibility with automated systems further increase their adoption.

Power Swivels Market Analysis By Design

Oil and Gas to Lead the Application Segment with Over 75% Market Share

The oil and gas segment is expected to remain the most lucrative application in the power swivels market, likely to hold a 75% share in 2025.
  • This dominance is driven by extensive offshore and deep water drilling activities worldwide, along with increasing investments in shale gas and tight oil exploration projects.
  • Power swivels are critical in oil and gas operations as they enhance drilling efficiency, provide high torque for heavy-duty drilling, and improve well intervention processes.
  • Their adoption is further supported by the integration of automation and AI technologies, which optimize operational performance and reduce downtime in complex drilling environments.

Power Swivels Market Analysis By Application

Top Power Swivels Market Dynamics

The global power swivels market is growing steadily, driven by rising offshore and deep water drilling activities, increasing adoption of hydraulic swivel systems, and advancements in automated and AI-integrated drilling technologies.

Recent Trends in the Power Swivels Market

  • AI-integrated power swivels are being adopted for real-time performance monitoring and predictive maintenance.
  • Lightweight, high-torque swivel designs are gaining traction for energy efficiency in onshore drilling.
  • Electric and hybrid-powered swivels are increasingly developed to meet emission regulations.
  • Partnerships between oilfield service companies and robotics firms are enhancing drilling automation.
  • Sustainability-focused innovations, such as carbon-neutral swivels with bio-based lubricants, are expanding rapidly.

Challenges in the Power Swivels Market
  • Fluctuating raw material prices, especially steel and aluminum, are impacting profitability.
  • High initial investment costs for advanced automated swivel systems are limiting adoption in cost-sensitive regions.
  • Regulatory compliance complexities across regions are creating operational hurdles for manufacturers.
  • Supply chain disruptions and labor shortages are affecting production timelines globally.
  • Limited infrastructure and technological readiness in developing markets are restraining advanced system deployments.

Analyzing Top Countries Producing and Supplying Power Swivels

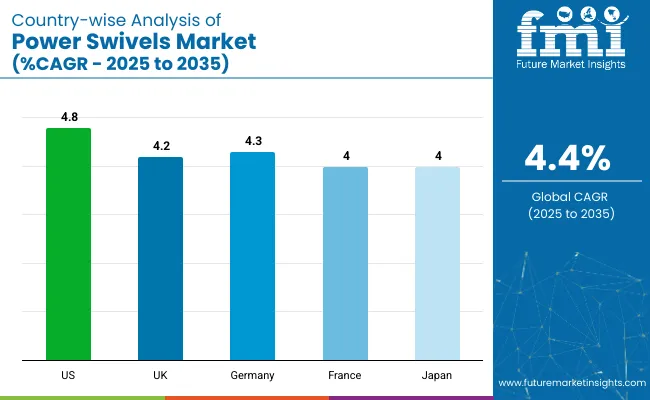
Country Wise Analysis Of Power Swivels Market Cagr 2025 To 2035

The USA leads the power swivels market with a projected CAGR of 4.8% (2025 to 2035), driven by offshore drilling, automation, and regulatory shifts favoring electric systems. Germany follows at 4.3%, supported by Industry 4.0 and compliance with DIN standards. The UK market, growing at 4.2%, benefits from North Sea projects and sustainable equipment initiatives under post-Brexit compliance.

France and Japan both show steady growth at 4.0%, influenced by environmental mandates, energy efficiency goals, and investments in automated and low-emission drilling technologies. Across all countries, digitalization, safety compliance, and sustainability remain the core drivers of power swivel market expansion.

The report covers in-depth analysis of 40+ countries; five top-performing OECD countries are highlighted below.

USA Power Swivels Market Analysis

The power swivels demand in the USA is projected to grow at a CAGR of 4.8% from 2025 to 2035. Growth is driven by advanced offshore drilling projects, technological innovations, and the integration of automation for improved drilling efficiency and safety across oilfields.

  • Strong offshore oil and gas exploration activities.
  • High adoption of AI-integrated swivel systems.
  • Strict OSHA and EPA regulations promoting electric alternatives.
  • Leading players like Schlumberger and Halliburton drive innovation.

Power Swivels Demand Analysis in the UK

Power swivels revenue in the UK is forecasted to expand at a CAGR of 4.2% during 2025 to 2035. Growth is driven by North Sea offshore developments, stringent HSE regulations, and a strong shift towards sustainable, low-emission drilling technologies.

  • Increased offshore oilfield investments in the North Sea.
  • Transition to UKCA certification post-Brexit, raising compliance standards.
  • Government net-zero targets shaping equipment design.
  • Local manufacturers innovating to reduce environmental impact.

Power Swivels Demand Analysis in Germany

Sales of power swivels in Germany are projected to grow at a CAGR of 4.3% from 2025 to 2035. Strict industrial standards, greater use of automation, and compliance with DIN safety rules for hydraulic equipment are driving growth.

  • Emphasis on Industry 4.0 and automated drilling technologies.
  • Investments in durable, low-maintenance swivel systems.
  • Advanced engineering expertise supporting market growth.
  • Challenges from BAFA export regulations for non-EU markets.

France Power Swivels Market Analysis

France’s power swivels market is forecasted to grow at a CAGR of 4.0% between 2025 and 2035. Growth is driven by carbon tax policies, strict AFNOR standards, and increasing offshore drilling projects led by TotalEnergies, focusing on sustainable equipment.

  • Strong compliance with EU Machinery and ATEX Directives.
  • Growing focus on energy-efficient and automated swivels.
  • Rising offshore oilfield exploration supporting demand.
  • Push for carbon-neutral technologies, reshaping supplier strategies.

Japan Power Swivels Market Analysis

Japan's power swivelsrevenue is projected to grow at a CAGR of 4.0% from 2025 to 2035. Rising demand for compact and efficient equipment, strict JIS safety standards, and strong government support for low-emission drilling technologies are driving growth.

  • Increased investments in AI-powered automation solutions.
  • Emphasis on precision engineering in drilling equipment.
  • Government subsidies promoting electric-powered swivels.
  • Domestic firms focusing on smart and safe drilling technologies.

Leading Power Swivels Suppliers and Manufacturers

The power swivels market is relatively consolidated, with major global players such as Schlumberger, Halliburton, and NOV holding dominant shares. These companies compete intensely on innovation, advanced automation integration, and sustainability-focused product offerings.

Top companies are competing by leveraging pricing strategies, technological advancements, and strategic partnerships to strengthen their market positions. Schlumberger focuses on AI-integrated swivel systems to enhance operational efficiency in offshore drilling, while Halliburton is investing in automation and robotics for improved safety and reduced downtime. NOV continues to expand its regional footprint through acquisitions, ensuring broader market coverage and customization capabilities for clients in Asia-Pacific and the Middle East.

Recent Power Swivels Industry News

  • In June 2025, Atlas Copco announced the acquisition of KingsdownCompressed Air Systems Ltd. to strengthen its portfolio and gain new customers.
  • In April2024, SLB announced a definitive agreement to acquire ChampionX in an all-stock transaction. This boosted the company’s position while enhancing its customer base.

Power Swivels Market Report Scope

Report Attributes Details
Current Total Market Size (2025) USD 1.4 billion
Projected Market Size (2035) USD 2.2 billion
CAGR (2025 to 2035) 4.4%
Base Year for Estimation 2024
Historical Period 2020 to 2024
Projections Period 2025 to 2035
Market Analysis Parameters Revenue in USD billions /Volume in Units
By System Hydraulic, Electric, and Mechanical
By Design Gear, Plate, and Chain
By Application Oil and Gas, Geothermal Exploration, Environmental Monitoring, and Others (infrastructure drilling, mining operations, heavy industrial boring)
Regions Covered North America, Latin America, Western Europe, Eastern Europe, East Asia, South Asia Pacific, Middle East , and Africa
Countries Covered United States, Canada, United Kingdom, Germany, France, China, Japan, South Korea, Brazil, Australia
Key Players Schlumberger Limited, National Oilwell Varco, Inc., Weatherford International Ltd., NOV Rig Technologies, Rubicon Oilfield International, Drilling Tools International, MSI Oilfield Products, Tasman Oil Tools, Halliburton Company, Baker Hughes Company, Aker Solutions ASA, Nabors Industries Ltd., Forum Energy Technologies, Inc., Atlas Copco AB, Cameron International Corporation (a Schlumberger company), Drillmec S.p.A., Jereh Group, Tesco Corporation, UZTEL S.A., Oil States Industries, Inc.
Additional Attributes Dollar sales by value, market share analysis by region, and country-wise analysis

Key Segmentation

By System:

By system, the market is segmented into hydraulic, electric, and mechanical.

By Design:

In terms of design, the market is segmented into gear, plate, and chain.

By Application:

By application, the market is segmented into oil and gas, geothermal exploration, environmental monitoring, and others.

By Region:

The market is segmented by region into North America, Latin America, Western Europe, South Asia & Pacific, East Asia, Middle East, and Africa.

Table of Content

  1. Executive Summary
    • Global Market Outlook
    • Demand-side Trends
    • Supply-side Trends
    • Technology Roadmap Analysis
    • Analysis and Recommendations
  2. Market Overview
    • Market Coverage / Taxonomy
    • Market Definition / Scope / Limitations
  3. Market Background
    • Market Dynamics
      • Drivers
      • Restraints
      • Opportunity
      • Trends
    • Scenario Forecast
      • Demand in Optimistic Scenario
      • Demand in Likely Scenario
      • Demand in Conservative Scenario
    • Opportunity Map Analysis
    • Product Life Cycle Analysis
    • Supply Chain Analysis
      • Supply Side Participants and their Roles
        • Producers
        • Mid-Level Participants (Traders/ Agents/ Brokers)
        • Wholesalers and Distributors
      • Value Added and Value Created at Node in the Supply Chain
      • List of Raw Material Suppliers
      • List of Existing and Potential Buyer’s
    • Investment Feasibility Matrix
    • Value Chain Analysis
      • Profit Margin Analysis
      • Wholesalers and Distributors
      • Retailers
    • PESTLE and Porter’s Analysis
    • Regulatory Landscape
      • By Key Regions
      • By Key Countries
    • Regional Parent Market Outlook
    • Production and Consumption Statistics
    • Import and Export Statistics
  4. Global Market Analysis 2020 to 2024 and Forecast, 2025 to 2035
    • Historical Market Size Value (USD Billion) & Volume (Units) Analysis, 2020 to 2024
    • Current and Future Market Size Value (USD Billion) & Volume (Units) Projections, 2025 to 2035
      • Y-o-Y Growth Trend Analysis
      • Absolute $ Opportunity Analysis
  5. Global Market Pricing Analysis 2020 to 2024 and Forecast 2025 to 2035
  6. Global Market Analysis 2020 to 2024 and Forecast 2025 to 2035, By System
    • Introduction / Key Findings
    • Historical Market Size Value (USD Billion) & Volume (Units) Analysis By System, 2020 to 2024
    • Current and Future Market Size Value (USD Billion) & Volume (Units) Analysis and Forecast By System, 2025 to 2035
      • Hydraulic
      • Electric
      • Mechanical
    • Y-o-Y Growth Trend Analysis By System, 2020 to 2024
    • Absolute $ Opportunity Analysis By System, 2025 to 2035
  7. Global Market Analysis 2020 to 2024 and Forecast 2025 to 2035, By Design
    • Introduction / Key Findings
    • Historical Market Size Value (USD Billion) & Volume (Units) Analysis By Design, 2020 to 2024
    • Current and Future Market Size Value (USD Billion) & Volume (Units) Analysis and Forecast By Design, 2025 to 2035
      • Gear
      • Plate
      • Chain
    • Y-o-Y Growth Trend Analysis By Design, 2020 to 2024
    • Absolute $ Opportunity Analysis By Design, 2025 to 2035
  8. Global Market Analysis 2020 to 2024 and Forecast 2025 to 2035, By Application
    • Introduction / Key Findings
    • Historical Market Size Value (USD Billion) & Volume (Units) Analysis By Application, 2020 to 2024
    • Current and Future Market Size Value (USD Billion) & Volume (Units) Analysis and Forecast By Application, 2025 to 2035
      • Oil and Gas
      • Geothermal Exploration
      • Environmental Monitoring
      • Others
        • Infrastructure Drilling
        • Mining Operations
        • Heavy Industrial Boring
    • Y-o-Y Growth Trend Analysis By Application, 2020 to 2024
    • Absolute $ Opportunity Analysis By Application, 2025 to 2035
  9. Global Market Analysis 2020 to 2024 and Forecast 2025 to 2035, By Region
    • Introduction
    • Historical Market Size Value (USD Billion) & Volume (Units) Analysis By Region, 2020 to 2024
    • Current Market Size Value (USD Billion) & Volume (Units) Analysis and Forecast By Region, 2025 to 2035
      • USA
      • Latin America
      • Western Europe
      • Eastern Europe
      • East Asia
      • South Asia & Pacific
      • Middle East and Africa
    • Market Attractiveness Analysis By Region
  10. USA Market Analysis 2020 to 2024 and Forecast 2025 to 2035, By Country
    • Historical Market Size Value (USD Billion) & Volume (Units) Trend Analysis By Market Taxonomy, 2020 to 2024
    • Market Size Value (USD Billion) & Volume (Units) Forecast By Market Taxonomy, 2025 to 2035
      • By Country
        • Canada
        • Brazil
        • Mexico
        • Argentina
      • By System
      • By Design
      • By Application
    • Market Attractiveness Analysis
      • By Country
      • By System
      • By Design
      • By Application
    • Key Takeaways
  11. Latin America Market Analysis 2020 to 2024 and Forecast 2025 to 2035, By Country
    • Historical Market Size Value (USD Billion) & Volume (Units) Trend Analysis By Market Taxonomy, 2020 to 2024
    • Market Size Value (USD Billion) & Volume (Units) Forecast By Market Taxonomy, 2025 to 2035
      • By Country
        • Brazil
        • Argentina
        • Rest of LATAM
      • By System
      • By Design
      • By Application
    • Market Attractiveness Analysis
      • By Country
      • By System
      • By Design
      • By Application
    • Key Takeaways
  12. Western Europe Market Analysis 2020 to 2024 and Forecast 2025 to 2035, By Country
    • Historical Market Size Value (USD Billion) & Volume (Units) Trend Analysis By Market Taxonomy, 2020 to 2024
    • Market Size Value (USD Billion) & Volume (Units) Forecast By Market Taxonomy, 2025 to 2035
      • By Country
        • Germany
        • Italy
        • France
        • UK
        • Spain
        • BENELUX
        • Nordic
        • Rest of W.Europe
      • By System
      • By Design
      • By Application
    • Market Attractiveness Analysis
      • By Country
      • By System
      • By Design
      • By Application
    • Key Takeaways
  13. Eastern Europe Market Analysis 2020 to 2024 and Forecast 2025 to 2035, By Country
    • Historical Market Size Value (USD Billion) & Volume (Units) Trend Analysis By Market Taxonomy, 2020 to 2024
    • Market Size Value (USD Billion) & Volume (Units) Forecast By Market Taxonomy, 2025 to 2035
      • By Country
        • Russia
        • Hungary
        • Poland
        • Balkan & Baltics
        • Rest of E. Europe
      • By System
      • By Design
      • By Application
    • Market Attractiveness Analysis
      • By Country
      • By System
      • By Design
      • By Application
    • Key Takeaways
  14. East Asia Market Analysis 2020 to 2024 and Forecast 2025 to 2035, By Country
    • Historical Market Size Value (USD Billion) & Volume (Units) Trend Analysis By Market Taxonomy, 2020 to 2024
    • Market Size Value (USD Billion) & Volume (Units) Forecast By Market Taxonomy, 2025 to 2035
      • By Country
        • China
        • Japan
        • South Korea
      • By System
      • By Design
      • By Application
    • Market Attractiveness Analysis
      • By Country
      • By System
      • By Design
      • By Application
    • Key Takeaways
  15. South Asia & Pacific Market Analysis 2020 to 2024 and Forecast 2025 to 2035, By Country
    • Historical Market Size Value (USD Billion) & Volume (Units) Trend Analysis By Market Taxonomy, 2020 to 2024
    • Market Size Value (USD Billion) & Volume (Units) Forecast By Market Taxonomy, 2025 to 2035
      • By Country
        • India
        • Australia & New Zealand
        • ASEAN
        • Rest of SAP
      • By System
      • By Design
      • By Application
    • Market Attractiveness Analysis
      • By Country
      • By System
      • By Design
      • By Application
    • Key Takeaways
  16. Middle East and Africa Market Analysis 2020 to 2024 and Forecast 2025 to 2035, By Country
    • Historical Market Size Value (USD Billion) & Volume (Units) Trend Analysis By Market Taxonomy, 2020 to 2024
    • Market Size Value (USD Billion) & Volume (Units) Forecast By Market Taxonomy, 2025 to 2035
      • By Country
        • GCC Countries
        • Northern Africa
        • South Africa
        • Turkiye
        • Rest of MEA
      • By System
      • By Design
      • By Application
    • Market Attractiveness Analysis
      • By Country
      • By System
      • By Design
      • By Application
    • Key Takeaways
  17. Key Countries Market Analysis
    • USA
      • Pricing Analysis
      • Market Share Analysis, 2024
        • By System
        • By Design
        • By Application
    • Canada
      • Pricing Analysis
      • Market Share Analysis, 2024
        • By System
        • By Design
        • By Application
    • Brazil
      • Pricing Analysis
      • Market Share Analysis, 2024
        • By System
        • By Design
        • By Application
    • Mexico
      • Pricing Analysis
      • Market Share Analysis, 2024
        • By System
        • By Design
        • By Application
    • Argentina
      • Pricing Analysis
      • Market Share Analysis, 2024
        • By System
        • By Design
        • By Application
  18. Market Structure Analysis
    • Competition Dashboard
    • Competition Benchmarking
    • Market Share Analysis of Top Players
      • By Regional
      • By System
      • By Design
      • By Application
  19. Competition Analysis
    • Competition Deep Dive
      • Schlumberger Limited
        • Overview
        • Product Portfolio
        • Profitability by Market Segments (Product/Age /Sales Channel/Region)
        • Sales Footprint
        • Strategy Overview
          • Marketing Strategy
          • Product Strategy
          • Channel Strategy
      • National Oilwell Varco, Inc.
        • Overview
        • Product Portfolio
        • Profitability by Market Segments (Product/Age /Sales Channel/Region)
        • Sales Footprint
        • Strategy Overview
          • Marketing Strategy
          • Product Strategy
          • Channel Strategy
      • Weatherford International Ltd.
        • Overview
        • Product Portfolio
        • Profitability by Market Segments (Product/Age /Sales Channel/Region)
        • Sales Footprint
        • Strategy Overview
          • Marketing Strategy
          • Product Strategy
          • Channel Strategy
      • NOV Rig Technologies
        • Overview
        • Product Portfolio
        • Profitability by Market Segments (Product/Age /Sales Channel/Region)
        • Sales Footprint
        • Strategy Overview
          • Marketing Strategy
          • Product Strategy
          • Channel Strategy
      • Rubicon Oilfield International
        • Overview
        • Product Portfolio
        • Profitability by Market Segments (Product/Age /Sales Channel/Region)
        • Sales Footprint
        • Strategy Overview
          • Marketing Strategy
          • Product Strategy
          • Channel Strategy
      • Drilling Tools International
        • Overview
        • Product Portfolio
        • Profitability by Market Segments (Product/Age /Sales Channel/Region)
        • Sales Footprint
        • Strategy Overview
          • Marketing Strategy
          • Product Strategy
          • Channel Strategy
      • MSI Oilfield Products
        • Overview
        • Product Portfolio
        • Profitability by Market Segments (Product/Age /Sales Channel/Region)
        • Sales Footprint
        • Strategy Overview
          • Marketing Strategy
          • Product Strategy
          • Channel Strategy
      • Tasman Oil Tools
        • Overview
        • Product Portfolio
        • Profitability by Market Segments (Product/Age /Sales Channel/Region)
        • Sales Footprint
        • Strategy Overview
          • Marketing Strategy
          • Product Strategy
          • Channel Strategy
      • Halliburton Company
        • Overview
        • Product Portfolio
        • Profitability by Market Segments (Product/Age /Sales Channel/Region)
        • Sales Footprint
        • Strategy Overview
          • Marketing Strategy
          • Product Strategy
          • Channel Strategy
      • Baker Hughes Company
        • Overview
        • Product Portfolio
        • Profitability by Market Segments (Product/Age /Sales Channel/Region)
        • Sales Footprint
        • Strategy Overview
          • Marketing Strategy
          • Product Strategy
          • Channel Strategy
      • Aker Solutions ASA
        • Overview
        • Product Portfolio
        • Profitability by Market Segments (Product/Age /Sales Channel/Region)
        • Sales Footprint
        • Strategy Overview
          • Marketing Strategy
          • Product Strategy
          • Channel Strategy
      • Nabors Industries Ltd.
        • Overview
        • Product Portfolio
        • Profitability by Market Segments (Product/Age /Sales Channel/Region)
        • Sales Footprint
        • Strategy Overview
          • Marketing Strategy
          • Product Strategy
          • Channel Strategy
      • Forum Energy Technologies, Inc.
        • Overview
        • Product Portfolio
        • Profitability by Market Segments (Product/Age /Sales Channel/Region)
        • Sales Footprint
        • Strategy Overview
          • Marketing Strategy
          • Product Strategy
          • Channel Strategy
      • Atlas Copco AB
        • Overview
        • Product Portfolio
        • Profitability by Market Segments (Product/Age /Sales Channel/Region)
        • Sales Footprint
        • Strategy Overview
          • Marketing Strategy
          • Product Strategy
          • Channel Strategy
      • Cameron International Corporation (a Schlumberger company)
        • Overview
        • Product Portfolio
        • Profitability by Market Segments (Product/Age /Sales Channel/Region)
        • Sales Footprint
        • Strategy Overview
          • Marketing Strategy
          • Product Strategy
          • Channel Strategy
      • Drillmec S.p.A.
        • Overview
        • Product Portfolio
        • Profitability by Market Segments (Product/Age /Sales Channel/Region)
        • Sales Footprint
        • Strategy Overview
          • Marketing Strategy
          • Product Strategy
          • Channel Strategy
      • Jereh Group
        • Overview
        • Product Portfolio
        • Profitability by Market Segments (Product/Age /Sales Channel/Region)
        • Sales Footprint
        • Strategy Overview
          • Marketing Strategy
          • Product Strategy
          • Channel Strategy
      • Tesco Corporation
        • Overview
        • Product Portfolio
        • Profitability by Market Segments (Product/Age /Sales Channel/Region)
        • Sales Footprint
        • Strategy Overview
          • Marketing Strategy
          • Product Strategy
          • Channel Strategy
      • UZTEL S.A.
        • Overview
        • Product Portfolio
        • Profitability by Market Segments (Product/Age /Sales Channel/Region)
        • Sales Footprint
        • Strategy Overview
          • Marketing Strategy
          • Product Strategy
          • Channel Strategy
      • Oil States Industries, Inc.
        • Overview
        • Product Portfolio
        • Profitability by Market Segments (Product/Age /Sales Channel/Region)
        • Sales Footprint
        • Strategy Overview
          • Marketing Strategy
          • Product Strategy
          • Channel Strategy
  20. Assumptions & Acronyms Used
  21. Research Methodology

List of Tables

  • Table 1: Global Market Value (USD Billion) Forecast by Region, 2020 to 2035
  • Table 2: Global Market Volume (Units) Forecast by Region, 2020 to 2035
  • Table 3: Global Market Value (USD Billion) Forecast by System, 2020 to 2035
  • Table 4: Global Market Volume (Units) Forecast by System, 2020 to 2035
  • Table 5: Global Market Value (USD Billion) Forecast by Design, 2020 to 2035
  • Table 6: Global Market Volume (Units) Forecast by Design, 2020 to 2035
  • Table 7: Global Market Value (USD Billion) Forecast by Application, 2020 to 2035
  • Table 8: Global Market Volume (Units) Forecast by Application, 2020 to 2035
  • Table 9: USA Market Value (USD Billion) Forecast by Country, 2020 to 2035
  • Table 10: USA Market Volume (Units) Forecast by Country, 2020 to 2035
  • Table 11: USA Market Value (USD Billion) Forecast by System, 2020 to 2035
  • Table 12: USA Market Volume (Units) Forecast by System, 2020 to 2035
  • Table 13: USA Market Value (USD Billion) Forecast by Design, 2020 to 2035
  • Table 14: USA Market Volume (Units) Forecast by Design, 2020 to 2035
  • Table 15: USA Market Value (USD Billion) Forecast by Application, 2020 to 2035
  • Table 16: USA Market Volume (Units) Forecast by Application, 2020 to 2035
  • Table 17: Latin America Market Value (USD Billion) Forecast by Country, 2020 to 2035
  • Table 18: Latin America Market Volume (Units) Forecast by Country, 2020 to 2035
  • Table 19: Latin America Market Value (USD Billion) Forecast by System, 2020 to 2035
  • Table 20: Latin America Market Volume (Units) Forecast by System, 2020 to 2035
  • Table 21: Latin America Market Value (USD Billion) Forecast by Design, 2020 to 2035
  • Table 22: Latin America Market Volume (Units) Forecast by Design, 2020 to 2035
  • Table 23: Latin America Market Value (USD Billion) Forecast by Application, 2020 to 2035
  • Table 24: Latin America Market Volume (Units) Forecast by Application, 2020 to 2035
  • Table 25: Western Europe Market Value (USD Billion) Forecast by Country, 2020 to 2035
  • Table 26: Western Europe Market Volume (Units) Forecast by Country, 2020 to 2035
  • Table 27: Western Europe Market Value (USD Billion) Forecast by System, 2020 to 2035
  • Table 28: Western Europe Market Volume (Units) Forecast by System, 2020 to 2035
  • Table 29: Western Europe Market Value (USD Billion) Forecast by Design, 2020 to 2035
  • Table 30: Western Europe Market Volume (Units) Forecast by Design, 2020 to 2035
  • Table 31: Western Europe Market Value (USD Billion) Forecast by Application, 2020 to 2035
  • Table 32: Western Europe Market Volume (Units) Forecast by Application, 2020 to 2035
  • Table 33: Eastern Europe Market Value (USD Billion) Forecast by Country, 2020 to 2035
  • Table 34: Eastern Europe Market Volume (Units) Forecast by Country, 2020 to 2035
  • Table 35: Eastern Europe Market Value (USD Billion) Forecast by System, 2020 to 2035
  • Table 36: Eastern Europe Market Volume (Units) Forecast by System, 2020 to 2035
  • Table 37: Eastern Europe Market Value (USD Billion) Forecast by Design, 2020 to 2035
  • Table 38: Eastern Europe Market Volume (Units) Forecast by Design, 2020 to 2035
  • Table 39: Eastern Europe Market Value (USD Billion) Forecast by Application, 2020 to 2035
  • Table 40: Eastern Europe Market Volume (Units) Forecast by Application, 2020 to 2035
  • Table 41: East Asia Market Value (USD Billion) Forecast by Country, 2020 to 2035
  • Table 42: East Asia Market Volume (Units) Forecast by Country, 2020 to 2035
  • Table 43: East Asia Market Value (USD Billion) Forecast by System, 2020 to 2035
  • Table 44: East Asia Market Volume (Units) Forecast by System, 2020 to 2035
  • Table 45: East Asia Market Value (USD Billion) Forecast by Design, 2020 to 2035
  • Table 46: East Asia Market Volume (Units) Forecast by Design, 2020 to 2035
  • Table 47: East Asia Market Value (USD Billion) Forecast by Application, 2020 to 2035
  • Table 48: East Asia Market Volume (Units) Forecast by Application, 2020 to 2035
  • Table 49: South Asia & Pacific Market Value (USD Billion) Forecast by Country, 2020 to 2035
  • Table 50: South Asia & Pacific Market Volume (Units) Forecast by Country, 2020 to 2035
  • Table 51: South Asia & Pacific Market Value (USD Billion) Forecast by System, 2020 to 2035
  • Table 52: South Asia & Pacific Market Volume (Units) Forecast by System, 2020 to 2035
  • Table 53: South Asia & Pacific Market Value (USD Billion) Forecast by Design, 2020 to 2035
  • Table 54: South Asia & Pacific Market Volume (Units) Forecast by Design, 2020 to 2035
  • Table 55: South Asia & Pacific Market Value (USD Billion) Forecast by Application, 2020 to 2035
  • Table 56: South Asia & Pacific Market Volume (Units) Forecast by Application, 2020 to 2035
  • Table 57: Middle East and Africa Market Value (USD Billion) Forecast by Country, 2020 to 2035
  • Table 58: Middle East and Africa Market Volume (Units) Forecast by Country, 2020 to 2035
  • Table 59: Middle East and Africa Market Value (USD Billion) Forecast by System, 2020 to 2035
  • Table 60: Middle East and Africa Market Volume (Units) Forecast by System, 2020 to 2035
  • Table 61: Middle East and Africa Market Value (USD Billion) Forecast by Design, 2020 to 2035
  • Table 62: Middle East and Africa Market Volume (Units) Forecast by Design, 2020 to 2035
  • Table 63: Middle East and Africa Market Value (USD Billion) Forecast by Application, 2020 to 2035
  • Table 64: Middle East and Africa Market Volume (Units) Forecast by Application, 2020 to 2035

List of Figures

  • Figure 1: Global Market Volume (Units) Forecast 2020 to 2035
  • Figure 2: Global Market Pricing Analysis
  • Figure 3: Global Market Value (USD Billion) Forecast 2020 to 2035
  • Figure 4: Global Market Value Share and BPS Analysis by System, 2025 and 2035
  • Figure 5: Global Market Y-o-Y Growth Comparison by System, 2025 to 2035
  • Figure 6: Global Market Attractiveness Analysis by System
  • Figure 7: Global Market Value Share and BPS Analysis by Design, 2025 and 2035
  • Figure 8: Global Market Y-o-Y Growth Comparison by Design, 2025 to 2035
  • Figure 9: Global Market Attractiveness Analysis by Design
  • Figure 10: Global Market Value Share and BPS Analysis by Application, 2025 and 2035
  • Figure 11: Global Market Y-o-Y Growth Comparison by Application, 2025 to 2035
  • Figure 12: Global Market Attractiveness Analysis by Application
  • Figure 13: Global Market Value (USD Billion) Share and BPS Analysis by Region, 2025 and 2035
  • Figure 14: Global Market Y-o-Y Growth Comparison by Region, 2025 to 2035
  • Figure 15: Global Market Attractiveness Analysis by Region
  • Figure 16: USA Market Incremental $ Opportunity, 2025 to 2035
  • Figure 17: Latin America Market Incremental $ Opportunity, 2025 to 2035
  • Figure 18: Western Europe Market Incremental $ Opportunity, 2025 to 2035
  • Figure 19: Eastern Europe Market Incremental $ Opportunity, 2025 to 2035
  • Figure 20: East Asia Market Incremental $ Opportunity, 2025 to 2035
  • Figure 21: South Asia & Pacific Market Incremental $ Opportunity, 2025 to 2035
  • Figure 22: Middle East and Africa Market Incremental $ Opportunity, 2025 to 2035
  • Figure 23: USA Market Value Share and BPS Analysis by Country, 2025 and 2035
  • Figure 24: USA Market Value Share and BPS Analysis by System, 2025 and 2035
  • Figure 25: USA Market Y-o-Y Growth Comparison by System, 2025 to 2035
  • Figure 26: USA Market Attractiveness Analysis by System
  • Figure 27: USA Market Value Share and BPS Analysis by Design, 2025 and 2035
  • Figure 28: USA Market Y-o-Y Growth Comparison by Design, 2025 to 2035
  • Figure 29: USA Market Attractiveness Analysis by Design
  • Figure 30: USA Market Value Share and BPS Analysis by Application, 2025 and 2035
  • Figure 31: USA Market Y-o-Y Growth Comparison by Application, 2025 to 2035
  • Figure 32: USA Market Attractiveness Analysis by Application
  • Figure 33: Latin America Market Value Share and BPS Analysis by Country, 2025 and 2035
  • Figure 34: Latin America Market Value Share and BPS Analysis by System, 2025 and 2035
  • Figure 35: Latin America Market Y-o-Y Growth Comparison by System, 2025 to 2035
  • Figure 36: Latin America Market Attractiveness Analysis by System
  • Figure 37: Latin America Market Value Share and BPS Analysis by Design, 2025 and 2035
  • Figure 38: Latin America Market Y-o-Y Growth Comparison by Design, 2025 to 2035
  • Figure 39: Latin America Market Attractiveness Analysis by Design
  • Figure 40: Latin America Market Value Share and BPS Analysis by Application, 2025 and 2035
  • Figure 41: Latin America Market Y-o-Y Growth Comparison by Application, 2025 to 2035
  • Figure 42: Latin America Market Attractiveness Analysis by Application
  • Figure 43: Western Europe Market Value Share and BPS Analysis by Country, 2025 and 2035
  • Figure 44: Western Europe Market Value Share and BPS Analysis by System, 2025 and 2035
  • Figure 45: Western Europe Market Y-o-Y Growth Comparison by System, 2025 to 2035
  • Figure 46: Western Europe Market Attractiveness Analysis by System
  • Figure 47: Western Europe Market Value Share and BPS Analysis by Design, 2025 and 2035
  • Figure 48: Western Europe Market Y-o-Y Growth Comparison by Design, 2025 to 2035
  • Figure 49: Western Europe Market Attractiveness Analysis by Design
  • Figure 50: Western Europe Market Value Share and BPS Analysis by Application, 2025 and 2035
  • Figure 51: Western Europe Market Y-o-Y Growth Comparison by Application, 2025 to 2035
  • Figure 52: Western Europe Market Attractiveness Analysis by Application
  • Figure 53: Eastern Europe Market Value Share and BPS Analysis by Country, 2025 and 2035
  • Figure 54: Eastern Europe Market Value Share and BPS Analysis by System, 2025 and 2035
  • Figure 55: Eastern Europe Market Y-o-Y Growth Comparison by System, 2025 to 2035
  • Figure 56: Eastern Europe Market Attractiveness Analysis by System
  • Figure 57: Eastern Europe Market Value Share and BPS Analysis by Design, 2025 and 2035
  • Figure 58: Eastern Europe Market Y-o-Y Growth Comparison by Design, 2025 to 2035
  • Figure 59: Eastern Europe Market Attractiveness Analysis by Design
  • Figure 60: Eastern Europe Market Value Share and BPS Analysis by Application, 2025 and 2035
  • Figure 61: Eastern Europe Market Y-o-Y Growth Comparison by Application, 2025 to 2035
  • Figure 62: Eastern Europe Market Attractiveness Analysis by Application
  • Figure 63: East Asia Market Value Share and BPS Analysis by Country, 2025 and 2035
  • Figure 64: East Asia Market Value Share and BPS Analysis by System, 2025 and 2035
  • Figure 65: East Asia Market Y-o-Y Growth Comparison by System, 2025 to 2035
  • Figure 66: East Asia Market Attractiveness Analysis by System
  • Figure 67: East Asia Market Value Share and BPS Analysis by Design, 2025 and 2035
  • Figure 68: East Asia Market Y-o-Y Growth Comparison by Design, 2025 to 2035
  • Figure 69: East Asia Market Attractiveness Analysis by Design
  • Figure 70: East Asia Market Value Share and BPS Analysis by Application, 2025 and 2035
  • Figure 71: East Asia Market Y-o-Y Growth Comparison by Application, 2025 to 2035
  • Figure 72: East Asia Market Attractiveness Analysis by Application
  • Figure 73: South Asia & Pacific Market Value Share and BPS Analysis by Country, 2025 and 2035
  • Figure 74: South Asia & Pacific Market Value Share and BPS Analysis by System, 2025 and 2035
  • Figure 75: South Asia & Pacific Market Y-o-Y Growth Comparison by System, 2025 to 2035
  • Figure 76: South Asia & Pacific Market Attractiveness Analysis by System
  • Figure 77: South Asia & Pacific Market Value Share and BPS Analysis by Design, 2025 and 2035
  • Figure 78: South Asia & Pacific Market Y-o-Y Growth Comparison by Design, 2025 to 2035
  • Figure 79: South Asia & Pacific Market Attractiveness Analysis by Design
  • Figure 80: South Asia & Pacific Market Value Share and BPS Analysis by Application, 2025 and 2035
  • Figure 81: South Asia & Pacific Market Y-o-Y Growth Comparison by Application, 2025 to 2035
  • Figure 82: South Asia & Pacific Market Attractiveness Analysis by Application
  • Figure 83: Middle East and Africa Market Value Share and BPS Analysis by Country, 2025 and 2035
  • Figure 84: Middle East and Africa Market Value Share and BPS Analysis by System, 2025 and 2035
  • Figure 85: Middle East and Africa Market Y-o-Y Growth Comparison by System, 2025 to 2035
  • Figure 86: Middle East and Africa Market Attractiveness Analysis by System
  • Figure 87: Middle East and Africa Market Value Share and BPS Analysis by Design, 2025 and 2035
  • Figure 88: Middle East and Africa Market Y-o-Y Growth Comparison by Design, 2025 to 2035
  • Figure 89: Middle East and Africa Market Attractiveness Analysis by Design
  • Figure 90: Middle East and Africa Market Value Share and BPS Analysis by Application, 2025 and 2035
  • Figure 91: Middle East and Africa Market Y-o-Y Growth Comparison by Application, 2025 to 2035
  • Figure 92: Middle East and Africa Market Attractiveness Analysis by Application
  • Figure 93: Global Market - Tier Structure Analysis
  • Figure 94: Global Market - Company Share Analysis

Frequently Asked Questions

What is the current value of the power swivels market in 2025?

The market is valued at USD 1.4 billion in 2025.

What is the projected size of the power swivels market by 2035?

The market is expected to reach USD 2.2 billion by 2035.

What is the forecasted CAGR of the power swivels market during 2025 to 2035?

The market is expected to grow at a CAGR of 4.4% from 2025 to 2035.

What is the share of gear-based designs in the power swivels market in 2025?

Gear-based designs are expected to account for 60% of the market share in 2025 due to their durability and reliability.

Which country has the fastest growth rate in the power swivels market?

The USA is the fastest-growing country with a projected CAGR of 4.8% from 2025 to 2035.

Explore Similar Insights

Future Market Insights

Power Swivels Market