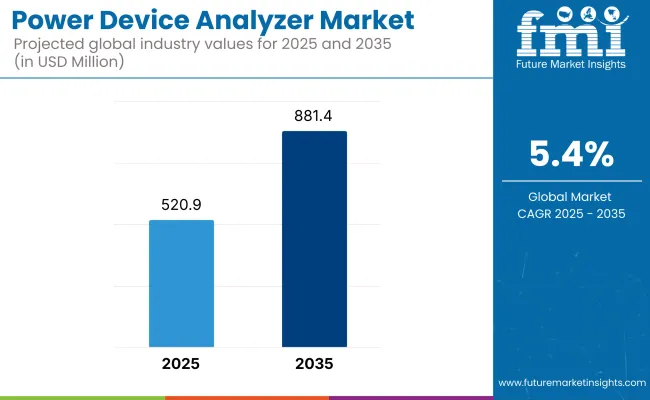
The Power Device Analyzer Market is set to witness steady growth between 2025 and 2035, primarily driven by the increasing demand for efficient power monitoring and energy optimization across industrial and commercial sectors. The market is expected to be valued at USD 520.9 million in 2025 and is projected to reach USD 881.4 million by 2035, reflecting a compound annual growth rate (CAGR) of 5.4% during the forecast period.

One of the major factors fueling market growth is the rising adoption of renewable energy sources and electric vehicles (EVs). With the growing focus on energy conservation and grid efficiency, industries are shifting towards precise power measurement solutions to enhance power management, improve energy utilization, and ensure compliance with regulatory standards. As power grids become more complex with the integration of renewable sources, power device analyzers are becoming critical for monitoring energy distribution and minimizing losses.
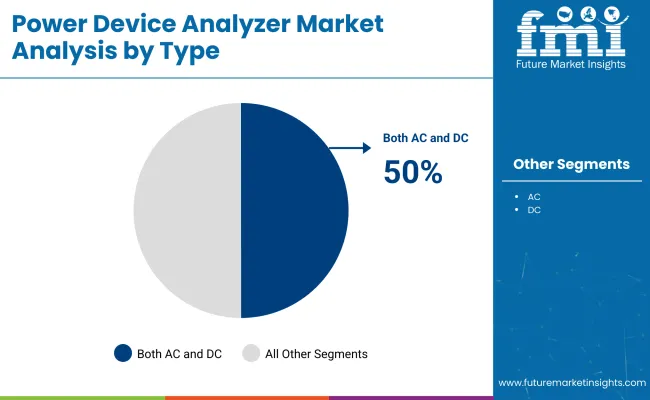
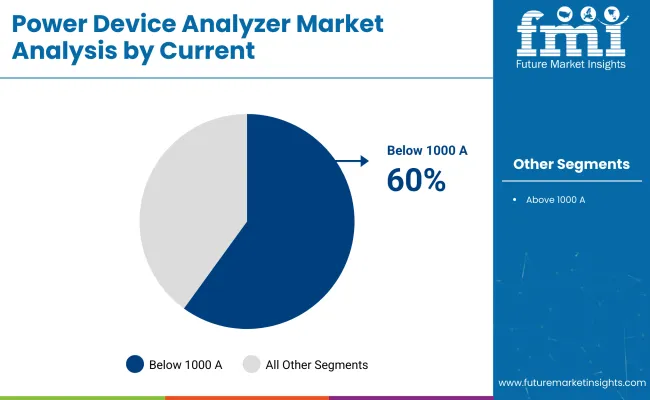
The market is segmented by Type and Current Capacity. The key types include Both AC and DC, AC, and DC, while the current capacity segmentation consists of Below 1000 A and Above 1000 A.
Among these, Both AC and DC power device analyzers lead the market because of their wide usage across various industries. These analyzers are used heavily in automotive, aerospace, energy, and industrial automation industries since they offer in-depth power analysis for alternating as well as direct currents.
As more hybrid electric vehicles (HEVs), electric vehicle charging infrastructure, and renewable energy are being adopted, the market for dual AC/DC analyzers has risen dramatically. The current capacity Below 1000 A analyzers are also dominating the segment due to their capability to support numerous industrial applications and providing high precision and efficiency in the case of general electrical measurement.
Due to a robust electronics, semiconductor, and automotive industry, North America is a high-value market for power device analyzers. The Power Testing Market in North America is projected to be the largest market over the next few years; The market is primarily driven by the United States and Canada due to rising demand from end-use industries including electric fleet (EV), renewable energy integration and industrial automation.
Increasing focus on energy efficiency in the region and rising development of advanced power devices including silicon carbide (SiC) and gallium nitride (GaN) semiconductors also creates demand for high end power analysis equipment. Next will come the industry focused on reducing energy consumption, helped along by regulatory needs by agencies such as the USA Department of Energy (DOE) and the Environmental Protection Agency (EPA) creating stricter regulation and more expenditure on energy metering and efficiency testing solutions.
Europe holds a major share of the power device analyzer market due to the very high demand coming from Germany, the United Kingdom, and France. It has a robust automotive and industrial automation industry, both of which require accurate power testing and efficiency monitoring solutions.
Due to the EU high energy efficiency standards and carbon emissions reduction regulations, businesses are taking a proactive approach and investing in power device analyzers to work within the limits of the rules and improve power consumption. Growing demand of electric mobility and rising renewable energy projects in Europe has also led to increased need for power testing solutions.
Leading companies are also integrating digital solutions and cloud-based monitoring systems to ensure power analysis is accurate and reliable for various industrial applications.
The Asia-Pacific region is expected to grow at the fastest rate in the power device analyzer market, fueled by rapid industrialization, expansion of the semiconductor industry, and increasing demand for consumer electronics. Countries like China, Japan, South Korea, and India are major consumers and producers of power testing equipment, with China leading in market size due to its dominance in electronics manufacturing and renewable energy deployment.
The rise of electric vehicles and 5G infrastructure in Japan and South Korea has further accelerated investments in power measurement solutions. Additionally, the region’s aggressive push toward renewable energy and grid modernization projects is increasing the need for power analyzers to ensure efficient energy distribution and storage. However, as the region expands its industrial and electronics manufacturing capabilities, challenges related to standardization and interoperability of power testing solutions must be addressed.
Challenge: High Initial Investment Costs
One of the most significant challenges faced by the power device analyzer market is the exorbitant amount of initial investment in sophisticated power testing and analysis tools. SMEs cannot afford high-accuracy analyzers, thus preventing its mass adoption.
Furthermore, making power analyzers compatible with pre-existing testing and manufacturing systems requires technical expertise, thus further increasing the cost of operation. Frequent calibration and maintenance to preserve measurement accuracy are also an added cost.
Opportunity: Growth of Electric Vehicles and Renewable Energy
Electrified cars and renewable energy grids are a major opportunity for power device analyzers. As implementation of battery technologies, solar inverters, and power-saving semiconductors is increasing, sophisticated power measurement devices are genuinely in demand.
The main challenge is the optimization of their R&D efforts for higher power conversion efficiency and energy storage management, which has led EV makers and renewable power firms to widely use power analyzers in R&D and quality assurance. Additionally, the use of Analytics enabled with AI and IoT in power device analyzers will also drive these mechanical devices with real-time performance monitoring and predictive maintenance, hence creating new revenue pockets for the market players.
Between 2020 and 2024, the power device analyzer market witnessed significant growth, driven by increasing demand for energy efficiency, the rapid expansion of electric vehicles (EVs), and advancements in renewable energy integration. The adoption of high-power semiconductor devices in industries such as automotive, aerospace, and power generation accelerated the need for precision testing and analysis tools.
The shift toward smart grid infrastructure and stringent energy efficiency regulations further boosted the deployment of power device analyzers for real-time power quality monitoring and optimization.
Between 2025 and 2035, the power device analyzer market will undergo transformative changes, driven by AI-powered energy management, autonomous power monitoring systems, and quantum-enhanced measurement technologies. The adoption of next-generation semiconductor testing solutions, block chain-based energy data tracking, and self-optimizing power measurement systems will redefine efficiency and accuracy in power analysis.
The transition toward AI-assisted grid management and autonomous energy auditing will further drive demand for advanced power device analyzers.
Market Shifts: A Comparative Analysis 2020 to 2024 vs. 2025 to 2035
| Market Shift | 2020 to 2024 |
|---|---|
| Regulatory Landscape | Stricter energy efficiency norms, semiconductor testing regulations, and safety standards for power electronics. |
| Technological Advancements | AI-integrated power analysis, high-speed data acquisition, and modular power measurement solutions. |
| Industry Applications | Electric mobility, renewable energy, industrial automation, and smart grid integration. |
| Adoption of Smart Equipment | IoT-enabled power analyzers, real-time cloud-based power monitoring, and portable testing solutions. |
| Sustainability & Cost Efficiency | Energy-efficient semiconductor testing, cloud-integrated power audits, and modular low-power analyzers. |
| Data Analytics & Predictive Modeling | AI-based power failure prediction, cloud-integrated energy diagnostics, and real-time power consumption analytics. |
| Production & Supply Chain Dynamics | COVID-19 supply chain disruptions, semiconductor shortages impacting power analyzer availability, and increased demand for portable analyzers. |
| Market Growth Drivers | Growth driven by EV expansion, renewable energy adoption, and smart grid infrastructure development. |
| Market Shift | 2025 to 2035 |
|---|---|
| Regulatory Landscape | AI-powered compliance tracking, block chain-secured energy audits, and sustainability-driven power measurement standards. |
| Technological Advancements | Quantum-enhanced power analytics, AI-assisted autonomous power monitoring, and self-calibrating analyzers. |
| Industry Applications | Expansion into AI-driven power diagnostics, aerospace energy optimization, and autonomous smart infrastructure power management. |
| Adoption of Smart Equipment | Fully autonomous AI-driven power measurement, decentralized edge computing for energy analytics, and smart grid-integrated power diagnostics. |
| Sustainability & Cost Efficiency | Green power analysis solutions, ultra-low energy testing systems, and blockchain-powered carbon footprint tracking in power testing. |
| Data Analytics & Predictive Modeling | Quantum-enhanced predictive modeling for power devices, decentralized AI-driven energy audits, and blockchain-secured energy data tracking. |
| Production & Supply Chain Dynamics | AI-optimized semiconductor supply chains, decentralized manufacturing of power analysis tools, and blockchain-enabled quality control in production. |
| Market Growth Drivers | AI-powered autonomous energy management, quantum computing for ultra-precise power measurement, and expansion into next-gen smart energy ecosystems. |

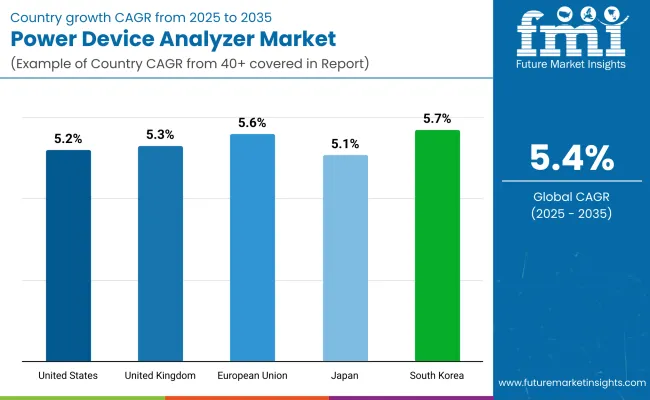
The market for USA power device analyzers is growing with the growing use of electric vehicles (EVs), the high rate of renewable energy installations, and the growing demand for power-efficient electronic devices. The availability of top semiconductor and power electronics players is fueling investment in cutting-edge power measurement solutions.
The growth of the market is also being driven by government policies aimed at energy efficiency and the modernization of the electrical grid. The movement towards high-performance testing instrumentation in defense, aerospace, and telecommunication industries also drives demand for power device analyzers.
| Country | CAGR (2025 to 2035) |
|---|---|
| USA | 5.2% |
Due to the heavy emphasis on energy transition, increased investment in smart grids, and better control of power sectors for charging infrastructure of electric vehicles (EVs), the UK market for power device analyzers is expected to grow. Demand for these solutions is driven by government policies to improve energy efficiency and the shift to carbon-free power generation.
The rapid development of the renewable energy sector, particularly wind and solar energy, is also driving the demand for accurate power analysis tools. That, along with increased use of power device analyzers in research and development centers and industrial automation, is fueling market growth.
| Country | CAGR (2025 to 2035) |
|---|---|
| UK | 5.3% |
The European Union power device analyzer market is experiencing robust growth with the imposition of strict energy efficiency standards, growing R&D spending on power electronics, and the fast-paced adoption of electric mobility solutions. Germany, France, and Italy are leading this market with government incentives for the installation of smart grids and the growth of renewable energy.
The rising demand for high-precision power measuring solutions in the semiconductor, automotive, and industrial markets is also driving market growth further. Moreover, sustainability consideration and the imposition of stringent emission cutback objectives are motivating industries to minimize power consumption through sophisticated analysis tools.
| Country | CAGR (2025 to 2035) |
|---|---|
| European Union | 5.6% |
Japan's power device analyzer market is driven by its highly developed semiconductor and electronics industry, growing demand for next generation power devices, and strong government assistance for energy-efficient technologies. India's pursuit for electric mobility, smart energy systems, and high performance industrial automation is driving demand for precise power testing solutions.
Further, GaN and SiC-based power devices for high-voltage applications are driving the development of new power measurement technologies. Integration of renewable energy sources into the Japanese power grid is also increasing demand for dependable and precise power analyzers.
| Country | CAGR (2025 to 2035) |
|---|---|
| Japan | 5.1% |
South Korea's power device analyzer market is recording steady growth as a result of its robust presence in the semiconductor and consumer electronics sector, along with its leadership in 5G infrastructure development. South Korea's aggressive promotion of renewable energy consumption and smart grid implementation is generating strong demand for power testing solutions of high precision.
The fast-growing EV production and battery development are also fueling investment in power electronics testing. Government policies favoring energy-efficient technology and industrial automation are adding to market growth further.
| Country | CAGR (2025 to 2035) |
|---|---|
| South Korea | 5.4% |

| By Type | Value Share 2025 |
|---|---|
| Both AC and DC | 50% |
Both AC and DC power device analyzers have become the most rapidly growing segment in the market, providing integrated solutions that measure and analyze electrical parameters in various applications. In contrast to traditional single-function testers, these analyzers give detailed information on voltage, current, power, harmonics, and efficiency under alternating and direct current conditions.
Rising demand for high-functionality test solutions in the development of electric vehicles (EVs), the integration of renewable energy, and industrial automation has driven the deployment of AC and DC power device analyzers.The growth of real-time power analysis functionality, with high-speed data acquisition, automated waveform analysis, and multi-channel testing in real-time, has fueled market demand, providing accurate and efficient measurement for production and research environments.
The incorporation of AI-based analytics in power device analyzers, with machine learning-based fault detection, predictive maintenance features, and smart reporting capabilities, has also increased adoption, providing improved efficiency in industrial and laboratory environments.
Software-driven advancements in the form of cloud-based power monitoring, remote diagnostics, and automated reporting have maximized market growth with effortless integration into Industry 4.0 and smart manufacturing environments. Implementation of environmentally friendly power analysis solutions with energy-saving test benches, low-power measurement equipment, and recyclable test system components has augmented market growth with alignment with international sustainability drives.
While it is superior to others in flexibility, accuracy of measurement, and industrial usage, the AC and DC power device analyzer segment is hampered by high initial costs, complicated calibration, and incompatibility with old test systems. Nevertheless, new developments in modular testing platforms, AI-based calibration methods, and block chain-protected measurement verification are enhancing accuracy, efficiency, and data integrity, guaranteeing sustained growth for power device analyzers with compatibility for both AC and DC applications globally.

| By Current | Value Share 2025 |
|---|---|
| Below 1000 A | 60% |
Power device analyzers with current measurement ranges below 1000 A have seen robust market uptake, especially in semiconductor testing, battery management, and precision electronics applications. In contrast to high-current analyzers, these instruments are designed to address low to medium power systems, providing precise analysis of efficiency, thermal characteristics, and dynamic power variations.
Growing demand for power-efficient electronics with low-power semiconductor devices, smart sensors, and battery-powered products has driven demand for below 1000 A power device analyzer, as the need for accuracy testing for improved performance is sought by manufacturers.
The growth of ultra-accurate power measurement technologies, with Nano ampere sensitivity, high-bandwidth signal processing, and real-time transient analysis, has fueled market demand, guaranteeing sophisticated testing solutions for sensitive electronics.
The incorporation of AI-driven automation in low-current analyzers, with intelligent waveform recognition, automated calibration, and adaptive power consumption profiling, has further accelerated adoption, guaranteeing error-free and smooth measurements. The evolution of wireless and portable power device analyzers, with small form factors, Bluetooth-supported data logging and remote access, has maximized market growth, with convenience of use in distributed energy systems and field testing.
The use of environmentally friendly testing practices, with energy-efficient laboratory facilities, testing equipment powered by renewable energy, and green calibration processes, has supported market growth, with adherence to environmental regulations. Though it enjoys strengths in precision measurement, power efficiency testing, and support for semiconductor applications, the below 1000 A power device analyzer market is hindered by certain limitations like poor scalability for high-power systems, vulnerability to external electrical interference, and costliness of ultra-precise measurement elements.
But some upcoming innovations in AI-based noise cancellation, cloud-based integrated data processing, and subminiature power analysis modules are enhancing accuracy, dependability, and cost-effectiveness, thus promising sustained market expansion for low-current power device analyzers globally.
The Power Device Analyzer market is experiencing significant growth, driven by the increasing adoption of energy-efficient devices across various industries. Power device analyzers are essential for measuring and analyzing the electrical characteristics of power devices, ensuring optimal performance and compliance with stringent energy regulations.
The rising demand for electric vehicles, renewable energy systems, and advanced consumer electronics further propels market expansion. Leading companies are focusing on technological advancements, product innovation, and strategic partnerships to enhance their market presence.
Market Share Analysis by Company
| Company Name | Estimated Market Share (%) |
|---|---|
| Keysight Technologies | 20-25% |
| Yokogawa Electric Corporation | 15-20% |
| Fluke Corporation | 10-15% |
| Hioki E.E. Corporation | 8-12% |
| Iwatsu Electric Co., Ltd. | 5-8% |
| Other Companies (combined) | 20-30% |
| Company Name | Key Offerings/Activities |
|---|---|
| Keysight Technologies | In 2022, launched a next-generation Double-Pulse Tester (DPT) for efficient testing of power modules. |
| Yokogawa Electric Corporation | Provides advanced power analyzers with high precision for energy efficiency evaluations. |
| Fluke Corporation | Offers rugged and reliable power quality analyzers suitable for industrial applications. |
| Hioki E.E. Corporation | In 2023, introduced a new power analyzer model with enhanced accuracy for renewable energy applications. |
| Iwatsu Electric Co., Ltd. | Supplies a range of measurement instruments, including power analyzers for various electrical testing needs. |
Key Company Insights
Keysight Technologies (20-25%)
A leading player in the power device analyzer market, Keysight focuses on innovation and quality. The May 2022 launch of their next-generation Double-Pulse Tester (DPT) enhances testing efficiency for power modules, catering to the growing needs of the industry.
Yokogawa Electric Corporation (15-20%)
Known for its high-precision measurement instruments, Yokogawa offers advanced power analyzers that support energy efficiency evaluations across various sectors. The company's commitment to accuracy and reliability has solidified its position in the market.
Fluke Corporation (10-15%)
Fluke provides durable and dependable power quality analyzers ideal for industrial applications. Its products are well known to be easy-to-use and rugged, and to be a first choice among professionals who require reliable measurement solutions.
Hioki E.E. Corporation (8-12%)
Hioki plans to release a model of power analyzer in 2023 that boasts enhanced accuracy and is geared toward renewable energy. This decision is indicative of Hioki's endeavors toward contributing to sustainable energy projects through exact measurement technologies.
Iwatsu Electric Co., Ltd. (5-8%)
Iwatsu offers a comprehensive range of measurement instruments, including power analyzers that cater to diverse electrical testing requirements. Their products are utilized across multiple industries, reflecting the company's versatility and expertise in the field.
Other Key Players (20-30% Combined)
The power device analyzer market also includes several regional and emerging companies contributing to its growth. Notable mentions include:
The overall market size for power device analyser market was USD 520.9 Million in 2025.
The power device analyser market is expected to reach USD 881.4 Million in 2035.
The increasing demand for efficient power monitoring and energy optimization across industrial and commercial sectors fuels Power device analyzer Market during the forecast period.
The top 5 countries which drives the development of Power device analyzer Market are USA, UK, Europe Union, Japan and South Korea.
On the basis of type, both AC and DC to command significant share over the forecast period.


Our Research Products

The "Full Research Suite" delivers actionable market intel, deep dives on markets or technologies, so clients act faster, cut risk, and unlock growth.

The Leaderboard benchmarks and ranks top vendors, classifying them as Established Leaders, Leading Challengers, or Disruptors & Challengers.

Locates where complements amplify value and substitutes erode it, forecasting net impact by horizon

We deliver granular, decision-grade intel: market sizing, 5-year forecasts, pricing, adoption, usage, revenue, and operational KPIs—plus competitor tracking, regulation, and value chains—across 60 countries broadly.

Spot the shifts before they hit your P&L. We track inflection points, adoption curves, pricing moves, and ecosystem plays to show where demand is heading, why it is changing, and what to do next across high-growth markets and disruptive tech

Real-time reads of user behavior. We track shifting priorities, perceptions of today’s and next-gen services, and provider experience, then pace how fast tech moves from trial to adoption, blending buyer, consumer, and channel inputs with social signals (#WhySwitch, #UX).

Partner with our analyst team to build a custom report designed around your business priorities. From analysing market trends to assessing competitors or crafting bespoke datasets, we tailor insights to your needs.
Supplier Intelligence
Discovery & Profiling
Capacity & Footprint
Performance & Risk
Compliance & Governance
Commercial Readiness
Who Supplies Whom
Scorecards & Shortlists
Playbooks & Docs
Category Intelligence
Definition & Scope
Demand & Use Cases
Cost Drivers
Market Structure
Supply Chain Map
Trade & Policy
Operating Norms
Deliverables
Buyer Intelligence
Account Basics
Spend & Scope
Procurement Model
Vendor Requirements
Terms & Policies
Entry Strategy
Pain Points & Triggers
Outputs
Pricing Analysis
Benchmarks
Trends
Should-Cost
Indexation
Landed Cost
Commercial Terms
Deliverables
Brand Analysis
Positioning & Value Prop
Share & Presence
Customer Evidence
Go-to-Market
Digital & Reputation
Compliance & Trust
KPIs & Gaps
Outputs
Full Research Suite comprises of:
Market outlook & trends analysis
Interviews & case studies
Strategic recommendations
Vendor profiles & capabilities analysis
5-year forecasts
8 regions and 60+ country-level data splits
Market segment data splits
12 months of continuous data updates
DELIVERED AS:
PDF EXCEL ONLINE
Three Phase Power Device Analyzer Market Size and Share Forecast Outlook 2025 to 2035
Power Grid Fault Prediction Service Market Size and Share Forecast Outlook 2025 to 2035
Power Plant Boiler Market Forecast Outlook 2025 to 2035
Power Ring Rolling Machine Market Size and Share Forecast Outlook 2025 to 2035
Power Supply Equipment for Data Center Market Size and Share Forecast Outlook 2025 to 2035
Power Electronics Market Size and Share Forecast Outlook 2025 to 2035
Power Quality Equipment Market Size and Share Forecast Outlook 2025 to 2035
Power Generator for Military Market Size and Share Forecast Outlook 2025 to 2035
Power Tools Market Size and Share Forecast Outlook 2025 to 2035
Power Supply Isolation Equipment Market Size and Share Forecast Outlook 2025 to 2035
Power Window Lift Motor Market Size and Share Forecast Outlook 2025 to 2035
Powered Surgical Staplers Market Size and Share Forecast Outlook 2025 to 2035
Power Distribution Component Market Size and Share Forecast Outlook 2025 to 2035
Power Over Ethernet (PoE) Controllers Market Size and Share Forecast Outlook 2025 to 2035
Power Inverter Market Size and Share Forecast Outlook 2025 to 2035
Power Sports Market Size and Share Forecast Outlook 2025 to 2035
Power Conditioner Market Size and Share Forecast Outlook 2025 to 2035
Power Transmission Component Market Size and Share Forecast Outlook 2025 to 2035
Power Optimizer Market Size and Share Forecast Outlook 2025 to 2035
Power Plants Heavy Duty Gas Turbine Market Size and Share Forecast Outlook 2025 to 2035

Thank you!
You will receive an email from our Business Development Manager. Please be sure to check your SPAM/JUNK folder too.
Chat With
MaRIA