The Three Phase Power Device Analyzer Market is estimated to be valued at USD 429.5 million in 2025 and is projected to reach USD 693.0 million by 2035, registering a compound annual growth rate (CAGR) of 4.9% over the forecast period. This reflects a 1.61x market expansion with a CAGR of 4.9%, signaling gradual adoption across industrial power testing, R&D, and electrical grid calibration applications. The absolute gain points to consistent demand from sectors requiring multi-phase load evaluation, power efficiency verification, and system harmonics measurement.
By 2030, the market is expected to reach approximately USD 540 million, capturing nearly USD 110.5 million of the opportunity within the first half of the decade. This accounts for around 42% of the total absolute growth. The remaining USD 153 million, or 58%, is anticipated between 2030 and 2035, indicating a moderately back-weighted growth trend. The second half is expected to benefit from expanded electrification efforts in transportation, smart grid diagnostics, and test automation in semiconductor production.
Companies such as Hioki and Yokogawa have been upgrading three-phase analyzers with real-time waveform capture, higher sampling resolution, and multi-channel synchronization. Growth in absolute dollar terms is being driven by rising adoption in power electronics, inverter characterization, and compliance testing under evolving IEC standards.
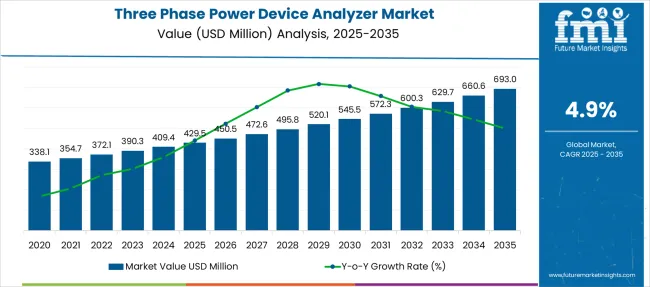
| Metric | Value |
|---|---|
| Three Phase Power Device Analyzer Market Estimated Value in (2025 E) | USD 429.5 million |
| Three Phase Power Device Analyzer Market Forecast Value in (2035 F) | USD 693.0 million |
| Forecast CAGR (2025 to 2035) | 4.9% |
The three-phase power device analyzer market accounts for approximately 34% of the electrical testing and measurement equipment market, with broad use in monitoring load behavior, energy efficiency, and fault detection. It contributes nearly 28% to the power electronics market, where it supports analysis of converters, drives, and inverters across high-frequency systems. Around 22% of the industrial automation and control systems market includes these analyzers for motor testing and machinery calibration.
The segment holds about 26% of the energy monitoring and management systems market, as facilities adopt precision tools to optimize energy usage. Within the grid infrastructure and utility diagnostics market, it captures roughly 18%, applied in grid balancing, transformer diagnostics, and substation equipment validation.
The market is witnessing rapid transformation driven by emerging breakthroughs in precision measurement, connectivity and sustainability applications. Real‑time measurement platforms now incorporate AI‑powered anomaly detection and machine learning analysis to enable predictive maintenance and deeper energy insights. Miniaturized and handheld analyzers are gaining traction for field diagnostics while high‑precision, multi‑channel systems support testing in EV charging infrastructure, wide‑bandgap semiconductor (SiC and GaN) devices and smart grid installations.
These analyzers now offer both AC and DC waveform analysis combined with cloud data logging and remote access tools, enabling distributed engineering teams to collaborate and optimize performance workflows across energy, automotive and industrial automation sectors.
The shift toward energy-efficient systems and the proliferation of electric and hybrid vehicles have significantly increased the need for high-performance power analyzers capable of capturing detailed power profiles under dynamic conditions.
Regulatory pressure to ensure product compliance and performance validation has further reinforced market adoption. Additionally, integration with digital monitoring platforms and enhancements in user interface design have made modern analyzers more accessible to both field engineers and laboratory professionals.
As industries continue to invest in next-generation technologies and renewable energy solutions, the importance of accurate multi-phase power measurement is expected to escalate, supporting sustained market growth across both developed and emerging economies.
The three phase power device analyzer market is segmented by current, product, application, and region. By current, it is divided into ≤1,000 A and >1,000 A, addressing different measurement capacities. In terms of product, the segmentation includes both AC & DC, AC, and DC models, supporting varied testing requirements. Based on application, the market covers automotive, consumer electronics, energy, telecom, healthcare, and other industrial sectors, highlighting its broad usage across critical domains. Regionally, the market encompasses North America, Latin America, Western and Eastern Europe, Balkan and Baltic countries, Russia and Belarus, Central Asia, East Asia, South Asia and Pacific, and the Middle East and Africa.
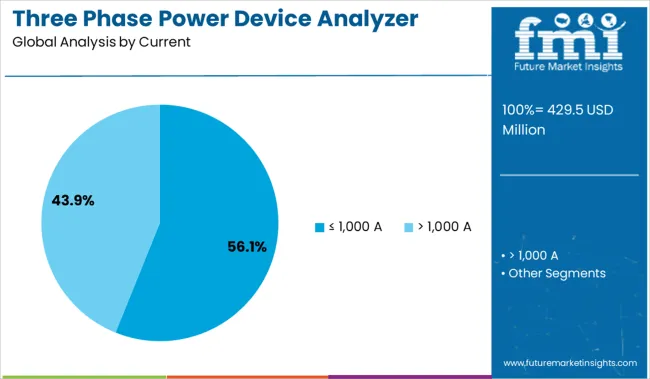
The ≤ 1,000 A current segment dominates the market with a 56.1% share, primarily due to its broad applicability in low to medium power environments, including automotive systems, electronic appliances, and laboratory equipment testing. This current range is optimal for most commercial and industrial testing needs, providing high precision without the complexity or cost associated with higher current ranges.
Manufacturers are enhancing device capabilities within this segment by incorporating high sampling rates, harmonic analysis, and real-time data logging, making them highly effective for energy efficiency evaluations and compliance testing.
As power efficiency and compact equipment design become more critical across industries, demand for analyzers that operate efficiently under 1,000 A is expected to remain strong. This segment’s continued relevance is supported by its compatibility with a wide range of electrical devices and systems, particularly in fast-growing sectors like e-mobility and consumer electronics.
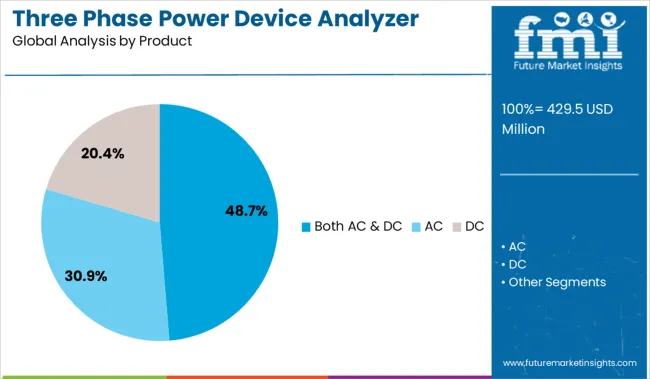
The both AC & DC product segment leads the market with a 48.7% share, driven by its ability to accommodate modern electrical systems that increasingly rely on hybrid power sources. These analyzers offer flexibility in testing across a wide range of applications, including renewable energy systems, EV charging stations, and power converters.
Their dual-mode functionality allows engineers to analyze power flow comprehensively, covering transient behaviors and steady-state performance under varying current and voltage conditions.
As industries demand more integrated testing solutions that eliminate the need for separate devices, the appeal of AC & DC compatible analyzers continues to grow. Ongoing advancements in sensor technology, measurement accuracy, and connectivity features further enhance the utility of this product category. With electrical systems becoming more dynamic and bidirectional, analyzers supporting both AC and DC operations are positioned for sustained demand across technical and commercial sectors.
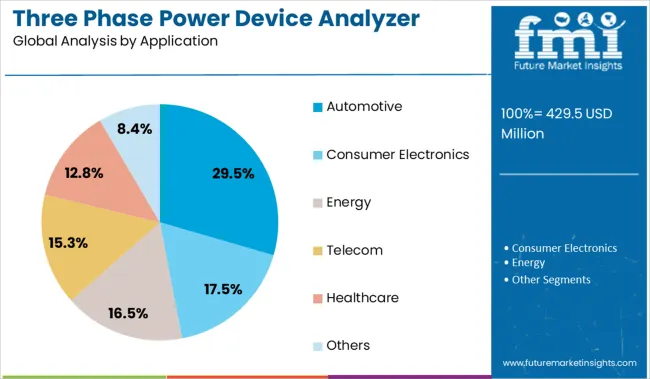
The automotive application segment accounts for 29.5% of the market, reflecting the growing need for advanced power measurement tools in the design, testing, and validation of electric and hybrid vehicles. As automotive OEMs accelerate the shift toward electrification, precise monitoring of energy consumption, power conversion efficiency, and battery performance has become critical.
Power device analyzers are essential in R&D and production settings for evaluating motors, inverters, on-board chargers, and auxiliary systems. The complexity of vehicle electrical architectures and the introduction of higher voltage platforms are increasing the requirement for three phase analyzers that deliver accuracy under fast-changing load conditions.
The segment is also benefitting from broader trends in connected mobility and ADAS integration, where power management plays a key role. With continuous innovation in vehicle powertrain design and electrification strategies, the automotive segment is expected to remain a significant and fast-growing contributor to the overall market.
The three-phase power device analyzer market is seeing strong opportunities through integration with predictive maintenance systems. From 2024 to 2025, analyzers became key components in asset management platforms, enabling real-time anomaly detection and trend-based maintenance scheduling. This shift positions vendors offering cloud-enabled, software-integrated analyzers to capture recurring revenue and long-term service contracts in industrial and energy sectors.
The growing requirement for optimal power usage and system quality has been recognized as a key catalyst in the three‑phase power device analyzer market. In 2024, heightened concerns over grid reliability led utilities and manufacturers to deploy analyzers for real-time harmonic and voltage fluctuation diagnostics. By 2025, industrial facilities were being equipped with three‑phase analyzers to enhance predictive maintenance protocols and comply with power quality benchmarks. These trends demonstrate that control over energy loss and power integrity is not optional they are essential operational priorities. Vendors offering analyzers capable of precise power quality measurement and monitoring are thus well positioned to lead in high-stakes industrial and utility environments.
In 2024, three-phase power device analyzers were integrated into enterprise asset management platforms to enable remote tracking of electrical anomalies and automatic alerting before failures occurred. By 2025, advanced analyzers were being incorporated into predictive maintenance frameworks for manufacturing plants and wind farms to support trend analysis and scheduled repairs, reducing unplanned downtime. These deployments illustrate that analyzers can evolve from standalone test instruments into core components of intelligent maintenance ecosystems.
As reliability-focused operations increasingly rely on condition-based approaches, vendors that deliver analyzer devices with seamless software integration and cloud-based reporting tools are positioned to capture long-term contracts and consistent recurring revenue.
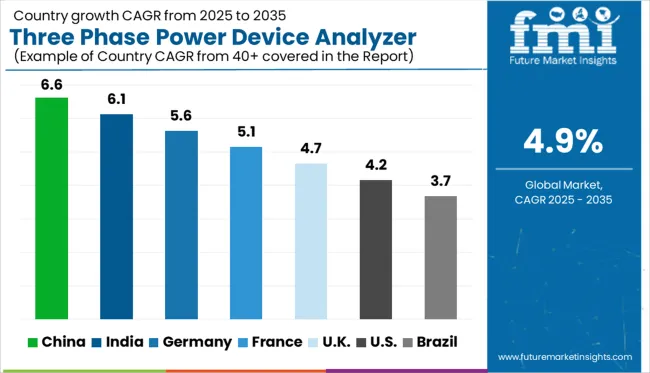
| Countries | CAGR |
|---|---|
| China | 6.6% |
| India | 6.1% |
| Germany | 5.6% |
| France | 5.1% |
| UK | 4.7% |
| USA | 4.2% |
| Brazil | 3.7% |
The global three phase power device analyzer market is projected to grow at a CAGR of 4.9% from 2025 to 2035. China leads with 6.6%, followed by India at 6.1% and Germany at 5.6%. France aligns slightly above the global average at 5.1%, while the United Kingdom posts 4.7%. China and India drive demand through manufacturing sector digitization and power quality compliance in industrial facilities. Germany focuses on precision energy monitoring in automation-heavy plants, while France and the UK emphasize integrating analyzers into renewable energy systems and conducting building energy audits.
China is projected to grow its market at a 6.6% CAGR, fueled by industrial modernization, electric mobility adoption, and grid stability programs. High-capacity factories and renewable installations use analyzers for real-time power quality monitoring and energy efficiency compliance. Domestic manufacturers are innovating with IoT-enabled analyzers that support remote diagnostics and predictive maintenance for high-load environments.
India is expected to grow at a 6.1% CAGR, supported by infrastructure expansion, smart grid projects, and energy efficiency mandates in heavy industry. Power analyzers are widely adopted in steel, cement, and textile sectors to monitor load imbalances and improve operational reliability. Vendors are offering portable models for field testing and permanent installations for manufacturing plants.
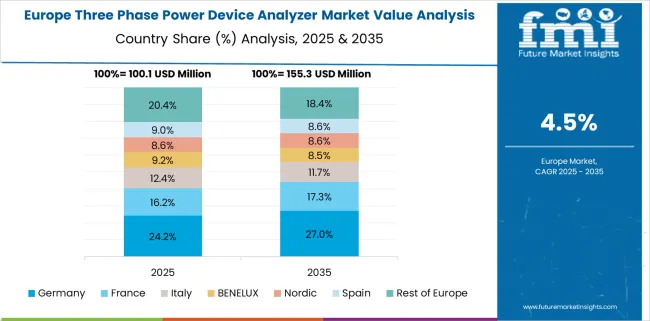
Germany is forecast to grow its three phase power device analyzer market at a 5.6% CAGR, driven by Industry 4.0 upgrades and the proliferation of renewable energy systems. Analyzers with high sampling rates and Ethernet connectivity are in demand for precision energy profiling. Adoption is strong in automotive and machine tool sectors, where power integrity is critical for automation.
France is expected to grow at a 5.1% CAGR, supported by energy transition policies and renewable integration. Utilities and building energy managers deploy analyzers to monitor voltage harmonics and load balancing in distributed networks. Portable analyzers are widely used for energy audits in commercial complexes. Domestic vendors emphasize designs with touchscreen interfaces and cloud-based reporting.
The United Kingdom is projected to grow at 4.7%, driven by smart building retrofits, EV infrastructure development, and power quality mandates. Data centers and financial institutions deploy analyzers to ensure uninterrupted operations. Demand is rising for cloud-integrated analyzers with predictive analytics capabilities to support energy optimization in mission-critical environments.
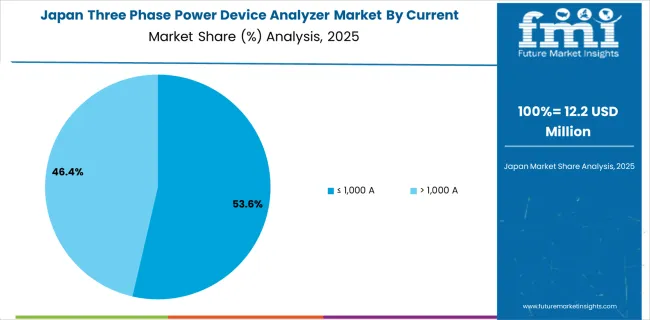
The three phase power device industry in Japan is projected to reach USD 12.2 million in 2025, representing approximately 1.8% of the global market valued at USD 693 million. Analyzers with a current rating of ≤1,000 A command the largest share at 53.6%, equivalent to around USD 6.54 million, driven by demand in EV charging setups and mid-voltage electrical systems. The >1,000 A segment holds a 46.4% share, translating to USD 5.66 million, reflecting use in high-load grid infrastructure and heavy industrial operations.
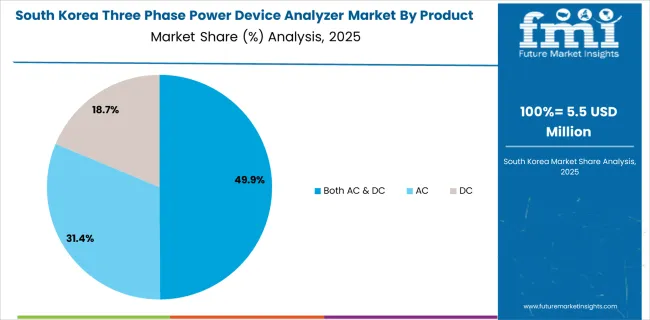
The demand for three phase power device analyzers in South Korea is estimated at USD 5.5 million in 2025, capturing around 0.8% of the global value of USD 693 million. Products supporting both AC and DC current lead the segment with 49.9% share, equating to approximately USD 2.74 million. AC-only analyzers follow at 31.4% (USD 1.73 million), while DC-only models contribute 18.7% (~USD 1.03 million). The preference for AC/DC analyzers aligns with demand for flexible instrumentation across electric vehicles, power grids, and renewable energy setups.
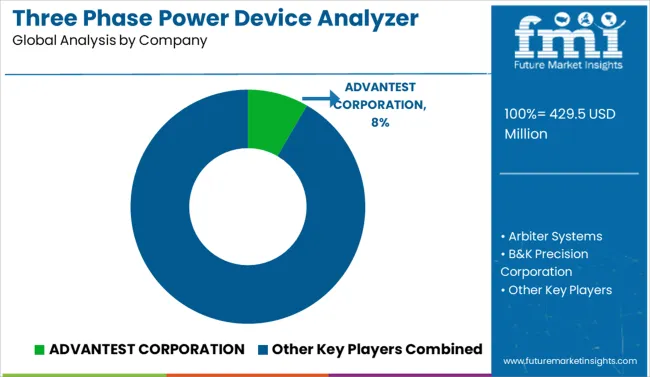
The three phase power device analyzer market is moderately consolidated, led by ADVANTEST CORPORATION with an 8.4% market share. The company holds a dominant position through its advanced semiconductor testing solutions, high-precision multi-phase measurement systems, and strong presence in power electronics applications. Dominant player status is held exclusively by ADVANTEST CORPORATION.
Key players include Arbiter Systems, B&K Precision Corporation, Carlo Gavazzi, Chroma ATE Inc., Circutor, Delta Electronics, Inc., Dewesoft, Fluke Corporation, HIOKI E.E. CORPORATION, IWATSU ELECTRIC CO., LTD., Janitza LP, Keysight Technologies, Magtrol, National Instruments Corp., Newtons4th Ltd., PCE Instruments UK Ltd., Rohde & Schwarz, Tektronix, Inc., Texas Instruments, Yokogawa Test & Measurement Corporation, and ZES ZIMMER Electronic Systems GmbH - each providing precision measurement equipment designed for power quality testing, energy efficiency validation, and compliance in industrial and research environments.
Emerging players are limited in this segment due to the technology-intensive nature of the industry and the dominance of certified global test equipment manufacturers. Market demand is driven by rising adoption of renewable energy systems, growing electric mobility infrastructure, and the increasing need for accurate performance analysis in smart grid and power conversion applications.
Manufacturers are enhancing power device analyzers with AC/DC compatibility, portable handheld and benchtop designs, real-time monitoring, cloud-driven analytics, and wireless connectivity, catering to advanced testing requirements in electric vehicles, renewable energy systems, energy storage solutions, and emerging smart-grid infrastructure applications.
| Item | Value |
|---|---|
| Quantitative Units | USD 429.5 Million |
| Current | ≤ 1,000 A and > 1,000 A |
| Product | Both AC & DC, AC, and DC |
| Application | Automotive, Consumer Electronics, Energy, Telecom, Healthcare, and Others |
| Regions Covered | North America, Europe, Asia-Pacific, Latin America, Middle East & Africa |
| Country Covered | United States, Canada, Germany, France, United Kingdom, China, Japan, India, Brazil, South Africa |
| Key Companies Profiled | ADVANTEST CORPORATION, Arbiter Systems, B&K Precision Corporation, Carlo Gavazzi, Chroma ATE Inc., Circutor, Delta Electronics, Inc., Dewesoft, Fluke Corporation, HIOKI E.E. CORPORATION, IWATSU ELECTRIC CO., LTD., Janitza LP, Keysight Technologies, Magtrol, NATIONAL INSTRUMENTS CORP., Newtons4th Ltd., PCE Instruments UK Ltd., Rohde & Schwarz, TEKTRONIX, INC., Texas Instruments, Yokogawa Test & Measurement Corporation, and ZES ZIMMER Electronic Systems GmbH |
| Additional Attributes | Dollar sales by analyzer type and accuracy class, regional demand trends, competitive landscape, buyer preferences for benchtop versus portable units, integration with IoT and data logging capabilities, innovations in real-time fault detection and AI-assisted diagnostics for predictive maintenance. |
The global three phase power device analyzer market is estimated to be valued at USD 429.5 million in 2025.
The market size for the three phase power device analyzer market is projected to reach USD 693.0 million by 2035.
The three phase power device analyzer market is expected to grow at a 4.9% CAGR between 2025 and 2035.
The key product types in three phase power device analyzer market are ≤ 1,000 a and > 1,000 a.
In terms of product, both ac & dc segment to command 48.7% share in the three phase power device analyzer market in 2025.


Full Research Suite comprises of:
Market outlook & trends analysis
Interviews & case studies
Strategic recommendations
Vendor profiles & capabilities analysis
5-year forecasts
8 regions and 60+ country-level data splits
Market segment data splits
12 months of continuous data updates
DELIVERED AS:
PDF EXCEL ONLINE
Three Wheeled Motorcycle Market Size and Share Forecast Outlook 2025 to 2035
Three-Wheel E-Scooter Market Growth - Trends & Forecast 2024 to 2034
Three Piece Cans Market
Three Phase Commercial Voltage Regulator Market Size and Share Forecast Outlook 2025 to 2035
Three Phase String Inverter Market Size and Share Forecast Outlook 2025 to 2035
Three Phase Inverter Market Size and Share Forecast Outlook 2025 to 2035
Three Phase Residential Voltage Regulator Market Size and Share Forecast Outlook 2025 to 2035
Three Phase Recloser Market Size and Share Forecast Outlook 2025 to 2035
Three Phase Micro Inverter Market Size and Share Forecast Outlook 2025 to 2035
Three Phase Shunt Reactor Market Size and Share Forecast Outlook 2025 to 2035
Three Phase Green Power Transformer Market Size and Share Forecast Outlook 2025 to 2035
Three Phase Residential Power Conditioner Market Size and Share Forecast Outlook 2025 to 2035
On-grid Three Phase PV Inverter Market Size and Share Forecast Outlook 2025 to 2035
Electric Three Wheeler Market - Trends & Forecast 2025 to 2035
Automotive Three Way Catalytic Converter Market Size and Share Forecast Outlook 2025 to 2035
Standalone Three Phase PV Inverter Market Size and Share Forecast Outlook 2025 to 2035
Air Cooled Three Phase Home Standby Gensets Market Size and Share Forecast Outlook 2025 to 2035
Commercial Three Phase Micro Inverter Market Size and Share Forecast Outlook 2025 to 2035
Phase Shifting Transformer Market Size and Share Forecast Outlook 2025 to 2035
Dual-Phase Cleanser Market Size and Share Forecast Outlook 2025 to 2035

Thank you!
You will receive an email from our Business Development Manager. Please be sure to check your SPAM/JUNK folder too.
Chat With
MaRIA