Power Electronics Market Overview

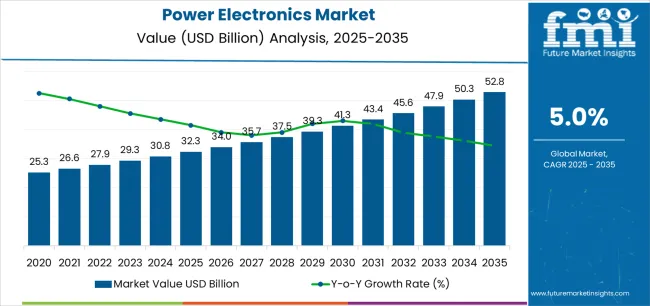
As per the updated reports of Future Market Insights, our lead analyst gives a detailed analysis of the technology market. As per the analysis, sales of power electronics hold a current valuation of US$ 30.70 billion in 2024.

Reflecting on consumers’ expectations, power electronics manufacturers work on simpler labels with understandable ingredients, reinforcing continuous demand. Going by this pattern, demand could rise and equate to a market valuation of US$ 51.30 billion, with a sluggish CAGR of 5.3% by 2034.

Attributes Details
Market Value for 2024 US$ 30.7 billion
Market Value for 2034 US$ 51.3 billion
Market Forecast CAGR for 2024 to 2034 5.3%

Don't pay for what you don't need

Customize your report by selecting specific countries or regions and save 30%!

Historical Performance and Future Growth of the Power Electronics Market

In 2019, the global power electronics market showed a potential worth US$ 26.24 billion, according to a report from Future Market Insights (FMI). The power electronics market witnessed significant growth, registering a CAGR of 3.10% from 2019 to 2023.

Historical CAGR 3.10%
Forecast CAGR 5.3%

Preference in technology, particularly in semiconductor devices and power management systems, contributed to the expansion of the market. The boom in demand for energy-efficient solutions and the need for power optimization further augmented the uptake of power electronics worldwide.

The market performance during this period underscored its importance by enabling efficient power conversion, control, and management across diverse applications.

The power electronics market is forecasted to experience accelerated growth, with a projected CAGR of 3.1% from 2019 to 2023. Several factors are expected to drive this growth, including improvement in industries requiring power electronics solutions, such as electric vehicles, renewable energy systems, and smart grids.

The boost on energy conservation, electrification, and the transition towards sustainable energy sources fuel the global adoption of power electronics solutions.

Beacons to Guide the Power Electronics Market Forward

  • Continuous innovations in power semiconductor devices, such as silicon carbide (SiC) and gallium nitride (GaN), guide the power electronics market forward.
  • The boom in advancements enables higher efficiency, compact designs, and improved performance, propelling the adoption of power electronics across various industries, including automotive, renewable energy, and consumer electronics.
  • The push in demand for energy-efficient solutions in applications like electric vehicles, renewable energy systems, and smart grids is a beacon propelling the power electronics market.
  • Power electronics play an important role in optimizing power conversion and management, reducing energy consumption, and minimizing environmental impact, aligning with global efforts toward sustainability.
Sudip Saha
Sudip Saha

Principal Consultant

Talk to Analyst

Find your sweet spots for generating winning opportunities in this market.

Key Factors Hampering the Power Electronics Market

  • High initial investment and manufacturing costs associated with advanced power semiconductor materials, packaging technologies, and production processes hinder the widespread adoption of power electronics.
  • The cost sensitivity of end-users, especially in price-sensitive markets, poses a challenge to market penetration and limits the scalability of power electronics solutions.
  • Thermal management issues, such as heat dissipation and temperature control, present significant challenges in power electronics applications.
  • As power densities boom and devices operate under higher voltages and currents, managing thermal dissipation becomes difficult to ensure device reliability and performance.
  • Inadequate thermal management solutions lead to device failures, reduced lifespan, and higher maintenance costs, hampering market growth and adoption.

Comparative View of the Adjacent Markets

This section compares the power electronics industry, the silicon carbide market, and the power amplifier modules market.

Silicon carbide (SiC) offers superior electrical properties in substitution to traditional silicon-based semiconductors, which is inclusive of higher breakdown voltage, lower switching losses, and higher thermal conductivity.

5G technology requires advanced power amplifier modules capable of delivering high-speed data transmission and coverage in dense urban areas.

Power Electronics Market:

Attributes Power Electronics Market
CAGR from 2024 to 2034 5.3%
Opportunity A rightward shift towards electric vehicles (EVs) and hybrid vehicles presents a significant growth opportunity for manufacturers.
Key Trends The boom in the adoption of wide bandgap semiconductors, such as silicon carbide (SiC) and gallium nitride (GaN), is a major key trend.

Silicon Carbide Market:

Attributes Silicon Carbide Market
CAGR from 2022 to 2032 7.5%
Opportunity An improvement in renewable energy applications.
Key Trends A trend towards miniaturization and integration of power electronic systems pushes the market.

Power Amplifier Modules Market:

Attributes Power Amplifier Modules Market
CAGR from 2023 to 2033 7.4%
Opportunity The rollout of 5G technology requires advanced power amplifier modules proficient of delivering high-speed data transmission and coverage in dense urban areas.
Key Trends Adopting advanced packaging technologies is a key trend shaping the power amplifier modules market.

Category-wise Insights

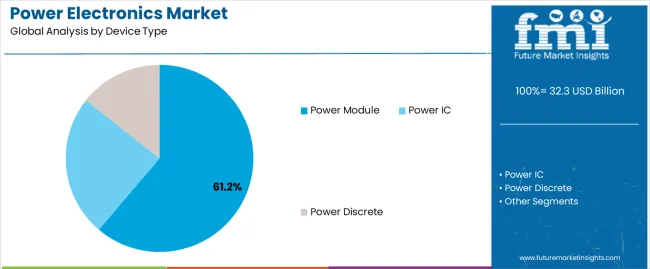
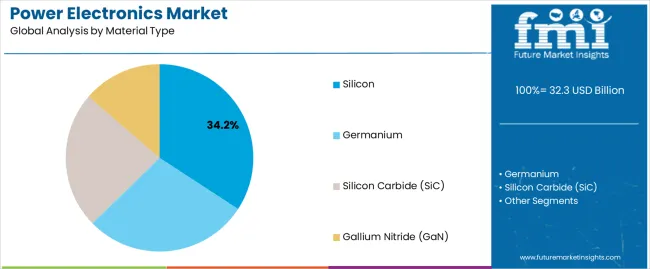
The below section shows the leading segment. Based on the device type, the module segment is accounted to hold a market share of 61.2% in 2024. Based on material, the silicon carbide segment is accounted to hold a market share of 34.2% in 2024.

Modules integrate various components into a single package, including power semiconductors, gate drivers, and protection features.

Silicon carbide (SiC) offers superior electrical properties to traditional silicon-based semiconductors, including higher breakdown voltage, lower switching losses, and higher thermal conductivity.

Category Market Share in 2024
Module 61.2%
Silicon Carbide 34.2%

Module Segment to Hold a Significant Share in the Market

Based on the device type, the module segment stands out, capturing a significant market share of 61.2%.

With the increasing complexity of power electronic systems and the demand for compact and reliable solutions, modules provide an integrated approach that simplifies design, reduces development time, and improves system performance.

Modules integrate multiple components, such as power semiconductors, gate drivers, and protection circuitry, into a single package, offering convenience and efficiency for power electronic system designers.

Silicon Carbide Segment to Hold a Dominant Share in the Market

Based on material, the silicon carbide segment is accounted to hold a market share of 34.2% in 2024.

Silicon carbide (SiC) offers superior electrical properties compared to traditional silicon-based semiconductors where such advantages make SiC an attractive choice for high-performance power electronic applications, such as electric vehicles, renewable energy systems, and industrial automation.

The boom in demand for energy-efficient and high-power-density solutions further propels the adoption of SiC-based power devices. Industries strive to improve efficiency, reduce emissions, and meet stringent performance requirements.

The silicon carbide segment continues to extend its presence in the market, offering advanced semiconductor solutions for the next generation of power electronics.

Country-wise Insights

The table describes the top five countries ranked by revenue, with Australia holding the top position.

The rapid adoption of renewable energy solutions and the robust mining sector boost the market in Australia. With significant investments in solar, wind, and battery storage projects and advanced power electronics in mining operations, Australia showcases leadership in energy efficiency and sustainability-driven applications.

Forecast CAGRs from 2024 to 2034

Countries CAGR through 2034
United States 4.1%
Germany 2.7%
Japan 2%
China 5.8%
Australia 8.8%

Technological Innovation and Industrial Automation Improves the United States Market

The United States market strongly emphasizes technological innovation and industrial automation. Power electronics are vital in various sectors, such as automotive, aerospace, and renewable energy.

The United States is a leader in electric vehicle adoption, requiring advanced power electronics for vehicle propulsion systems and charging infrastructure. The country mainly focuses on renewable energy sources like solar and wind power that boost demand for power electronics solutions for grid integration and energy storage systems.

Manufacturing Sector Dominates the Economic Growth in Germany

Germany is renowned for its engineering prowess and high-tech industries. Power electronics are integral to automotive manufacturing, machinery, and industrial automation sectors in Germany.

With a strong emphasis on energy efficiency and sustainability, the industries in Germany rely on advanced power electronics for optimizing energy consumption and improving process efficiency.

Japan Sees a Boom in the Power Electronics Market

Japan is known for its advanced technology and innovation-driven economy. Power electronics are important for the automotive industry, particularly in hybrid and electric vehicles in Japan.

Power electronics find extensive applications in consumer electronics, industrial automation, and renewable energy systems, reflecting a commitment to technological advancement and energy sustainability.

Clean Energy and Electrified Composition Boosts the Market in China

China has one of the largest electric vehicles, renewable energy installations, and consumer electronics markets. Power electronics in China is pivotal in transitioning towards clean energy and electrified transportation.

Government initiatives promoting energy conservation and technological innovation, are taken where China presents significant opportunities for power electronics manufacturers catering to diverse applications and industries.

Australia Holds a Prominent Position in the Market

Australia has abundant solar and wind resources, leading to significant investments in renewable energy projects. Power electronics enable efficient energy conversion, grid integration, and energy storage solutions in the renewable energy sector.

The mining industry relies on power electronics for equipment automation, energy management, and operational efficiency improvements, contributing to the dominance of the market in the country.
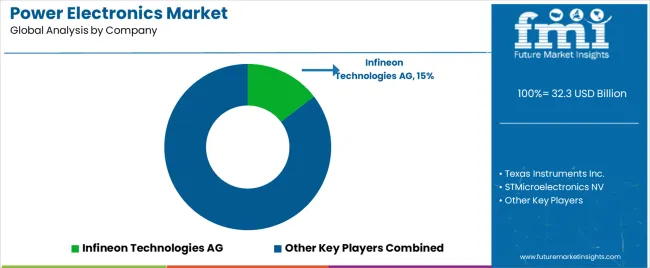
Competitive Landscape

The competitive landscape of the power electronics market is dynamic, featuring a mix of established players and emerging companies. Niche players widely focus on specific segments, like power modules or wide bandgap semiconductors, contributing to the competitive intensity.

Technological innovation, product differentiation, and strategic partnerships are vital for maintaining market share in this highly competitive environment. Factors such as quality, reliability, and cost-effectiveness play crucial roles in determining the competitive positioning of companies within the power electronics market.

Some of the key developments are

  • In May 2023, Vishay Intertechnology, Inc. unveiled 17 new third-generation 650V silicon carbide Schottky diodes (SiC). These devices from Vishay Semiconductors feature a merged pin Schottky (MPS) design, combining high surge current capability with low forward voltage drop, capacitive charging, and reverse leakage current.
  • In May 2023, Toshiba Electronics Europe introduced the TPH9R00CQ5, a new 150V N-channel power MOSFET. Based on Toshiba's latest generation U-MOS X-H Trench process, this MOSFET is tailored for high-performance switching power supplies, including communication base stations and industrial applications.

Key Coverage in the Power Electronics Industry Report

  • Adjacent Study on Power Electronics Market
  • Australia Power Electronics Market
  • Power Electronics Market Size, Current Insights, and Demographic Trends
  • Global Power Electronics Sales Market
  • Key Opportunities of the Global Power Electronics Market

Report Scope

Attributes Details
Estimated Market Size in 2024 US$ 30.70 billion
Projected Market Valuation in 2034 US$ 51.3 billion
Value-based CAGR 2024 to 2034 5.3%
Forecast Period 2024 to 2034
Historical Data Available for 2019 to 2023
Market Analysis Value in US$ billion
Key Regions Covered
  • North America
  • Latin America
  • Western Europe
  • Eastern Europe
  • South Asia and Pacific
  • East Asia
  • Middle East and Africa
Key Market Segments Covered
  • Device Type
  • Material Type
  • Application
  • Region
Key Countries Profiled
  • The United States
  • Canada
  • Brazil
  • Mexico
  • Germany
  • The United Kingdom
  • France
  • Spain
  • Italy
  • Russia
  • Poland
  • Czech Republic
  • Romania
  • Rest of Eastern Europe
  • India
  • Bangladesh
  • Australia
  • New Zealand
  • China
  • Japan
  • South Korea
  • GCC countries
  • South Africa
  • Israel
Key Companies Profiled
  • Qualcomm
  • ABB Ltd.
  • Infineon Technologies AG
  • Texas Instruments Inc.
  • ROHM Co. Ltd
  • STMicroelectronics NV
  • Renesas Electronics Corporation
  • Vishay Intertechnologies Inc.
  • Toshiba Corporation
  • Mitsubishi Electric Corporation

Key Segments

By Device Type:

  • Power Discrete
  • Power Module
  • Power IC

By Material Type:

  • Silicon
  • Germanium
  • Silicon Carbide (SiC)
  • Gallium Nitride (GaN)

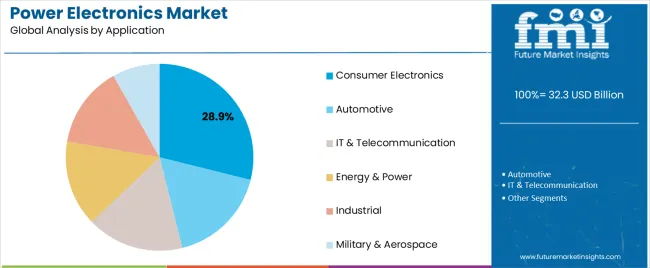
By Application:

  • Consumer Electronics
  • Automotive
  • IT & Telecommunication
  • Energy & Power
  • Industrial
  • Military & Aerospace

By Region:

  • North America
  • Latin America
  • Western Europe
  • Eastern Europe
  • South Asia and Pacific
  • East Asia
  • Middle East and Africa

Frequently Asked Questions

What is the expected worth of the power electronics market in 2024?

As of 2024, the market for power electronics is expected to be valued at US$ 30.7 billion.

What is the market potential for power electronics?

The power electronics market is projected to expand at a CAGR of 5.3% between 2024 and 2034.

Which device type segment dominates the power electronics market?

The module segment is projected to dominate the industry.

What is the anticipated market value for power electronics in 2034?

By 2034, the market value of power electronics is expected to reach US$ 51.3 billion.

Which country is likely to dominate the power electronics market?

Australia is likely the top-performing market, with a CAGR of 8.8%.

Table of Content
1. Executive Summary

    1.1. Global Market Outlook

    1.2. Demand-side Trends

    1.3. Supply-side Trends

    1.4. Technology Roadmap Analysis

    1.5. Analysis and Recommendations

2. Market Overview

    2.1. Market Coverage / Taxonomy

    2.2. Market Definition / Scope / Limitations

3. Market Background

    3.1. Market Dynamics

        3.1.1. Drivers

        3.1.2. Restraints

        3.1.3. Opportunity

        3.1.4. Trends

    3.2. Scenario Forecast

        3.2.1. Demand in Optimistic Scenario

        3.2.2. Demand in Likely Scenario

        3.2.3. Demand in Conservative Scenario

    3.3. Opportunity Map Analysis

    3.4. Product Life Cycle Analysis

    3.5. Supply Chain Analysis

        3.5.1. Supply Side Participants and their Roles

            3.5.1.1. Manufacturer

        3.5.2. Value Added and Value Created at Node in the Supply Chain

        3.5.3. List of Raw Material Suppliers

        3.5.4. List of Existing and Potential Buyer’s

    3.6. Investment Feasibility Matrix

    3.7. Value Chain Analysis

        3.7.1. Profit Margin Analysis

    3.8. PESTLE and Porter’s Analysis

    3.9. Regulatory Landscape

        3.9.1. By Key Regions

        3.9.2. By Key Countries

    3.10. Regional Parent Market Outlook

    3.11. Production and Consumption Statistics

    3.12. Import and Export Statistics

4. Global Market Analysis 2019 to 2023 and Forecast, 2024 to 2034

    4.1. Historical Market Size Value (US$ Million) & Volume (Units) Analysis, 2019 to 2023

    4.2. Current and Future Market Size Value (US$ Million) & Volume (Units) Projections, 2024 to 2034

        4.2.1. Y-o-Y Growth Trend Analysis

        4.2.2. Absolute $ Opportunity Analysis

5. Global Market Analysis 2019 to 2023 and Forecast 2024 to 2034, By Device Type

    5.1. Introduction / Key Findings

    5.2. Historical Market Size Value (US$ Million) & Volume (Units) Analysis By Device Type, 2019 to 2023

    5.3. Current and Future Market Size Value (US$ Million) & Volume (Units) Analysis and Forecast By Device Type, 2024 to 2034

        5.3.1. Power Discrete

        5.3.2. Power Module

        5.3.3. Power IC

    5.4. Y-o-Y Growth Trend Analysis By Device Type, 2019 to 2023

    5.5. Absolute $ Opportunity Analysis By Device Type, 2024 to 2034

6. Global Market Analysis 2019 to 2023 and Forecast 2024 to 2034, By Material

    6.1. Introduction / Key Findings

    6.2. Historical Market Size Value (US$ Million) & Volume (Units) Analysis By Material, 2019 to 2023

    6.3. Current and Future Market Size Value (US$ Million) & Volume (Units) Analysis and Forecast By Material, 2024 to 2034

        6.3.1. Silicon

        6.3.2. Germanium

        6.3.3. Silicon Carbide (SiC)

        6.3.4. Gallium Nitride (GaN)

    6.4. Y-o-Y Growth Trend Analysis By Material, 2019 to 2023

    6.5. Absolute $ Opportunity Analysis By Material, 2024 to 2034

7. Global Market Analysis 2019 to 2023 and Forecast 2024 to 2034, By Application

    7.1. Introduction / Key Findings

    7.2. Historical Market Size Value (US$ Million) & Volume (Units) Analysis By Application, 2019 to 2023

    7.3. Current and Future Market Size Value (US$ Million) & Volume (Units) Analysis and Forecast By Application, 2024 to 2034

        7.3.1. Consumer Electronics

        7.3.2. Automotive

        7.3.3. IT & Telecommunication

        7.3.4. Energy & Power

        7.3.5. Industrial

        7.3.6. Military & Aerospace

    7.4. Y-o-Y Growth Trend Analysis By Application, 2019 to 2023

    7.5. Absolute $ Opportunity Analysis By Application, 2024 to 2034

8. Global Market Analysis 2019 to 2023 and Forecast 2024 to 2034, By Region

    8.1. Introduction

    8.2. Historical Market Size Value (US$ Million) & Volume (Units) Analysis By Region, 2019 to 2023

    8.3. Current Market Size Value (US$ Million) & Volume (Units) Analysis and Forecast By Region, 2024 to 2034

        8.3.1. North America

        8.3.2. Latin America

        8.3.3. Western Europe

        8.3.4. Eastern Europe

        8.3.5. South Asia and Pacific

        8.3.6. East Asia

        8.3.7. Middle East and Africa

    8.4. Market Attractiveness Analysis By Region

9. North America Market Analysis 2019 to 2023 and Forecast 2024 to 2034, By Country

    9.1. Historical Market Size Value (US$ Million) & Volume (Units) Trend Analysis By Market Taxonomy, 2019 to 2023

    9.2. Market Size Value (US$ Million) & Volume (Units) Forecast By Market Taxonomy, 2024 to 2034

        9.2.1. By Country

            9.2.1.1. USA

            9.2.1.2. Canada

        9.2.2. By Device Type

        9.2.3. By Material

        9.2.4. By Application

    9.3. Market Attractiveness Analysis

        9.3.1. By Country

        9.3.2. By Device Type

        9.3.3. By Material

        9.3.4. By Application

    9.4. Key Takeaways

10. Latin America Market Analysis 2019 to 2023 and Forecast 2024 to 2034, By Country

    10.1. Historical Market Size Value (US$ Million) & Volume (Units) Trend Analysis By Market Taxonomy, 2019 to 2023

    10.2. Market Size Value (US$ Million) & Volume (Units) Forecast By Market Taxonomy, 2024 to 2034

        10.2.1. By Country

            10.2.1.1. Brazil

            10.2.1.2. Mexico

            10.2.1.3. Rest of Latin America

        10.2.2. By Device Type

        10.2.3. By Material

        10.2.4. By Application

    10.3. Market Attractiveness Analysis

        10.3.1. By Country

        10.3.2. By Device Type

        10.3.3. By Material

        10.3.4. By Application

    10.4. Key Takeaways

11. Western Europe Market Analysis 2019 to 2023 and Forecast 2024 to 2034, By Country

    11.1. Historical Market Size Value (US$ Million) & Volume (Units) Trend Analysis By Market Taxonomy, 2019 to 2023

    11.2. Market Size Value (US$ Million) & Volume (Units) Forecast By Market Taxonomy, 2024 to 2034

        11.2.1. By Country

            11.2.1.1. Germany

            11.2.1.2. UK

            11.2.1.3. France

            11.2.1.4. Spain

            11.2.1.5. Italy

            11.2.1.6. Rest of Western Europe

        11.2.2. By Device Type

        11.2.3. By Material

        11.2.4. By Application

    11.3. Market Attractiveness Analysis

        11.3.1. By Country

        11.3.2. By Device Type

        11.3.3. By Material

        11.3.4. By Application

    11.4. Key Takeaways

12. Eastern Europe Market Analysis 2019 to 2023 and Forecast 2024 to 2034, By Country

    12.1. Historical Market Size Value (US$ Million) & Volume (Units) Trend Analysis By Market Taxonomy, 2019 to 2023

    12.2. Market Size Value (US$ Million) & Volume (Units) Forecast By Market Taxonomy, 2024 to 2034

        12.2.1. By Country

            12.2.1.1. Poland

            12.2.1.2. Russia

            12.2.1.3. Czech Republic

            12.2.1.4. Romania

            12.2.1.5. Rest of Eastern Europe

        12.2.2. By Device Type

        12.2.3. By Material

        12.2.4. By Application

    12.3. Market Attractiveness Analysis

        12.3.1. By Country

        12.3.2. By Device Type

        12.3.3. By Material

        12.3.4. By Application

    12.4. Key Takeaways

13. South Asia and Pacific Market Analysis 2019 to 2023 and Forecast 2024 to 2034, By Country

    13.1. Historical Market Size Value (US$ Million) & Volume (Units) Trend Analysis By Market Taxonomy, 2019 to 2023

    13.2. Market Size Value (US$ Million) & Volume (Units) Forecast By Market Taxonomy, 2024 to 2034

        13.2.1. By Country

            13.2.1.1. India

            13.2.1.2. Bangladesh

            13.2.1.3. Australia

            13.2.1.4. New Zealand

            13.2.1.5. Rest of South Asia and Pacific

        13.2.2. By Device Type

        13.2.3. By Material

        13.2.4. By Application

    13.3. Market Attractiveness Analysis

        13.3.1. By Country

        13.3.2. By Device Type

        13.3.3. By Material

        13.3.4. By Application

    13.4. Key Takeaways

14. East Asia Market Analysis 2019 to 2023 and Forecast 2024 to 2034, By Country

    14.1. Historical Market Size Value (US$ Million) & Volume (Units) Trend Analysis By Market Taxonomy, 2019 to 2023

    14.2. Market Size Value (US$ Million) & Volume (Units) Forecast By Market Taxonomy, 2024 to 2034

        14.2.1. By Country

            14.2.1.1. China

            14.2.1.2. Japan

            14.2.1.3. South Korea

        14.2.2. By Device Type

        14.2.3. By Material

        14.2.4. By Application

    14.3. Market Attractiveness Analysis

        14.3.1. By Country

        14.3.2. By Device Type

        14.3.3. By Material

        14.3.4. By Application

    14.4. Key Takeaways

15. Middle East and Africa Market Analysis 2019 to 2023 and Forecast 2024 to 2034, By Country

    15.1. Historical Market Size Value (US$ Million) & Volume (Units) Trend Analysis By Market Taxonomy, 2019 to 2023

    15.2. Market Size Value (US$ Million) & Volume (Units) Forecast By Market Taxonomy, 2024 to 2034

        15.2.1. By Country

            15.2.1.1. GCC Countries

            15.2.1.2. South Africa

            15.2.1.3. Israel

            15.2.1.4. Rest of MEA

        15.2.2. By Device Type

        15.2.3. By Material

        15.2.4. By Application

    15.3. Market Attractiveness Analysis

        15.3.1. By Country

        15.3.2. By Device Type

        15.3.3. By Material

        15.3.4. By Application

    15.4. Key Takeaways

16. Key Countries Market Analysis

    16.1. USA

        16.1.1. Pricing Analysis

        16.1.2. Market Share Analysis, 2023

            16.1.2.1. By Device Type

            16.1.2.2. By Material

            16.1.2.3. By Application

    16.2. Canada

        16.2.1. Pricing Analysis

        16.2.2. Market Share Analysis, 2023

            16.2.2.1. By Device Type

            16.2.2.2. By Material

            16.2.2.3. By Application

    16.3. Brazil

        16.3.1. Pricing Analysis

        16.3.2. Market Share Analysis, 2023

            16.3.2.1. By Device Type

            16.3.2.2. By Material

            16.3.2.3. By Application

    16.4. Mexico

        16.4.1. Pricing Analysis

        16.4.2. Market Share Analysis, 2023

            16.4.2.1. By Device Type

            16.4.2.2. By Material

            16.4.2.3. By Application

    16.5. Germany

        16.5.1. Pricing Analysis

        16.5.2. Market Share Analysis, 2023

            16.5.2.1. By Device Type

            16.5.2.2. By Material

            16.5.2.3. By Application

    16.6. UK

        16.6.1. Pricing Analysis

        16.6.2. Market Share Analysis, 2023

            16.6.2.1. By Device Type

            16.6.2.2. By Material

            16.6.2.3. By Application

    16.7. France

        16.7.1. Pricing Analysis

        16.7.2. Market Share Analysis, 2023

            16.7.2.1. By Device Type

            16.7.2.2. By Material

            16.7.2.3. By Application

    16.8. Spain

        16.8.1. Pricing Analysis

        16.8.2. Market Share Analysis, 2023

            16.8.2.1. By Device Type

            16.8.2.2. By Material

            16.8.2.3. By Application

    16.9. Italy

        16.9.1. Pricing Analysis

        16.9.2. Market Share Analysis, 2023

            16.9.2.1. By Device Type

            16.9.2.2. By Material

            16.9.2.3. By Application

    16.10. Poland

        16.10.1. Pricing Analysis

        16.10.2. Market Share Analysis, 2023

            16.10.2.1. By Device Type

            16.10.2.2. By Material

            16.10.2.3. By Application

    16.11. Russia

        16.11.1. Pricing Analysis

        16.11.2. Market Share Analysis, 2023

            16.11.2.1. By Device Type

            16.11.2.2. By Material

            16.11.2.3. By Application

    16.12. Czech Republic

        16.12.1. Pricing Analysis

        16.12.2. Market Share Analysis, 2023

            16.12.2.1. By Device Type

            16.12.2.2. By Material

            16.12.2.3. By Application

    16.13. Romania

        16.13.1. Pricing Analysis

        16.13.2. Market Share Analysis, 2023

            16.13.2.1. By Device Type

            16.13.2.2. By Material

            16.13.2.3. By Application

    16.14. India

        16.14.1. Pricing Analysis

        16.14.2. Market Share Analysis, 2023

            16.14.2.1. By Device Type

            16.14.2.2. By Material

            16.14.2.3. By Application

    16.15. Bangladesh

        16.15.1. Pricing Analysis

        16.15.2. Market Share Analysis, 2023

            16.15.2.1. By Device Type

            16.15.2.2. By Material

            16.15.2.3. By Application

    16.16. Australia

        16.16.1. Pricing Analysis

        16.16.2. Market Share Analysis, 2023

            16.16.2.1. By Device Type

            16.16.2.2. By Material

            16.16.2.3. By Application

    16.17. New Zealand

        16.17.1. Pricing Analysis

        16.17.2. Market Share Analysis, 2023

            16.17.2.1. By Device Type

            16.17.2.2. By Material

            16.17.2.3. By Application

    16.18. China

        16.18.1. Pricing Analysis

        16.18.2. Market Share Analysis, 2023

            16.18.2.1. By Device Type

            16.18.2.2. By Material

            16.18.2.3. By Application

    16.19. Japan

        16.19.1. Pricing Analysis

        16.19.2. Market Share Analysis, 2023

            16.19.2.1. By Device Type

            16.19.2.2. By Material

            16.19.2.3. By Application

    16.20. South Korea

        16.20.1. Pricing Analysis

        16.20.2. Market Share Analysis, 2023

            16.20.2.1. By Device Type

            16.20.2.2. By Material

            16.20.2.3. By Application

    16.21. GCC Countries

        16.21.1. Pricing Analysis

        16.21.2. Market Share Analysis, 2023

            16.21.2.1. By Device Type

            16.21.2.2. By Material

            16.21.2.3. By Application

    16.22. South Africa

        16.22.1. Pricing Analysis

        16.22.2. Market Share Analysis, 2023

            16.22.2.1. By Device Type

            16.22.2.2. By Material

            16.22.2.3. By Application

    16.23. Israel

        16.23.1. Pricing Analysis

        16.23.2. Market Share Analysis, 2023

            16.23.2.1. By Device Type

            16.23.2.2. By Material

            16.23.2.3. By Application

17. Market Structure Analysis

    17.1. Competition Dashboard

    17.2. Competition Benchmarking

    17.3. Market Share Analysis of Top Players

        17.3.1. By Regional

        17.3.2. By Device Type

        17.3.3. By Material

        17.3.4. By Application

18. Competition Analysis

    18.1. Competition Deep Dive

        18.1.1. Qualcomm

            18.1.1.1. Overview

            18.1.1.2. Product Portfolio

            18.1.1.3. Profitability by Market Segments

            18.1.1.4. Sales Footprint

            18.1.1.5. Strategy Overview

                18.1.1.5.1. Marketing Strategy

                18.1.1.5.2. Product Strategy

                18.1.1.5.3. Channel Strategy

        18.1.2. ABB Ltd.

            18.1.2.1. Overview

            18.1.2.2. Product Portfolio

            18.1.2.3. Profitability by Market Segments

            18.1.2.4. Sales Footprint

            18.1.2.5. Strategy Overview

                18.1.2.5.1. Marketing Strategy

                18.1.2.5.2. Product Strategy

                18.1.2.5.3. Channel Strategy

        18.1.3. Infineon Technologies AG

            18.1.3.1. Overview

            18.1.3.2. Product Portfolio

            18.1.3.3. Profitability by Market Segments

            18.1.3.4. Sales Footprint

            18.1.3.5. Strategy Overview

                18.1.3.5.1. Marketing Strategy

                18.1.3.5.2. Product Strategy

                18.1.3.5.3. Channel Strategy

        18.1.4. Texas Instruments Inc.

            18.1.4.1. Overview

            18.1.4.2. Product Portfolio

            18.1.4.3. Profitability by Market Segments

            18.1.4.4. Sales Footprint

            18.1.4.5. Strategy Overview

                18.1.4.5.1. Marketing Strategy

                18.1.4.5.2. Product Strategy

                18.1.4.5.3. Channel Strategy

        18.1.5. ROHM Co. Ltd

            18.1.5.1. Overview

            18.1.5.2. Product Portfolio

            18.1.5.3. Profitability by Market Segments

            18.1.5.4. Sales Footprint

            18.1.5.5. Strategy Overview

                18.1.5.5.1. Marketing Strategy

                18.1.5.5.2. Product Strategy

                18.1.5.5.3. Channel Strategy

        18.1.6. STMicroelectronics NV

            18.1.6.1. Overview

            18.1.6.2. Product Portfolio

            18.1.6.3. Profitability by Market Segments

            18.1.6.4. Sales Footprint

            18.1.6.5. Strategy Overview

                18.1.6.5.1. Marketing Strategy

                18.1.6.5.2. Product Strategy

                18.1.6.5.3. Channel Strategy

        18.1.7. Renesas Electronics Corporation

            18.1.7.1. Overview

            18.1.7.2. Product Portfolio

            18.1.7.3. Profitability by Market Segments

            18.1.7.4. Sales Footprint

            18.1.7.5. Strategy Overview

                18.1.7.5.1. Marketing Strategy

                18.1.7.5.2. Product Strategy

                18.1.7.5.3. Channel Strategy

        18.1.8. Vishay Intertechnologies Inc.

            18.1.8.1. Overview

            18.1.8.2. Product Portfolio

            18.1.8.3. Profitability by Market Segments

            18.1.8.4. Sales Footprint

            18.1.8.5. Strategy Overview

                18.1.8.5.1. Marketing Strategy

                18.1.8.5.2. Product Strategy

                18.1.8.5.3. Channel Strategy

        18.1.9. Toshiba Corporation

            18.1.9.1. Overview

            18.1.9.2. Product Portfolio

            18.1.9.3. Profitability by Market Segments

            18.1.9.4. Sales Footprint

            18.1.9.5. Strategy Overview

                18.1.9.5.1. Marketing Strategy

                18.1.9.5.2. Product Strategy

                18.1.9.5.3. Channel Strategy

        18.1.10. Mitsubishi Electric Corporation

            18.1.10.1. Overview

            18.1.10.2. Product Portfolio

            18.1.10.3. Profitability by Market Segments

            18.1.10.4. Sales Footprint

            18.1.10.5. Strategy Overview

                18.1.10.5.1. Marketing Strategy

                18.1.10.5.2. Product Strategy

                18.1.10.5.3. Channel Strategy

19. Assumptions & Acronyms Used

20. Research Methodology
Recommendations

Industrial Automation

Power Device Analyzer Market

February 2022

REP-GB-14273

May 2023

324 pages

Industrial Automation

Power Quality Equipment Market

December 2022

REP-GB-16004

322 pages

Technology

Silicon Carbide Market

August 2017

REP-GB-4721

July 2022

308 pages

Explore Technology Insights

View Reports