This site uses cookies, including third-party cookies, that help us to provide and improve our services.

Privacy Policy
- Global Locations -
Headquarters
Future Market Insights, Inc.
Christiana Corporate, 200 Continental Drive, Suite 401, Newark, Delaware - 19713, United States
T: +1-845-579-5705
MEA
Market Access DMCC

1602-6 Jumeirah Bay X2 Tower, Plot No: JLT-PH2-X2A,

Jumeirah Lakes Towers, Dubai,

United Arab Emirates

Americas
Future Market Insights
616 Corporate Way, Suite 2-9018,
Valley Cottage, NY 10989,
United States
T: +1-347-918-3531
Europe
Future Market Insights
3rd Floor, 207 Regent Street,
London W1B 3HH
United Kingdom
T: + 44 (0) 20 8123 9659
D: +44 (0) 20 3287 4268
APAC
Future Market Insights
Office No. 401-A, 4th Floor,
VANTAGE 9, S.No. 36/1/1,
Baner, Pune 411045 India

Power Tools Market

Substantial Growth in the Commercial and Residential Construction Sector is expected to continue boosting the market

Power Tools Market by Product Type, Technology, Application, Sales Channel End User & Region | Forecast 2022 to 2032

Power Tools Market Outlook (2022 to 2032)

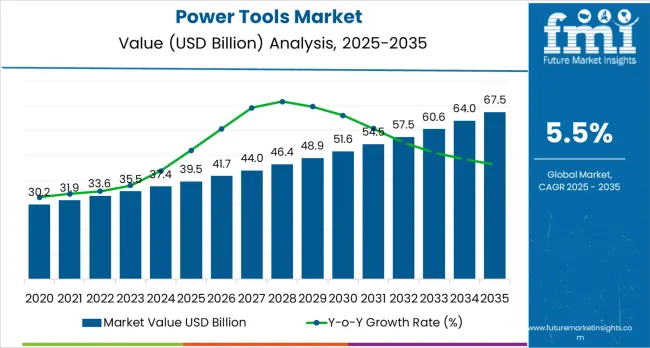
The global power tools market is expected to reach US$ 33.36 Billion in 2022. As per the latest Future Market Insights (FMI) analysis, demand for electric power tools and portable power tools will rise exponentially in the coming years.

Soaring applications in automotive, construction, aerospace, and other industries also will create demand for handheld and pneumatic power tools. The report also predicts power tools sales to constitute nearly 7% to 8% of the global tooling industry.

Attribute

Details

Power Tools Market Estimated Size 2022

US$ 33.36 Billion

Power Tools Market Value-Based CAGR (2022 to 2032)

5.1%

Power Tools Market Value 2032

US$ 51.2 Billion

Don't pay for what you don't need

Customize your report by selecting specific countries or regions and save 30%!

Power Tools Demand Analysis (2016 to 2021) Vs Market Outlook (2022 to 2032)

The global Power Tools market is expected to grow at a 3.7% CAGR between 2022 and 2032, in comparison to a 7.3% CAGR registered from 2016 to 2021.

Scope for application is expected to rise across diverse industries as manufacturers offer intelligent solutions for corded and non-corded power tools. As per FMI, rapid expansion in end-use industries including aerospace, automotive, furniture, and others is positively fuelling the demand for power tools. With features such as electric motors, power tool applications have been surging to eliminate strenuous manual labor across industries.

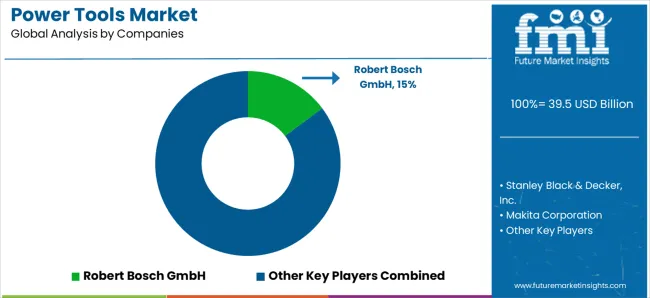
Leading power tool manufacturers are focusing on developing technologically advanced products with higher efficiency and improved performance, especially for the cordless power tools market. This is projected to give tailwinds to the power tools market growth through 2032. For instance, power tools market players such as Robert Bosch, Stanley Black & Decker, and others are developing cordless power tools in-built with Li-ion batteries to offer enhanced performance. These advancements have been crucial in fuelling demand for power tools globally.

Backed by the aforementioned factors, sales are projected to increase at a healthy 5.1% CAGR over the assessment period. The overall demand for Power Tools is projected to grow at a CAGR of 5.1% between 2022 and 2032, totaling around US$ 51.2 Million by 2032.

Which Drivers Underpin Power Tools Industry Expansion?

Commercial Potential of Power Tools Propelling the Sales

The portability and easy maneuverability of power tools have been fuelling their demand at a higher rate than conventional hand tools. Demand from manufacturing assembly units, fabrication as well as service sectors are expected to fuel the demand for power tools. The construction sector is expected to be a crucial end-user aiding the market growth.

Spurred by these factors, commercial opportunities are likely to soar for power tool manufacturers. Especially with the innovation of cordless power tools leading to the launch of advanced versions of impact wrenches, circular saws, and hammer drills among others, sales prospects have improved.

Consequently, there is immense focus on launching flexible, mobile, and compact tools to keep pace with dynamic consumer preferences. Moreover, nickel-metal hydride (Ni-MH) and nickel-cadmium (Ni-Cd) power tools are increasingly being replaced with lithium-ion batteries. For instance, in 2019 Bosch launched cordless power tools, fitted with lithium-ion batteries to offer improved power and efficiency. These advances have been crucial in improving the commercial potential of power tools.

Furthermore, professionals around the world are seeking solutions to make their jobs easier and ultimately save time and resources. As a matter of fact, they are looking for a good mix of solutions to increase productivity. While their evolving needs led to advancements in wireless technologies including motors, electronics, and batteries, the demand for productivity solutions has been encouraging innovations in the power tools market.

For example, there is immense focus on going green. Market players looking to carve a niche amid rising competition, have been consciously introducing eco-friendly alternatives to popular technologies. An increasing number of power tools manufacturers are therefore ruling out fossil fuel models to offer more energy-saving power solutions.

With the world struggling with massive storms, chaotic heat waves, and wildfires, the need to move away from pollutants is more than ever before. Catering to changing consumer preferences, Santa Monica, Calif.-based start-up Graze Mowing announced a next-generation autonomous robot for lawn mowing at a commercial scale in September 2020. While the company hopes to use solar power in the near future, currently it has been working with swappable batteries that promise to save significantly on the cost incurred of fuel and electricity.

Nikhil Kaitwade
Nikhil Kaitwade
Principal Consultant
LinkedIn
Talk to Analyst

Find your sweet spots for generating winning opportunities in this market.

Talk to Analyst

Which Factors are limiting the Growth of the Power Tools Market?

Price Sensitivity in the Market to Hamper the Growth

Raw materials predominantly used in power tools are steel and aluminum. With fluctuating costs of aluminum and steel, the cost of raw materials is also bound to increase or decrease.

This will have a significant impact on the power tools market in the near term which is set to witness a marginal downturn. In order to sustain the slowdown, manufacturers will look at stabilizing the pricing of power tools through diversification and newer pricing strategies.

Country-wise Insights

How big is the Opportunity in the USA?

Substantial Growth in the Commercial and Residential Construction Sector is Fueling Growth in the USA

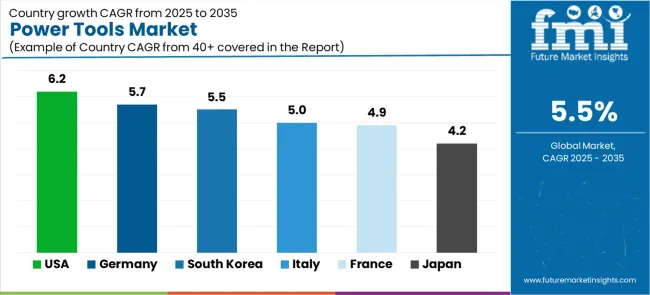
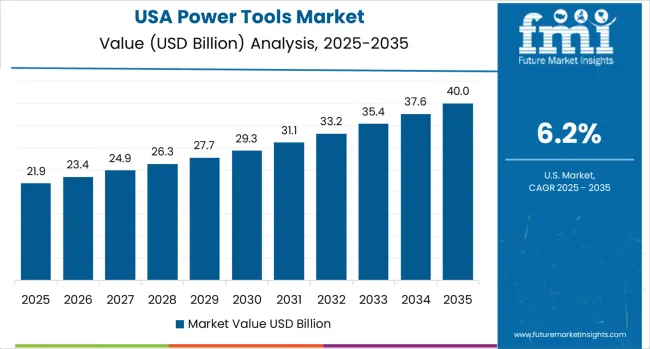
FMI has projected North America to remain one of the most lucrative markets throughout the course of the forecast period. Growth within this region is expected to be spearheaded by the USA One of the key factors supporting expansion in the country is the substantial growth in commercial and residential construction. As per the USA. Census Bureau, construction spending recorded by the country stood at US$ 1,459.4 Billion in November 2020. With both private and public spending on construction activities surging, power tool manufacturers will have lucrative prospects to capitalize on in the near future.

Besides this, prospects for growth will rise as the demand for MRO services rises within the automotive sector. Select USA has predicted automotive sales in the USA to gradually recover post-COVID-19, which will present attractive opportunities for power tool sales within the USA in the coming years.

How Lucrative Are Opportunities in the United Kingdom?

Favorable Government Support for Infrastructure Development Spurring Demand

The remarkable growth in infrastructure development and construction activities in the United Kingdom is driving power tools Market sales within the country. The refined projections for the construction industry growth in the United Kingdom have been paving the way for power tools Market sales. The gradually reviving construction sector is expected to offset a sharp decline in sales witnessed on account of COVID-19. According to the Office of National Statistics, United Kingdom, construction output has improved marginally by 1% in October 2020.

Besides this, Britain is identified as one of the leading manufacturers in the world, which places it as a lucrative market for power tools globally. Make the United Kingdom has reported annual output worth £192 billion, as manufacturing continues to drive exports and Research and Development in the country. Against this backdrop, power tools manufacturers are likely to find the country as a lucrative pocket for sales.

How Are Construction Activities Driving the German Market?

Growing Inclination towards Power Tools for Increasing Productivity Will Boost Sales

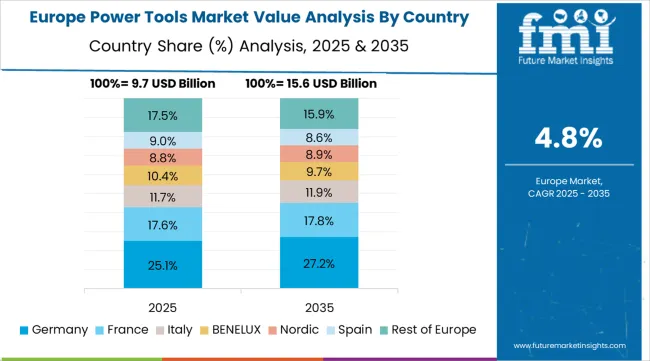
FMI has identified Germany as the leading power tools market within Europe. The growth outlook continues to be positive for the country, especially as demand is expected to soar amid improving construction activities. The upbeat performance exhibited by Germany’s construction sector will continue aiding power tools sales.

According to the Federal Statistics Office, Destatis, construction sector turnover in Germany was up by 2.2% in October 2020 in comparison to the corresponding month of the previous year. Consistently rising spending on construction will remain a chief driver, since the construction sector will continue to be one of the leading end-users of power tools.

How Will China Market Ride on Recovery Post COVID-19?

Improving Industrial Activities in the Region to Push Sales

China has been among the few nations to have been exhibiting recovery post-COVID-19 at an impressive rate. Despite encountering a temporary slowdown amid COVID-19, China’s rapid pace of economic recovery has boded well for the power tools market. According to the National Bureau of Statistics, exports and imports have significantly grown in the country from September 2020 onwards, with imports increasing by 13.2% and exports surging by 9.9% in comparison to the previous year.

The aforementioned figures are indicative of improving industrial activities, which will present attractive opportunities for power tools Market sales. Also, China’s unique response to COVID-19 to ensure an unhindered food supply amid COVID-19 has been aiding the steady growth of the power tools market. Their efforts have also been discussed by the Food and Agricultural Organization (FAO) of the United Nations.

How Is the Expanding Agricultural Sector Supporting Growth in Brazil?

Significant Advancements in the Agricultural Sector to Support the Growth

According to a USA Department of Agriculture (USDA) report, the agriculture sector in Brazil has transformed from one that includes indigenous systems of production with limited use of modern technologies to a global leader in agriculture. Macroeconomic reforms undertaken by the country have been a key enabler of the growth of Brazil's agriculture sector. The report also mentioned that the country’s value-added surged an average of 3.4% annually over the past two decades, with agricultural output nearly doubling during the time.

The rising investment in technology has been a key enabler of the expansion of the agricultural sector in Brazil, which also is indicative of lucrative opportunities for power tools sales in the region.

Get the data you need at a Fraction of the cost

Personalize your report by choosing insights you need
and save 40%!

Category-wise Insights

Which Product is highly Sought-after?

Demand for Drilling Tools Will Continue to Outclass Other Products

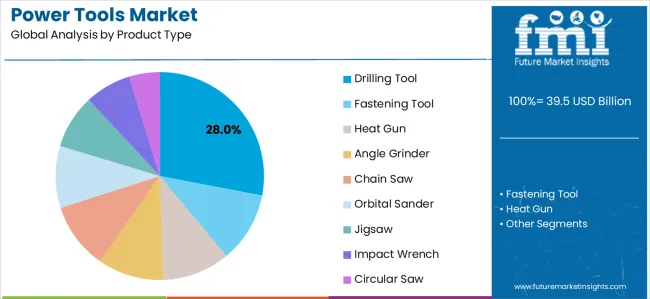
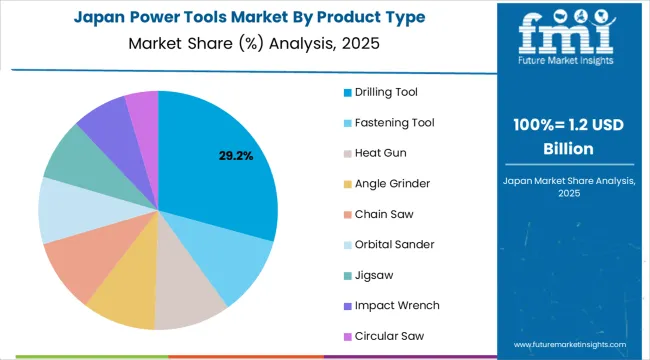
Drilling tools are highly sought-after power tools due to their increasing application across diverse industries, including construction, manufacturing, and others. In fact drilling tools also are used in various do-it-yourself projects, which has been fuelling their demand in commercial and household applications besides their increasing adoption across industries. The drilling tools segment is expected to account for over 17% of the market by the end of 2032 and is expected to remain dominant through the forecast period.

Why do Construction Applications Hold a Higher Share?

Construction Application Drives Continue to Account for the Bulk of Demand

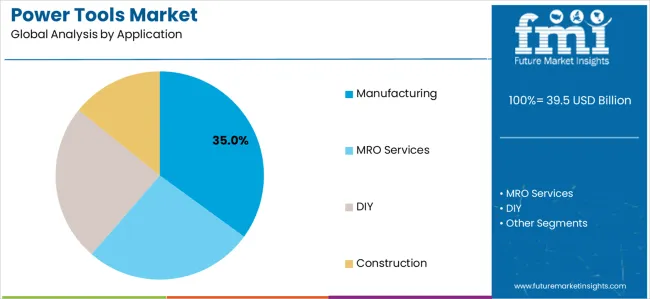
Accounting for nearly 30% of the overall share through the forecast period, construction applications drives continue to account for the bulk of demand for the power tools Market. Growth in the segment is primarily due to the rapid development of the construction industry along with the bulk deployment of power tools in construction projects. Increasing construction spending in countries such as the USA, the United Kingdom, and China will continue aiding the expansion of the market.

Increasing do-it-yourself (DIY) activities and high capita spending on DIY tools in developed countries from North America and Europe are driving the consumer inclination towards DIY activities e.g. interior home renovation, plumbing, gardening, and others. The footprint of DIY tools is also expected to expand in developing regions. The use of DIY products lowers long-term costs than work outsourced to hired labor resulting in increased demand for power tools for DIY and household applications. Additionally, the advent of e-commerce has enabled easy access and discounts for consumers. These factors are expected to ascend the demand for power tools in DIY applications.

Why is Electric Technology More in Demand?

Increasing Investments for the Launch of Advanced Technologies Driving Growth

Electric and pneumatic are currently the leading technologies available, of and the demand for the former has been surging at a higher pace. The advent of cordless technology is expected to fuel growth opportunities within the market. Some of the leading players such as Bosch, Milwaukee, Hitachi, and others include cordless power tools in their portfolios.

Also driven by surging demand, they are increasingly investing in the launch of advanced technologies, which will ultimately fuel demand within the electric category. For instance, Bosch has recently launched cordless power tools in-built with lithium-ion batteries in June 2019. According to FMI, over 6 out of 10 power tools sold will be from the electric category in 2022.

What Supports Continuing Dominance of Offline Sales Channels?

Instant Gratification to Push Offline sales to a Great Extent

According to FMI, offline sales channels will continue dominating through the forecast period. By 2022, offline sales are expected to account for 64.3% of the overall share. Offline sales offer instant gratification, which continues to be a key driver.

However, the COVID-19 outbreak has exposed the vulnerabilities of this medium. As a result, there is an increasing focus on diversification. Market players are exploring opportunities across online sales channels. According to FMI, online channels will report growth at a higher pace than their offline counterparts.

Start-ups for Power Tools Market

Some key start-ups in the Power Tools market include-

  • Canadian startup Ioticiti uses the Industrial Internet of Things (IIoT) to build a fleet management product. The startup’s solution equips vehicles with an M2M connectivity platform to map and manage unload wait times and optimize product deliveries. The solutions can be applied in the construction, cold-chain, and waste management industries.
  • RoboticsX is a German startup that develops machine-to-machine solutions to empower digital factories. X1 Grid, their manufacturing software platform, transfers data from connected industrial devices to enterprise resource planning (ERP) programs in real-time to increase the efficiency of the factory. The platform also assists engineers in reconfiguring devices without programming.
  • The USA-based start-up Elemental Machines provides M2M solutions for technology-based industries. Their product, Element-D, collects metadata from OEM devices to provide actionable insights about workflows, machine health, and capacity utilization. The start-up also provides solutions for monitoring ambient temperature and environmental conditions in manufacturing facilities and containers.

Who are the Leading Players in the Power Tools Market?

The top Power Tools market players are constantly upgrading their offerings to help end users. They are investing in partnerships, acquisitions, collaborations, and new product launches to gain a competitive edge in the market. For instance:

  • In October 2021, Stanley Black & Decker, Inc. entered into a partnership with Eastman to advance sustainability in the power tools industry. BLACK+DECKER, a Stanley Black & Decker brand, would be releasing a new product line, namely revival, which would be offering the brand's first sustainability-led power tools that utilize Eastman's Tritan Renew copolyester.
  • In December 2020, Hilti Corporation announced the expansion of its rotary and combination hammer tool portfolio with the next-generation TE 70-ATC/AVR, the most powerful SDS-Max combination hammer in its class. The newly launched tool would help Commercial contractors and tradespeople drill up to 40% faster in reinforced concrete and demolish more concrete.

Report Scope

Report Attribute

Details

Growth Rate

CAGR of 5.1% from 2022 to 2032

Market Value in 2022

US$ 33.36 Million

Market Value in 2032

US$ 51.2 Million

Base Year for Estimation

2021

Historical Data

2016 to 2021

Forecast Period

2022 to 2032

Quantitative Units

Revenue in US$ Million and CAGR from 2022 to 2032

Report Coverage

Revenue Forecast, Company Ranking, Competitive Landscape, Growth Factors, Trends, and Pricing Analysis

Segments Covered

  • Product Type
  • Technology
  • Application
  • Sales Channel
  • End User

Regions Covered

  • North America
  • Latin America
  • Europe
  • East Asia
  • South Asia
  • Oceania
  • Middle East and Africa (MEA)

Key Countries Profiled

  • USA
  • Canada
  • Brazil
  • Mexico
  • Germany
  • United Kingdom
  • France
  • Spain
  • Italy
  • China
  • Japan
  • South Korea
  • Malaysia
  • Singapore
  • Australia
  • New Zealand
  • GCC Countries
  • South Africa
  • Israel

Key Companies Profiled

  • Robert Bosch Power Tools GmbH
  • Stanley Black & Decker, Inc.
  • Makita Corporation
  • Hilti Corporation
  • Atlas Copco AB
  • Techtronic Industries Company Limited
  • Snap-on Incorporated
  • Actuant Corporation
  • Husqvarna AB
  • Illinois Tool Works
  • Panasonic Corporation
  • Hitachi Corporation
  • Ingersoll Rand, Inc.
  • Enerpac Tool Group
  • Kyocera Corporation
  • Apex Tool Group
  • Ridgid Tools
  • Koki Holdings Co., Ltd.

Key Segments Covered in the Power Tools Industry Analysis

By Product Type:

  • Drilling Tool
  • Fastening Tool
  • Heat Gun
  • Angle Grinder
  • Chain Saw
  • Orbital Sander
  • Jigsaw
  • Impact Wrench
  • Circular Saw

By Technology:

  • Electric
    • Corded
    • Cordless
  • Pneumatic

By Application:

  • Manufacturing
    • Metal Fabrication
    • Automotive
    • Railways
    • Aerospace
    • Furniture
    • Others
  • MRO Services
    • Facility Management
    • Automotive
    • Aerospace
    • Other Industrial
  • DIY
  • Construction

By Sales Channel:

  • Online
  • Offline

By Region:

  • North America
  • Latin America
  • Western Europe
  • Eastern Europe
  • Asia Pacific Excluding Japan
  • Japan
  • Middle East and Africa (MEA)

Frequently Asked Questions

As of 2022, the Power Tools market is slated to reach a valuation of US$ 33.36 Million.

From 2022 to 2032, sales of Power Tools are expected to grow at a 5.1% CAGR.

By 2032, Future Market Insights expects the Power Tools market to reach US$ 51.2 Million.

Table of Content

1. Executive Summary | Power Tools Market

    1.1. Global Market Outlook

    1.2. Demand Side Trends

    1.3. Supply Side Trends

    1.4. Analysis and Recommendations

2. Market Overview

    2.1. Market Coverage / Taxonomy

    2.2. Market Definition / Scope / Limitations

3. Key Market Trends

    3.1. Key Trends Impacting the Market

    3.2. Product Innovation / Development Trends

4. Key Success Factors

    4.1. Product Adoption / Usage Analysis

    4.2. Product USPs / Features

    4.3. Strategic Promotional Strategies

5. Global Market Demand Analysis 2016 to 2021 and Forecast, 2022 to 2032

    5.1. Historical Market Volume (Units) Analysis, 2016 to 2021

    5.2. Current and Future Market Volume (Units) Projections, 2022 to 2032

    5.3. Y-o-Y Growth Trend Analysis

6. Global Market - Pricing Analysis

    6.1. Regional Pricing Analysis by Product Type

    6.2. Global Average Pricing Analysis Benchmark

7. Global Market Demand (in Value or Size in US$ Million) Analysis 2016 to 2021 and Forecast, 2022 to 2032

    7.1. Historical Market Value (US$ Million) Analysis, 2016 to 2021

    7.2. Current and Future Market Value (US$ Million) Projections, 2022 to 2032

        7.2.1. Y-o-Y Growth Trend Analysis

        7.2.2. Absolute $ Opportunity Analysis

8. Market Background

    8.1. Macro-Economic Factors

        8.1.1. Global GDP Growth Outlook

        8.1.2. Global Industry Value-Added Outlook

        8.1.3. Global Construction Industry Growth Outlook

        8.1.4. Other Macro-Economic Factors

    8.2. Forecast Factors - Relevance & Impact

        8.2.1. Top Companies Historical Growth

        8.2.2. Repair and Maintenance Services Outlook

    8.3. Value Chain

    8.4. List of Key Market Participants

    8.5. COVID-19 Crisis – Impact Assessment

        8.5.1. Current Statistics

        8.5.2. Short-Mid-Long Term Outlook

        8.5.3. Likely Rebound

    8.6. Market Dynamics

        8.6.1. Drivers

        8.6.2. Restraints

        8.6.3. Opportunity Analysis

9. Global Market Analysis 2016 to 2021 and Forecast 2022 to 2032, by Product type

    9.1. Introduction / Key Findings

    9.2. Historical Market Size (US$ Million) and Volume Analysis By Product Type, 2016 to 2021

    9.3. Current and Future Market Size (US$ Million) and Volume Analysis and Forecast By Product Type, 2022 to 2032

        9.3.1. Drilling Tool

        9.3.2. Fastening Tool

        9.3.3. Heat Gun

        9.3.4. Angle Grinder

        9.3.5. Chain Saw

        9.3.6. Orbital Sander

        9.3.7. Jigsaw

        9.3.8. Impact Wrench

        9.3.9. Circular Saw

    9.4. Market Attractiveness Analysis By Product type

10. Global Market Analysis 2016 to 2021 and Forecast 2022 to 2032, by Technology

    10.1. Introduction / Key Findings

    10.2. Historical Market Size (US$ Million) and Volume Analysis By Technology, 2016 to 2021

    10.3. Current and Future Market Size (US$ Million) and Volume Analysis and Forecast By Technology, 2022 to 2032

        10.3.1. Electric

            10.3.1.1. Corded

            10.3.1.2. Cordless

                10.3.1.2.1. Ni-Cd

                10.3.1.2.2. Ni-MH

                10.3.1.2.3. Li-ion

        10.3.2. Pneumatic

    10.4. Market Attractiveness Analysis By Technology

11. Global Market Analysis 2016 to 2021 and Forecast 2022 to 2032, by Application

    11.1. Introduction / Key Findings

    11.2. Historical Market Size (US$ Million) and Volume Analysis By Technology, 2016 to 2021

    11.3. Current and Future Market Size (US$ Million) and Volume Analysis and Forecast By Application, 2022 to 2032

        11.3.1. Manufacturing

            11.3.1.1. Metal Fabrication

            11.3.1.2. Automotive

            11.3.1.3. Railways

            11.3.1.4. Aerospace

            11.3.1.5. Furniture

            11.3.1.6. Others

        11.3.2. MRO Services

            11.3.2.1. Facility Management

            11.3.2.2. Automotive

            11.3.2.3. Aerospace

            11.3.2.4. Other Industrial

        11.3.3. DIY

        11.3.4. Construction

    11.4. Market Attractiveness Analysis By Application

12. Global Market Analysis 2016 to 2021 and Forecast 2022 to 2032, by Sales Channel

    12.1. Introduction / Key Findings

    12.2. Historical Market Size (US$ Million) and Volume Analysis By Sales Channel, 2016 to 2021

    12.3. Current and Future Market Size (US$ Million) and Volume Analysis and Forecast By Sales Channel, 2022 to 2032

        12.3.1. Online

        12.3.2. Offline

    12.4. Market Attractiveness Analysis By Sales Channel

13. Global Market Analysis 2016 to 2021 and Forecast 2022 to 2032, by Region

    13.1. Introduction

    13.2. Historical Market Size (US$ Million) and Volume Analysis By Region, 2016 to 2021

    13.3. Current Market Size (US$ Million) and Volume Analysis and Forecast By Region, 2022 to 2032

        13.3.1. North America

        13.3.2. Latin America

        13.3.3. Europe

        13.3.4. South Asia and Pacific

        13.3.5. East Asia

        13.3.6. Middle East & Africa

    13.4. Market Attractiveness Analysis By Region

14. North America Market Analysis 2016 to 2021 and Forecast 2022 to 2032

    14.1. Introduction

    14.2. Pricing Analysis

    14.3. Historical Market Size (US$ Million) and Volume Trend Analysis By Market Taxonomy, 2016 to 2021

    14.4. Market Size (US$ Million) and Volume Forecast By Market Taxonomy, 2022 to 2032

        14.4.1. By Country

            14.4.1.1. USA

            14.4.1.2. Canada

        14.4.2. By Product type

        14.4.3. By Technology

        14.4.4. By Application

        14.4.5. By Sales Channel

    14.5. Market Attractiveness Analysis

        14.5.1. By Country

        14.5.2. By Product type

        14.5.3. By Technology

        14.5.4. By Application

        14.5.5. By Sales Channel

    14.6. Drivers and Restraints - Impact Analysis

15. Latin America Market Analysis 2016 to 2021 and Forecast 2022 to 2032

    15.1. Introduction

    15.2. Pricing Analysis

    15.3. Historical Market Size (US$ Million) and Volume Trend Analysis By Market Taxonomy, 2016 to 2021

    15.4. Market Size (US$ Million) and Volume Forecast By Market Taxonomy, 2022 to 2032

        15.4.1. By Country

            15.4.1.1. Brazil

            15.4.1.2. Mexico

            15.4.1.3. Rest of Latin America

        15.4.2. By Product type

        15.4.3. By Technology

        15.4.4. By Application

        15.4.5. By Sales Channel

    15.5. Market Attractiveness Analysis

        15.5.1. By Country

        15.5.2. By Product type

        15.5.3. By Technology

        15.5.4. By Application

        15.5.5. By Sales Channel

    15.6. Drivers and Restraints - Impact Analysis

16. Europe Market Analysis 2016 to 2021 and Forecast 2022 to 2032

    16.1. Introduction

    16.2. Pricing Analysis

    16.3. Historical Market Size (US$ Million) and Volume Trend Analysis By Market Taxonomy, 2016 to 2021

    16.4. Market Size (US$ Million) and Volume Forecast By Market Taxonomy, 2022 to 2032

        16.4.1. By Country

            16.4.1.1. Germany

            16.4.1.2. Italy

            16.4.1.3. France

            16.4.1.4. United Kingdom

            16.4.1.5. Spain

            16.4.1.6. BENELUX

            16.4.1.7. Russia

            16.4.1.8. Rest of Europe

        16.4.2. By Product type

        16.4.3. By Technology

        16.4.4. By Application

        16.4.5. By Sales Channel

    16.5. Market Attractiveness Analysis

        16.5.1. By Country

        16.5.2. By Product type

        16.5.3. By Technology

        16.5.4. By Application

        16.5.5. By Sales Channel

    16.6. Drivers and Restraints - Impact Analysis

17. South Asia and Pacific Market Analysis 2016 to 2021 and Forecast 2022 to 2032

    17.1. Introduction

    17.2. Pricing Analysis

    17.3. Historical Market Size (US$ Million) and Volume Trend Analysis By Market Taxonomy, 2016 to 2021

    17.4. Market Size (US$ Million) and Volume Forecast By Market Taxonomy, 2022 to 2032

        17.4.1. By Country

            17.4.1.1. India

            17.4.1.2. Thailand

            17.4.1.3. Indonesia

            17.4.1.4. Malaysia

            17.4.1.5. Oceania

            17.4.1.6. Rest of South Asia and Pacific

        17.4.2. By Product type

        17.4.3. By Technology

        17.4.4. By Application

        17.4.5. By Sales Channel

    17.5. Market Attractiveness Analysis

        17.5.1. By Country

        17.5.2. By Product type

        17.5.3. By Technology

        17.5.4. By Application

        17.5.5. By Sales Channel

    17.6. Drivers and Restraints - Impact Analysis

18. East Asia Market Analysis 2016 to 2021 and Forecast 2022 to 2032

    18.1. Introduction

    18.2. Pricing Analysis

    18.3. Historical Market Size (US$ Million) and Volume Trend Analysis By Market Taxonomy, 2016 to 2021

    18.4. Market Size (US$ Million) and Volume Forecast By Market Taxonomy, 2022 to 2032

        18.4.1. By Country

            18.4.1.1. China

            18.4.1.2. Japan

            18.4.1.3. South Korea

        18.4.2. By Product type

        18.4.3. By Technology

        18.4.4. By Application

        18.4.5. By Sales Channel

    18.5. Market Attractiveness Analysis

        18.5.1. By Country

        18.5.2. By Product type

        18.5.3. By Technology

        18.5.4. By Application

        18.5.5. By Sales Channel

    18.6. Drivers and Restraints - Impact Analysis

19. Middle East and Africa Market Analysis 2016 to 2021 and Forecast 2022 to 2032

    19.1. Introduction

    19.2. Pricing Analysis

    19.3. Historical Market Size (US$ Million) and Volume Trend Analysis By Market Taxonomy, 2016 to 2021

    19.4. Market Size (US$ Million) and Volume Forecast By Market Taxonomy, 2022 to 2032

        19.4.1. By Country

            19.4.1.1. GCC Countries

            19.4.1.2. Turkey

            19.4.1.3. Northern Africa

            19.4.1.4. South Africa

            19.4.1.5. Rest of Middle East and Africa

        19.4.2. By Product type

        19.4.3. By Technology

        19.4.4. By Application

        19.4.5. By Sales Channel

    19.5. Market Attractiveness Analysis

        19.5.1. By Country

        19.5.2. By Product type

        19.5.3. By Technology

        19.5.4. By Application

        19.5.5. By Sales Channel

    19.6. Drivers and Restraints - Impact Analysis

20. Key and Emerging Countries Market Analysis

    20.1. USA Market Analysis

        20.1.1. By Product type

        20.1.2. By Technology

        20.1.3. By Application

        20.1.4. By Sales Channel

    20.2. Canada Market Analysis

        20.2.1. By Product type

        20.2.2. By Technology

        20.2.3. By Application

        20.2.4. By Sales Channel

    20.3. Mexico Market Analysis

        20.3.1. By Product type

        20.3.2. By Technology

        20.3.3. By Application

        20.3.4. By Sales Channel

    20.4. Brazil Market Analysis

        20.4.1. By Product type

        20.4.2. By Technology

        20.4.3. By Application

        20.4.4. By Sales Channel

    20.5. Germany Market Analysis

        20.5.1. By Product type

        20.5.2. By Technology

        20.5.3. By Application

        20.5.4. By Sales Channel

    20.6. Italy Market Analysis

        20.6.1. By Product type

        20.6.2. By Technology

        20.6.3. By Application

        20.6.4. By Sales Channel

    20.7. France Market Analysis

        20.7.1. By Product type

        20.7.2. By Technology

        20.7.3. By Application

        20.7.4. By Sales Channel

    20.8. United Kingdom Market Analysis

        20.8.1. By Product type

        20.8.2. By Technology

        20.8.3. By Application

        20.8.4. By Sales Channel

    20.9. Spain Market Analysis

        20.9.1. By Product type

        20.9.2. By Technology

        20.9.3. By Application

        20.9.4. By Sales Channel

    20.10. Russia Market Analysis

        20.10.1. By Product type

        20.10.2. By Technology

        20.10.3. By Application

        20.10.4. By Sales Channel

    20.11. China Market Analysis

        20.11.1. By Product type

        20.11.2. By Technology

        20.11.3. By Application

        20.11.4. By Sales Channel

    20.12. Japan Market Analysis

        20.12.1. By Product type

        20.12.2. By Technology

        20.12.3. By Application

        20.12.4. By Sales Channel

    20.13. S. Korea Market Analysis

        20.13.1. By Product type

        20.13.2. By Technology

        20.13.3. By Application

        20.13.4. By Sales Channel

    20.14. India Market Analysis

        20.14.1. By Product type

        20.14.2. By Technology

        20.14.3. By Application

        20.14.4. By Sales Channel

    20.15. ASEAN Market Analysis

        20.15.1. By Product type

        20.15.2. By Technology

        20.15.3. By Application

        20.15.4. By Sales Channel

    20.16. Australia and New Zealand Market Analysis

        20.16.1. By Product type

        20.16.2. By Technology

        20.16.3. By Application

        20.16.4. By Sales Channel

    20.17. Turkey Market Analysis

        20.17.1. By Product type

        20.17.2. By Technology

        20.17.3. By Application

        20.17.4. By Sales Channel

    20.18. South Africa Market Analysis

        20.18.1. By Product type

        20.18.2. By Technology

        20.18.3. By Application

        20.18.4. By Sales Channel

21. Market Structure Analysis

    21.1. Market Analysis by Tier of Companies

    21.2. Market Share Analysis of Top Players

    21.3. Market Presence Analysis

22. Competition Analysis

    22.1. Competition Dashboard

    22.2. Competition Benchmarking

    22.3. Competition Deep Dive

        22.3.1. Robert Bosch GmbH

            22.3.1.1. Overview

            22.3.1.2. Product Portfolio

            22.3.1.3. Sales Footprint

            22.3.1.4. Strategy Overview

        22.3.2. Stanley Black & Decker, Inc.

            22.3.2.1. Overview

            22.3.2.2. Product Portfolio

            22.3.2.3. Sales Footprint

            22.3.2.4. Strategy Overview

        22.3.3. Makita Corporation

            22.3.3.1. Overview

            22.3.3.2. Product Portfolio

            22.3.3.3. Sales Footprint

            22.3.3.4. Strategy Overview

        22.3.4. Hilti Corporation

            22.3.4.1. Overview

            22.3.4.2. Product Portfolio

            22.3.4.3. Sales Footprint

            22.3.4.4. Strategy Overview

        22.3.5. Atlas Copco AB

            22.3.5.1. Overview

            22.3.5.2. Product Portfolio

            22.3.5.3. Sales Footprint

            22.3.5.4. Strategy Overview

        22.3.6. Techtronic Industries Company Limited

            22.3.6.1. Overview

            22.3.6.2. Product Portfolio

            22.3.6.3. Sales Footprint

            22.3.6.4. Strategy Overview

        22.3.7. Snap-on Incorporated

            22.3.7.1. Overview

            22.3.7.2. Product Portfolio

            22.3.7.3. Sales Footprint

            22.3.7.4. Strategy Overview

        22.3.8. Actuant Corporation

            22.3.8.1. Overview

            22.3.8.2. Product Portfolio

            22.3.8.3. Sales Footprint

            22.3.8.4. Strategy Overview

        22.3.9. Husqvarna AB

            22.3.9.1. Overview

            22.3.9.2. Product Portfolio

            22.3.9.3. Sales Footprint

            22.3.9.4. Strategy Overview

        22.3.10. ITW

            22.3.10.1. Overview

            22.3.10.2. Product Portfolio

            22.3.10.3. Sales Footprint

            22.3.10.4. Strategy Overview

        22.3.11. Panasonic Corporation

            22.3.11.1. Overview

            22.3.11.2. Product Portfolio

            22.3.11.3. Sales Footprint

            22.3.11.4. Strategy Overview

        22.3.12. Hitachi

            22.3.12.1. Overview

            22.3.12.2. Product Portfolio

            22.3.12.3. Sales Footprint

            22.3.12.4. Strategy Overview

        22.3.13. Ingersoll Rand, Inc.

            22.3.13.1. Overview

            22.3.13.2. Product Portfolio

            22.3.13.3. Sales Footprint

            22.3.13.4. Strategy Overview

        22.3.14. ENERPAC tool group

            22.3.14.1. Overview

            22.3.14.2. Product Portfolio

            22.3.14.3. Sales Footprint

            22.3.14.4. Strategy Overview

        22.3.15. Kyocera Corporation

            22.3.15.1. Overview

            22.3.15.2. Product Portfolio

            22.3.15.3. Sales Footprint

            22.3.15.4. Strategy Overview

        22.3.16. Apex tool group

            22.3.16.1. Overview

            22.3.16.2. Product Portfolio

            22.3.16.3. Sales Footprint

            22.3.16.4. Strategy Overview

        22.3.17. Ridgid

            22.3.17.1. Overview

            22.3.17.2. Product Portfolio

            22.3.17.3. Sales Footprint

            22.3.17.4. Strategy Overview

        22.3.18. Koki Holdings Co., Ltd.

            22.3.18.1. Overview

            22.3.18.2. Product Portfolio

            22.3.18.3. Sales Footprint

            22.3.18.4. Strategy Overview

        22.3.19. C. & E. Fein GmbH

            22.3.19.1. Overview

            22.3.19.2. Product Portfolio

            22.3.19.3. Sales Footprint

            22.3.19.4. Strategy Overview

        22.3.20. DeWalt

            22.3.20.1. Overview

            22.3.20.2. Product Portfolio

            22.3.20.3. Sales Footprint

            22.3.20.4. Strategy Overview

        22.3.21. Milwaukee Electric Tool

            22.3.21.1. Overview

            22.3.21.2. Product Portfolio

            22.3.21.3. Sales Footprint

            22.3.21.4. Strategy Overview

        22.3.22. Andreas Stihl AG & Co.

            22.3.22.1. Overview

            22.3.22.2. Product Portfolio

            22.3.22.3. Sales Footprint

            22.3.22.4. Strategy Overview

23. Assumptions and Acronyms Used

24. Research Methodology

Don't pay for what you don't need

Customize your report by selecting specific countries or regions and save 30%!

List of Tables

Table 01: Global Market Volume (Units) Forecast by Product Type, 2016 to 2032

Table 02: Global Market Size (US$ Million) & Volume (Units) Forecast by Product Type, 2016 to 2032

Table 03: Global Market Size (US$ Million) & Volume (Units) Forecast by Technology, 2016 to 2032

Table 04: Global Market Size (US$ Million) & Volume (Units) Forecast by Application, 2016 to 2032

Table 05: Global Market Size (US$ Million) & Volume (Units) Forecast by Sales Channel, 2016 to 2032

Table 06: Global Market Size (US$ Million) & Volume (Units) Forecast by Region, 2016 to 2032

Table 07: North America Market Size (US$ Million) & Volume (Units) Forecast by Country, 2016 to 2032

Table 08: North America Market Size (US$ Million) & Volume (Units) Forecast by Product Type, 2016 to 2032

Table 09: North America Market Size (US$ Million) & Volume (Units) Forecast by Technology, 2016 to 2032

Table 10: North America Market Size (US$ Million) & Volume (Units) Forecast by Application, 2016 to 2032

Table 11: North America Market Size (US$ Million) & Volume (Units) Forecast by Sales Channel, 2016 to 2032

Table 12: Latin America Market Size (US$ Million) & Volume (Units) Forecast by Country, 2016 to 2032

Table 13: Latin America Market Size (US$ Million) & Volume (Units) Forecast by Product Type, 2016 to 2032

Table 14: Latin America Market Size (US$ Million) & Volume (Units) Forecast by Technology, 2016 to 2032

Table 15: Latin America Market Size (US$ Million) & Volume (Units) Forecast by Application, 2016 to 2032

Table 16: Latin America Market Size (US$ Million) & Volume (Units) Forecast by Sales Channel, 2016 to 2032

Table 17: Europe Market Size (US$ Million) & Volume (Units) Forecast by Country, 2016 to 2032

Table 18: Europe Market Size (US$ Million) & Volume (Units) Forecast by Product Type, 2016 to 2032

Table 19: Europe Market Size (US$ Million) & Volume (Units) Forecast by Technology, 2016 to 2032

Table 20: Europe Market Size (US$ Million) & Volume (Units) Forecast by Application, 2016 to 2032

Table 21: Europe Market Size (US$ Million) & Volume (Units) Forecast by Sales Channel, 2016 to 2032

Table 22: East Asia Market Size (US$ Million) & Volume (Units) Forecast by Country, 2016 to 2032

Table 23: East Asia Market Size (US$ Million) & Volume (Units) Forecast by Product Type, 2016 to 2032

Table 24: East Asia Market Size (US$ Million) & Volume (Units) Forecast by Technology, 2016 to 2032

Table 25: East Asia Market Size (US$ Million) & Volume (Units) Forecast by Application, 2016 to 2032

Table 26: East Asia Market Size (US$ Million) & Volume (Units) Forecast by Sales Channel, 2016 to 2032

Table 27: South Asia Pacific Market Size (US$ Million) & Volume (Units) Forecast by Country, 2016 to 2032

Table 28: South Asia Pacific Market Size (US$ Million) & Volume (Units) Forecast by Product Type, 2016 to 2032

Table 29: South Asia Pacific Market Size (US$ Million) & Volume (Units) Forecast by Technology, 2016 to 2032

Table 30: South Asia Pacific Market Size (US$ Million) & Volume (Units) Forecast by Application, 2016 to 2032

Table 31: South Asia Pacific Market Size (US$ Million) & Volume (Units) Forecast by Sales Channel, 2016 to 2032

Table 32: MEA Market Size (US$ Million) & Volume (Units) Forecast by Country, 2016 to 2032

Table 33: MEA Market Size (US$ Million) & Volume (Units) Forecast by Product Type, 2016 to 2032

Table 34: MEA Market Size (US$ Million) & Volume (Units) Forecast by Technology, 2016 to 2032

Table 35: MEA Market Size (US$ Million) & Volume (Units) Forecast by Application, 2016 to 2032

Table 36: MEA Market Size (US$ Million) & Volume (Units) Forecast by Sales Channel, 2016 to 2032
Nikhil Kaitwade
Nikhil Kaitwade
Principal Consultant
LinkedIn
Talk to Analyst

Find your sweet spots for generating winning opportunities in this market.

Talk to Analyst

List of Charts

Figure 1: Global Market Historical Volume (Units), 2016 to 2021

Figure 2: Global Market Volume (Units) Forecast, 2022 to 2032

Figure 3: Global Market Value (US$ Million) Historical Data and Forecast 2016 to 2032

Figure 4: Global Market Absolute $ Opportunity Analysis, 2016 to 2032

Figure 5: Global Market Share and BPS Analysis by Product Type- 2022 & 2032

Figure 6: Global Market Y-o-Y Growth Projections by Product Type, 2022 to 2032

Figure 7: Global Market Attractiveness by Product Type, 2022 to 2032

Figure 8: Global Market Absolute $ Opportunity by Product Type

Figure 9: Global Market Share and BPS Analysis by Technology- 2022 & 2032

Figure 10: Global Market Y-o-Y Growth Projections by Technology, 2022 to 2032

Figure 11: Global Market Attractiveness by Technology, 2022 to 2032

Figure 12: Global Market Absolute $ Opportunity by Technology

Figure 13: Global Market Share and BPS Analysis by Application- 2022 & 2032

Figure 14: Global Market Y-o-Y Growth Projections by Application, 2022 to 2032

Figure 15: Global Market Attractiveness by Application, 2022 to 2032

Figure 16: Global Market Absolute $ Opportunity by Application

Figure 17: Global Market Share and BPS Analysis by Sales Channel- 2022 & 2032

Figure 18: Global Market Y-o-Y Growth Projections by Sales Channel, 2022 to 2032

Figure 19: Global Market Attractiveness by Sales Channel, 2022 to 2032

Figure 20: Global Market Absolute $ Opportunity by Sales Channel

Figure 21: Global Market Share and BPS Analysis by Region- 2022 & 2032

Figure 22: Global Market Y-o-Y Growth Projections by Region, 2022 to 2032

Figure 23: Global Market Attractiveness by Region, 2022 to 2032

Figure 24: Global Market Absolute $ Opportunity by North America

Figure 25: Global Market Absolute $ Opportunity by Latin America

Figure 26: Global Market Absolute $ Opportunity by Europe

Figure 27: Global Market Absolute $ Opportunity by East Asia

Figure 28: Global Market Absolute $ Opportunity by South Asia Pacific

Figure 29: Global Market Absolute $ Opportunity by MEA

Figure 30: North America Market Share and BPS Analysis by Country- 2022 & 2032

Figure 31: North America Market Y-o-Y Growth Projections by Country, 2022 to 2032

Figure 32: North America Market Attractiveness by Country, 2022 to 2032

Figure 33: North America Market Share and BPS Analysis by Product Type, 2022 & 2032

Figure 34: North America Market Y-o-Y Growth Projections by Product Type, 2022 to 2032

Figure 35: North America Market Attractiveness by Product Type, 2022 to 2032

Figure 36: North America Market Share and BPS Analysis by Technology- 2022 & 2032

Figure 37: North America Market Y-o-Y Growth Projections by Technology, 2022 to 2032

Figure 38: North America Market Attractiveness by Technology, 2022 to 2032

Figure 39: North America Market Share and BPS Analysis by Application– 2022 & 2032

Figure 40: North America Market Y-o-Y Growth Projections by Application, 2022 to 2032

Figure 41: North America Market Attractiveness by Application, 2022 to 2032

Figure 42: North America Market Share and BPS Analysis by Sales Channel- 2022 & 2032

Figure 43: North America Market Y-o-Y Growth Projections by Sales Channel, 2022 to 2032

Figure 44: North America Market Attractiveness by Sales Channel, 2022 to 2032

Figure 45: Latin America Market Share and BPS Analysis by Country- 2022 & 2032

Figure 46: Latin America Market Y-o-Y Growth Projections by Country, 2022 to 2032

Figure 47: Latin America Market Attractiveness by Country, 2022 to 2032

Figure 48: Latin America Market Share and BPS Analysis by Product Type, 2022 & 2032

Figure 49: Latin America Market Y-o-Y Growth Projections by Product Type, 2022 to 2032

Figure 50: Latin America Market Attractiveness by Product Type, 2022 to 2032

Figure 51: Latin America Market Share and BPS Analysis by Technology- 2022 & 2032

Figure 52: Latin America Market Y-o-Y Growth Projections by Technology, 2022 to 2032

Figure 53: Latin America Market Attractiveness by Technology, 2022 to 2032

Figure 54: Latin America Market Share and BPS Analysis by Application- 2022 & 2032

Figure 55: Latin America Market Y-o-Y Growth Projections by Application, 2022 to 2032

Figure 56: Latin America Market Attractiveness by Application, 2022 to 2032

Figure 57: Latin America Market Share and BPS Analysis by Sales Channel– 2022 & 2032

Figure 58: Latin America Market Y-o-Y Growth Projections by Sales Channel, 2022 to 2032

Figure 59: Latin America Market Attractiveness by Sales Channel, 2022 to 2032

Figure 60: Europe Market Share and BPS Analysis by Country- 2022 & 2032

Figure 61: Europe Market Y-o-Y Growth Projections by Country, 2022 to 2032

Figure 62: Europe Market Attractiveness by Country, 2022 to 2032

Figure 63: Europe Market Share and BPS Analysis by Product Type, 2022 & 2032

Figure 64: Europe Market Y-o-Y Growth Projections by Product Type, 2022 to 2032

Figure 65: Europe Market Attractiveness by Product Type, 2022 to 2032

Figure 66: Europe Market Share and BPS Analysis by Technology- 2022 & 2032

Figure 67: Europe Market Y-o-Y Growth Projections by Technology, 2022 to 2032

Figure 68: Europe Market Attractiveness by Technology, 2022 to 2032

Figure 69: Europe Market Share and BPS Analysis by Application- 2022 & 2032

Figure 70: Europe Market Y-o-Y Growth Projections by Application, 2022 to 2032

Figure 71: Europe Market Attractiveness by Application, 2022 to 2032

Figure 72: Europe Market Share and BPS Analysis by Sales Channel- 2022 & 2032

Figure 73: Europe Market Y-o-Y Growth Projections by Sales Channel, 2022 to 2032

Figure 74: Europe Market Attractiveness by Sales Channel, 2022 to 2032

Figure 75: East Asia Market Share and BPS Analysis by Country- 2022 & 2032

Figure 76: East Asia Market Y-o-Y Growth Projections by Country, 2022 to 2032

Figure 77: East Asia Market Attractiveness by Country, 2022 to 2032

Figure 78: East Asia Market Share and BPS Analysis by Product Type, 2022 & 2032

Figure 79: East Asia Market Y-o-Y Growth Projections by Product Type, 2022 to 2032

Figure 80: East Asia Market Attractiveness by Product Type, 2022 to 2032

Figure 81: East Asia Market Share and BPS Analysis by Technology- 2022 & 2032

Figure 82: East Asia Market Y-o-Y Growth Projections by Technology, 2022 to 2032

Figure 83: East Asia Market Attractiveness by Technology, 2022 to 2032

Figure 84: East Asia Market Share and BPS Analysis by Application- 2022 & 2032

Figure 85: East Asia Market Y-o-Y Growth Projections by Application, 2022 to 2032

Figure 86: East Asia Market Attractiveness by Application, 2022 to 2032

Figure 87: East Asia Market Share and BPS Analysis by Sales Channel- 2022 & 2032

Figure 88: East Asia Market Y-o-Y Growth Projections by Sales Channel, 2022 to 2032

Figure 89: East Asia Market Attractiveness by Sales Channel, 2022 to 2032

Figure 90: South Asia Pacific Market Share and BPS Analysis by Country- 2022 & 2032

Figure 91: South Asia Pacific Market Y-o-Y Growth Projections by Country, 2022 to 2032

Figure 92: South Asia Pacific Market Attractiveness by Country, 2022 to 2032

Figure 93: South Asia Pacific Market Share and BPS Analysis by Product Type, 2022 & 2032

Figure 94: South Asia Pacific Market Y-o-Y Growth Projections by Product Type, 2022 to 2032

Figure 95: South Asia Pacific Market Attractiveness by Product Type, 2022 to 2032

Figure 96: South Asia Pacific Market Share and BPS Analysis by Technology– 2022 & 2032

Figure 97: South Asia Pacific Market Y-o-Y Growth Projections by Technology, 2022 to 2032

Figure 98: South Asia Pacific Market Attractiveness by Technology, 2022 to 2032

Figure 99: South Asia Pacific Market Share and BPS Analysis by Application- 2022 & 2032

Figure 100: South Asia Pacific Market Y-o-Y Growth Projections by Application, 2022 to 2032

Figure 101: South Asia Pacific Market Attractiveness by Application, 2022 to 2032

Figure 102: South Asia Pacific Market Share and BPS Analysis by Sales Channel– 2022 & 2032

Figure 103: South Asia Pacific Market Y-o-Y Growth Projections by Sales Channel, 2022 to 2032

Figure 104: South Asia Pacific Market Attractiveness by Sales Channel, 2022 to 2032

Figure 105: MEA Market Share and BPS Analysis by Country- 2022 & 2032

Figure 106: MEA Market Y-o-Y Growth Projections by Country, 2022 to 2032

Figure 107: MEA Market Attractiveness by Country, 2022 to 2032

Figure 108: MEA Market Share and BPS Analysis by Product Type, 2022 & 2032

Figure 109: MEA Market Y-o-Y Growth Projections by Product Type, 2022 to 2032

Figure 110: MEA Market Attractiveness by Product Type, 2022 to 2032

Figure 111: MEA Market Share and BPS Analysis by Technology- 2022 & 2032

Figure 112: MEA Market Y-o-Y Growth Projections by Technology, 2022 to 2032

Figure 113: MEA Market Attractiveness by Technology, 2022 to 2032

Figure 114: MEA Market Share and BPS Analysis by Application- 2022 & 2032

Figure 115: MEA Market Y-o-Y Growth Projections by Application, 2022 to 2032

Figure 116: MEA Market Attractiveness by Application, 2022 to 2032

Figure 117: MEA Market Share and BPS Analysis by Sales Channel-2022 & 2032

Figure 118: MEA Market Y-o-Y Growth Projections by Sales Channel, 2022 to 2032

Figure 119: MEA Market Attractiveness by Sales Channel, 2022 to 2032

Recommendations

Industrial Automation

India Power Tool Market

Published : October 2022

Industrial Automation

Adoption of Benelux Power Tools Market

Published : September 2022

Industrial Automation

Power Tool Gears Market

Published : July 2022

Packaging

Tool Boxes Market

Published : June 2022

Explore Industrial Automation Insights

View Reports
Google translate